


The Marubozu is a single-candle pattern that provides clear signals of strong market entry or exit pressure. It can enhance a trader's ability to identify potential trend reversals or continuations, aiding in strategic decision-making and more informed trading. However, relying solely on the Marubozu pattern can also lead to false signals, which leads to suboptimal trading decisions.
We will dive deeper into the Marubozu Candlestick pattern in this article.
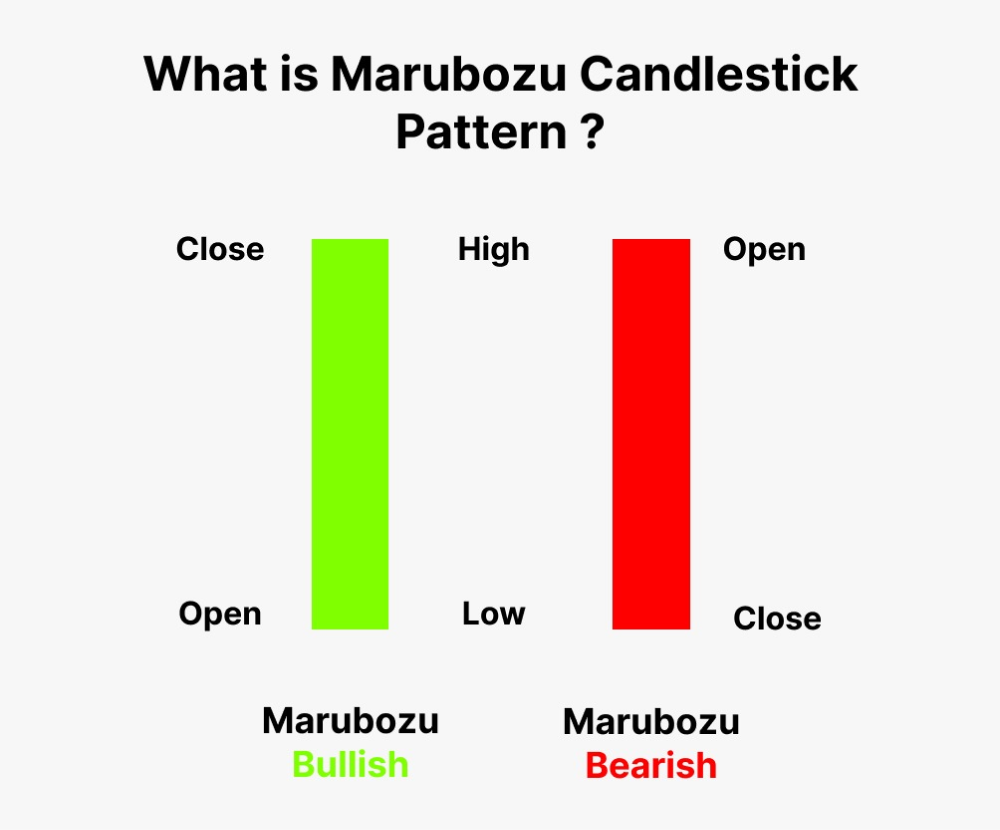
Defining the Marubozu Candlestick pattern
The Marubozu candlestick pattern is a continuation pattern that consists of a candlestick with little to no wick or shadows, indicating a strong and decisive price movement throughout the trading period.
- A bullish Marubozu has no lower wick, signifying strong purchasing momentum
- A bearish Marubozu has no upper wick, suggesting strong shorting pressure.
These patterns are often considered signals of potential continuation in a prevailing trend.
Types of Marubozu candlestick pattern
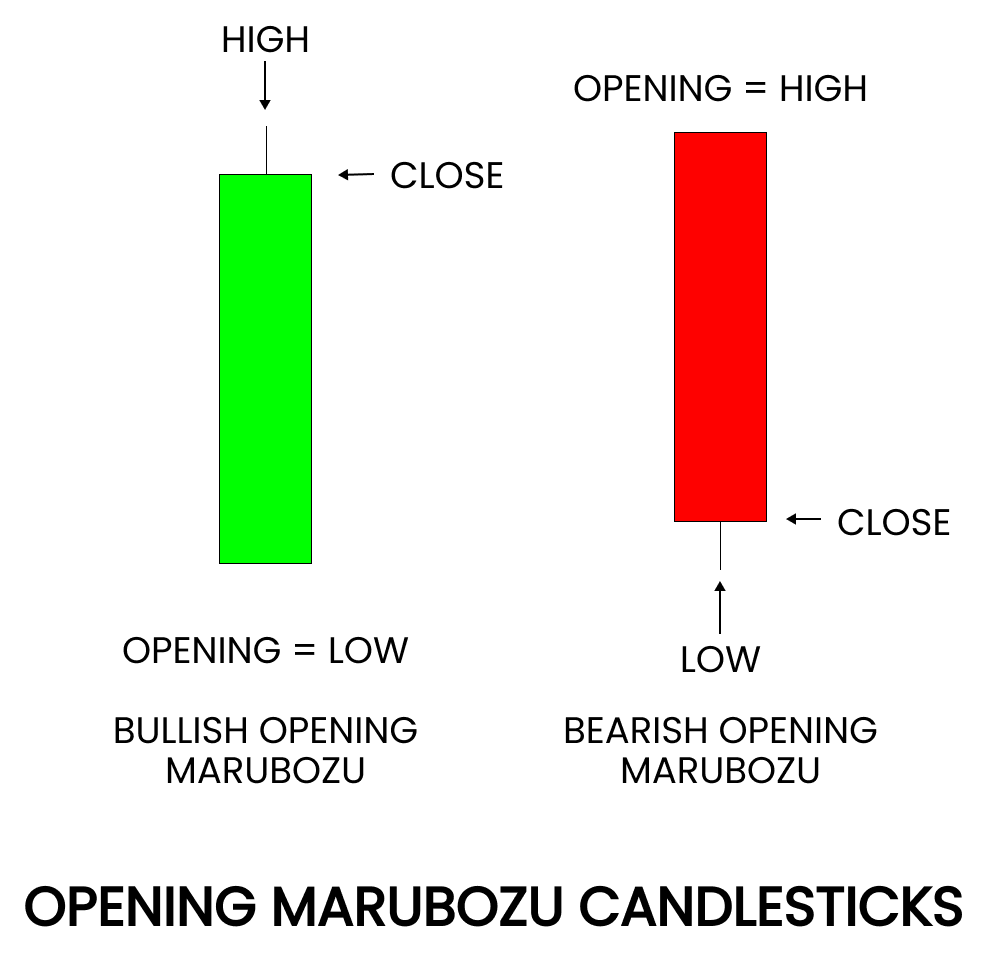
Opening Marubozu candlestick pattern
The Opening Marubozu is a candlestick pattern characterized by the absence of a lower wick, indicating that the opening price is the same as the low. At the same time, there is an upper wick, and the closing price is different from the high. This pattern suggests strong bullish momentum right from the opening of the trading session, with purchasers maintaining control despite potential gain, implying a bullish sentiment. This is also called a green/bullish Marubozu.
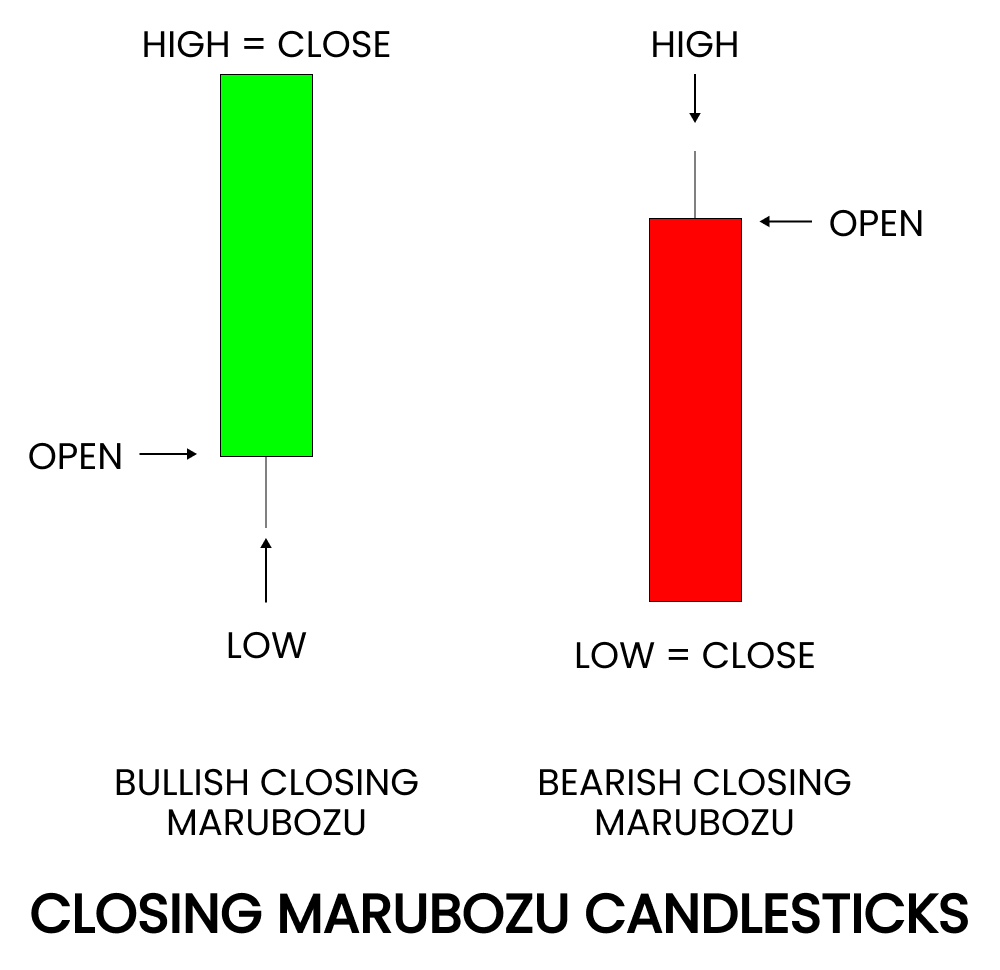
Closing Marubozu candlestick pattern
The Closing Marubozu, also called a red/bearish Marubozu, is identified by the absence of an upper wick, signifying that the closing price is the same as the high. There is a lower wick, and the opening price differs from the low. It indicates sustained bearish pressure throughout the session, with sellers dominating the market from the start to the closing bell, implying a bearish sentiment. Both patterns provide valuable insights into market dynamics, aiding traders in assessing potential trend continuation based on the prevailing trading pressure.
How to identify a Marubozu candlestick pattern?
Identifying a Marubozu candlestick pattern involves examining the characteristics of a single candlestick to determine if it fits the criteria for either a bullish or bearish Marubozu.
Bullish Marubozu
- Identify a candlestick with no upper wick, indicating that the high and closing prices are the same.
- Confirm the presence of a lower wick, signifying that the opening price differs from the low.
- Validate the pattern by ensuring that the candle has a relatively long body compared to the overall length of the candlestick, confirming sustained purchasing pressure throughout the trading period.
Bearish Marubozu
- Recognize a candlestick with no lower wick, implying that the low and closing prices are identical.
- Ensure there is an upper wick, indicating that the opening price is distinct from the high.
- Verify the pattern by confirming that the candle has a relatively long body compared to the overall length of the candlestick, confirming consistent shorting pressure during the session.
What does the Marbozu pattern indicate?
Reversals
A Marubozu pattern, characterized by a candlestick with either no upper or lower wick and a long body, often indicates a shift or reversal in market sentiment. Traders analyze these patterns to identify potential reversals in the ongoing trend, whether a continuation of the existing trend or a reversal from the prevailing market direction. The absence of wicks emphasizes sustained pressure from traders entering or exiting the market, offering insights into the possibility of a change in market dynamics.
Confirmation
Marubozu patterns are often used to confirm the strength of an existing trend. In an uptrend, a bullish Marubozu reinforces the dominance of purchasers, while in a downtrend, a bearish Marubozu underscores the control of traders who are exiting the market. Traders look for Marubozu patterns as confirmation signals to support their analysis of the prevailing market trend.
Volume
Volume analysis is crucial when interpreting Marubozu patterns as higher trading volumes accompanying a Marubozu indicate a strong market conviction. Increased volume during a bullish Marubozu suggests robust purchasing interest, while higher volume with a bearish Marubozu implies intensified exiting pressure. Traders often seek confirmation through volume analysis to validate the strength of the price movement indicated by the Marubozu pattern.
Advantages and risks of using the Marubozu Candlestick Pattern
Advantages
- Minimal price range ambiguity: Marubozu patterns offer unambiguous signals due to their distinct lack of wicks, providing traders with a straightforward representation of market sentiment during a specific time period.
- Well-defined entry and exit points: The absence of wicks in Marubozu patterns contributes to well-defined entry and exit points for traders. This clarity aids in precise decision-making when entering or exiting trades with bullish and bearish patterns.
- Versatility in different timeframes: Marubozu patterns can be effectively utilized across various timeframes, allowing traders to adapt their strategies to different market conditions and trading preferences.
- Useful in isolating support and resistance levels: Traders can use Marubozu patterns to identify key support and resistance levels, as these patterns often occur at significant price levels. This assists in chart analysis and the formulation of trading strategies.
Risks
- False signals: While Marubozu patterns are clear indicators, they can sometimes produce false signals, leading traders to make incorrect assumptions about market direction.
- Lack of context: Marubozu patterns, when considered in isolation, may lack the broader context of market conditions. Traders need to complement these patterns with other technical indicators and fundamental analysis for a comprehensive view.
- Risk of whipsaws: Rapid and unexpected market reversals, known as whipsaws, can pose a risk when relying solely on Marubozu patterns. Traders should be cautious and consider additional factors to mitigate this risk.
- Limited information: Marubozu patterns provide limited information about market dynamics, and traders should avoid relying solely on these patterns for decision-making. Supplementary analysis is crucial for a more comprehensive understanding.
- Market noise: Marubozu patterns may be subject to noise and fluctuations in certain market conditions, potentially leading to misinterpretation. Traders should be mindful of market noise and consider it in their analysis.
Top Marubozu candlestick trading indicators
Moving Average Convergence Divergence (MACD)
MACD is a trend-following momentum indicator that consists of two moving averages (fast and slow). Traders use MACD to identify potential trend changes, momentum shifts, and crossovers. When combined with the Marubozu Candlestick trading strategy, MACD acts as a confirming tool.
For example, a bullish Marubozu accompanied by MACD showing a bullish crossover may reinforce a strong uptrend, providing traders with additional confidence in their entry signals.
**This is an example only to enhance a consumer's understanding of the strategy being described above and is not to be taken as Blueberry Markets providing personal advice.
RSI (Relative Strength Index)
RSI measures the magnitude of recent price changes to evaluate overbought or oversold conditions. Traders use RSI to assess the strength of a trend and potential reversal points.
When paired with the Marubozu Candlestick strategy, RSI can offer confirmation of the current market sentiment. For instance, a bullish Marubozu accompanied by RSI in the overbought territory may suggest caution, while a bearish Marubozu with RSI in oversold conditions could indicate a potential purchasing opportunity.
Fibonacci retracement levels
Fibonacci retracement levels help identify potential support and resistance levels based on key Fibonacci ratios. Integrating Fibonacci retracement with Marubozu patterns enhances precision in determining entry and exit points. For example, if a bullish Marubozu occurs at a Fibonacci support level, it strengthens the case for a purchase signal.
**This is an example only to enhance a consumer's understanding of the strategy being described above and is not to be taken as Blueberry Markets providing personal advice.
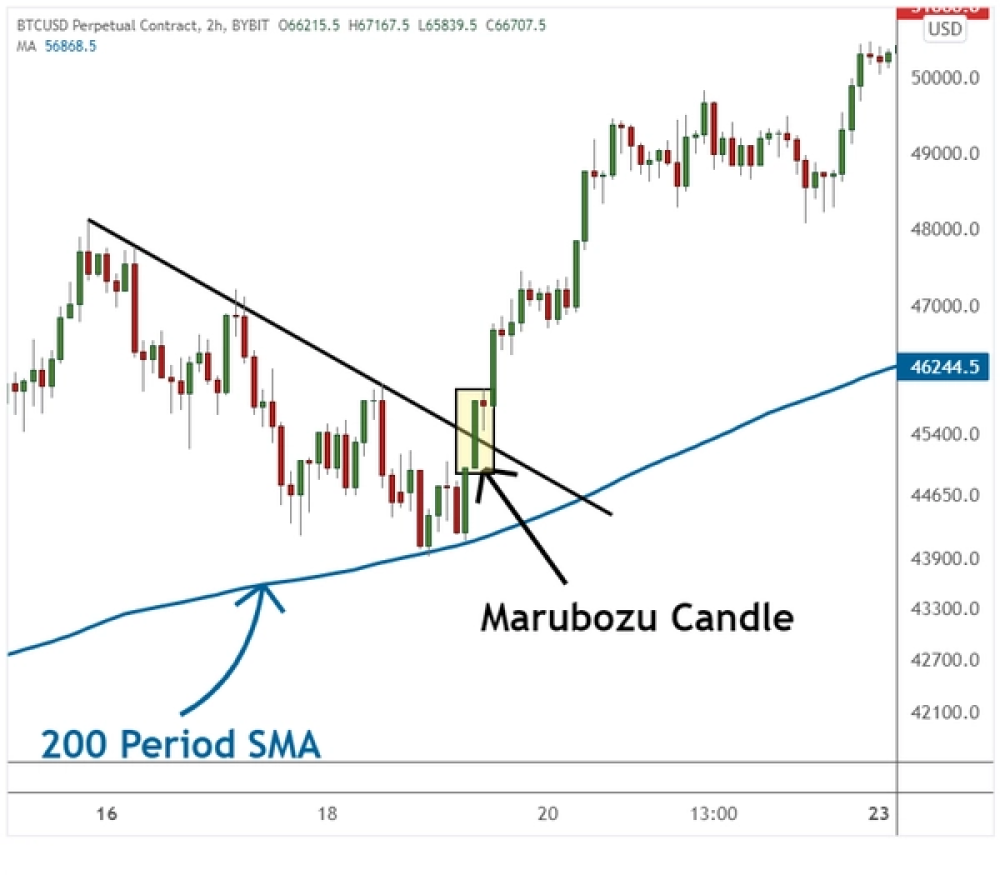
Bollinger bands
Bollinger bands consist of a middle band (simple moving average) and two outer bands representing standard deviations. Traders use Bollinger bands to gauge volatility and potential trend reversals. When combined with Marubozu patterns, Bollinger bands help traders assess the significance of the observed price movements. A bullish Marubozu expanding outside the upper Bollinger band may signal overextension, prompting traders to exercise caution and exit the trade. Conversely, a Bearish Marubozu breaching the lower Bollinger Band may indicate oversold conditions, suggesting a potential purchasing opportunity.
Top 3 Marubozu trading strategies
Swing trading with Marubozu
Swing trading with Marubozu patterns involves capturing intermediate price movements within an established trend. When employing this strategy, traders focus on identifying Bullish Marubozu patterns in an uptrend or Bearish Marubozu patterns in a downtrend. The confirmation of a prevailing trend is crucial before initiating a trade.
Furthermore, traders often look for additional technical factors such as support and resistance levels, trendlines, or Fibonacci retracement levels to pinpoint optimal entry or exit points.
By aligning with the existing trend, traders position themselves to ride the momentum generated by the Marubozu patterns, increasing the probability of favorable trades. The confirmation step acts as a filter, allowing traders to focus on Marubozu signals in harmony with the broader market dynamics, contributing to a more strategic and informed approach to swing trading.
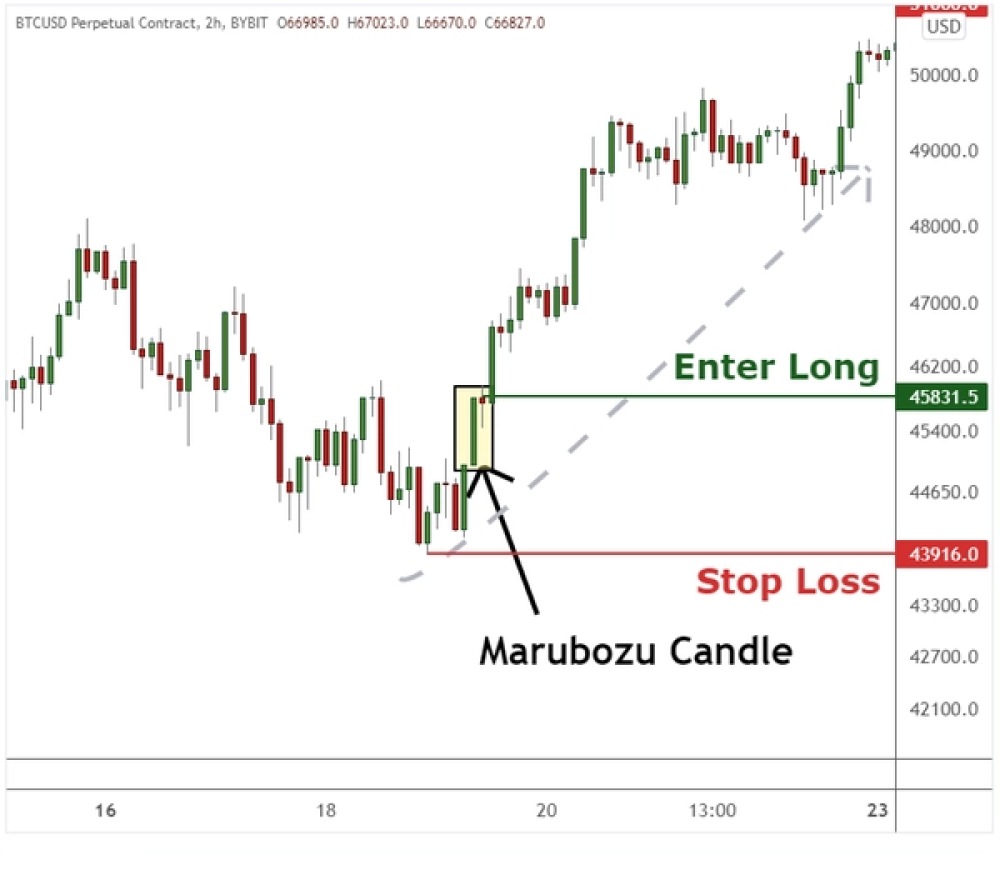
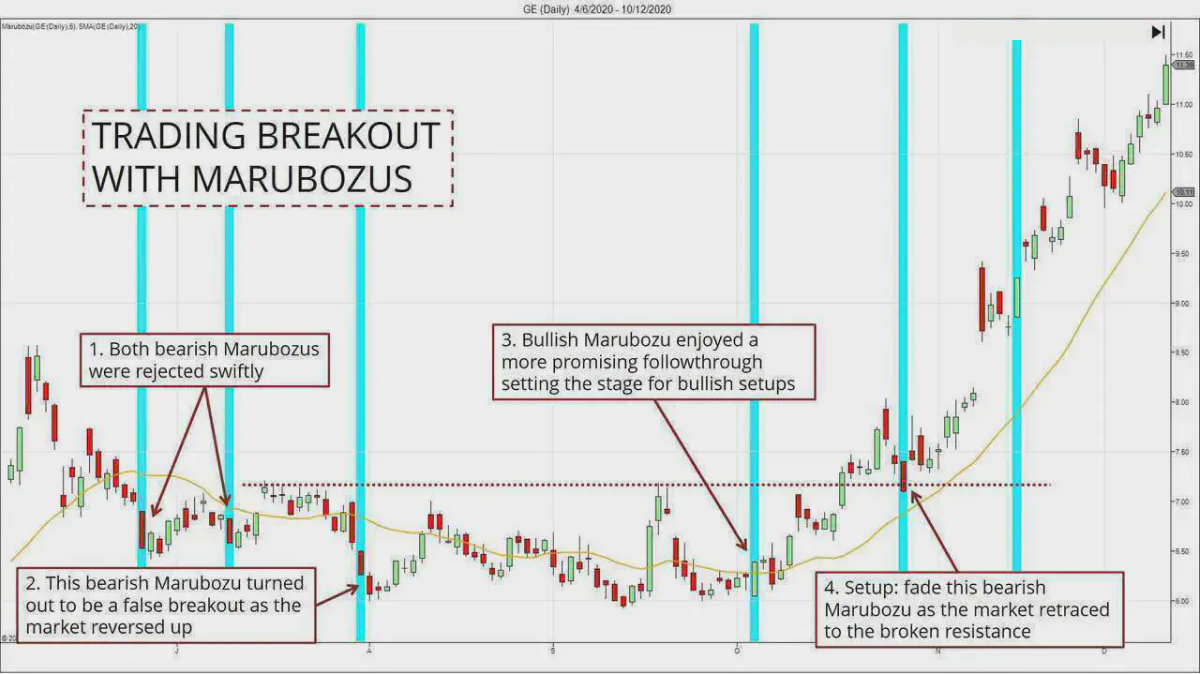
Marubozu Breakout Strategy
The Marubozu Breakout Strategy is a trading approach that capitalizes on the distinct characteristics of the Marubozu candlesticks to make informed entry and exit decisions. In this strategy, traders focus on the color of the Marubozu candle to determine market sentiment and potential price direction.
In the case of a bullish Marubozu, characterized by a green candle with little to no shadows, traders interpret this as a sign of strong purchasing pressure dominating the market. Consequently, they may initiate a long position, expecting the prevailing uptrend to continue. That means they are anticipating further price increases, and the bullish Marubozu serves as a confirmation or trigger for their entry into the market.
Conversely, when a bearish Marubozu appears, represented by a red candle with minimal shadows, it suggests robust shorting pressure. Traders employing the Marubozu Breakout Strategy may respond by initiating a short position, anticipating a sustained downtrend in prices. The bearish Marubozu serves as a signal for them to enter the market with the expectation that prices will continue to decline.
Stop-loss orders are crucial for managing the inherent risks in trading. These orders are typically placed just beyond the high or low of the Marubozu candle, depending on whether it's a bullish or bearish signal.
Marubozu reversal Strategy
The Marubozu reversal strategy seeks to identify potential trend reversals by analyzing the appearance of Marubozu candlesticks in the context of overextended market trends. This approach is particularly useful for traders looking to capitalize on shifts in market sentiment when a prevailing trend has been in place for an extended period.
In an uptrend, if the market has experienced a prolonged bullish phase and a bearish Marubozu candlestick emerges, it is interpreted as a potential signal for a reversal.
A bearish Marubozu suggests a sudden surge in shorting pressure, possibly indicating a shift in sentiment from bullish to bearish. Traders employing the Marubozu reversal strategy may consider this a cue to exit long positions or even initiate short positions in anticipation of a downward reversal.
Conversely, when prices have been decreasing over an extended period in a downtrend, the appearance of a bullish Marubozu can be seen as a potential reversal signal. It implies a sudden dominance of purchasing pressure, which might signify a shift from bearish to bullish sentiment. Traders could interpret this as an opportunity to exit short positions or potentially enter long positions, anticipating an upward reversal in prices.
To enhance the reliability of these reversal signals, traders often complement this strategy with additional technical indicators or chart patterns. These supplementary tools may include oscillators, moving averages, or trendlines that provide additional confirmation or validation of the potential trend reversal suggested by the Marubozu candlestick.
*Past performance isn't a reliable indicator of future results.
Navigating the forex market with Marubozu patterns
The Marubozu candlestick pattern offers distinct advantages, providing clear signals of the market sentiment. Traders can capitalize on trend reversals or continuations with enhanced precision. However, acknowledging the risks, such as potential false signals or lack of context, is essential. By combining Marubozu with comprehensive risk management tools, traders can harness its pros for more informed and strategic decision-making in the dynamic forex market.
Disclaimer: All material published on our website is intended for informational purposes only and should not be considered personal advice or recommendation. As margin FX/CFDs are highly leveraged products, your gains and losses are magnified, and you could lose substantially more than your initial deposit. Investing in margin FX/CFDs does not give you any entitlements or rights to the underlying assets (e.g. the right to receive dividend payments). CFDs carry a high risk of investment loss.