


The M trading pattern, also known as the double top, is a technical indicator used in financial markets to signal a potential bearish reversal. By studying this pattern, traders aim to identify potential exit opportunities and capitalize on a potential price decline.
Let’s discuss the M trading pattern and how to use it.
What is an M pattern?
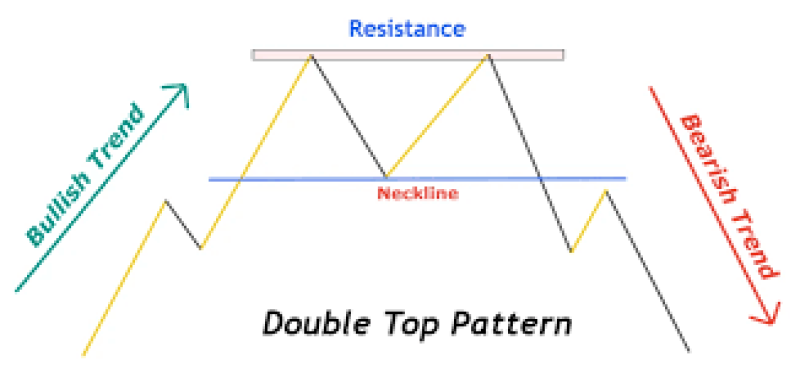
The M pattern identifies a potential reversal from an uptrend to a downtrend and resembles the letter 'M' with two distinct price peaks of roughly equal height. These peaks are separated by a trough, indicating a temporary decline in price before another rise. The M pattern suggests that upward momentum is weakening and sellers are gaining control. The components of the pattern are –
- First peak: Represents a temporary high in price, followed by a decline
- Neckline: A horizontal line drawn connecting the swing lows (valleys) between the two peaks. This line acts as a support level
- Second peak: A secondary price rise that ideally does not reach the level of the first peak, demonstrating diminishing purchase pressure
- Breakthrough: The bearish signal occurs when the price decisively falls below the neckline, suggesting a potential downtrend
Identifying M patterns
Charts
The following charts help in identifying M patterns -
Candlestick charts
Candlestick charts visually represent price movements through bars or candles, with each candle depicting the opening, closing, high, and low prices for a specific timeframe. The M pattern's two distinct peaks and a separating trough are easily identifiable using candlesticks.
The candle's body reflects the difference between the opening and closing prices, and wicks (thin lines) extend above and below the body, representing the high and low prices of the period. By analyzing the sequence of candles within the M pattern, traders can assess the strength of the uptrend before the reversal and the potential bearish momentum following the neckline break.
Kagi charts
Kagi charts differ from traditional time-based charts as they focus solely on price reversals. They utilize thick lines to represent price movements in a single direction and thin lines to depict reversals.
This visual representation allows traders to focus on significant price swings. The M pattern's clear price peaks and troughs are also evident on the Kagi charts. However, the lack of timeframe information and detailed price movements within each thick line make them appear less intuitive compared to candlesticks, especially for beginners.
Point & Figure (P&F) charts
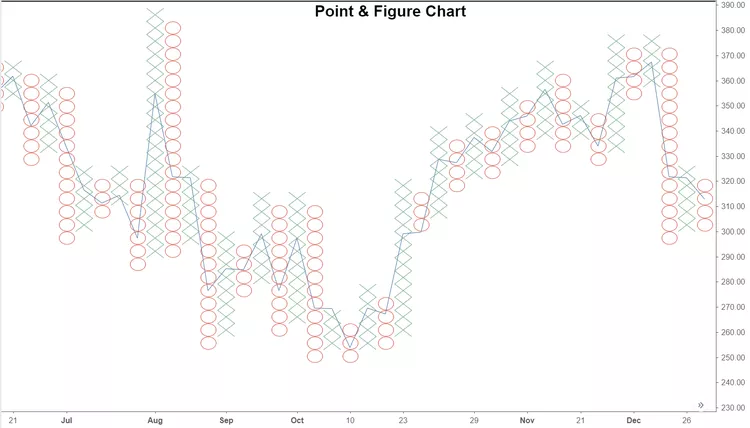
P&F charts provide a simplified view of price movements. They consist of a series of Xs and Os arranged in a grid, with each X or O representing a price change exceeding a predetermined amount (box size).
The M pattern can be identified on P&F charts through a series of Xs marking the two highs and a cluster of Os representing the trough. Traders can leverage them to identify potential M patterns and anticipate bearish reversals based on the arrangement of Xs and Os.
Heikin-Ashi charts
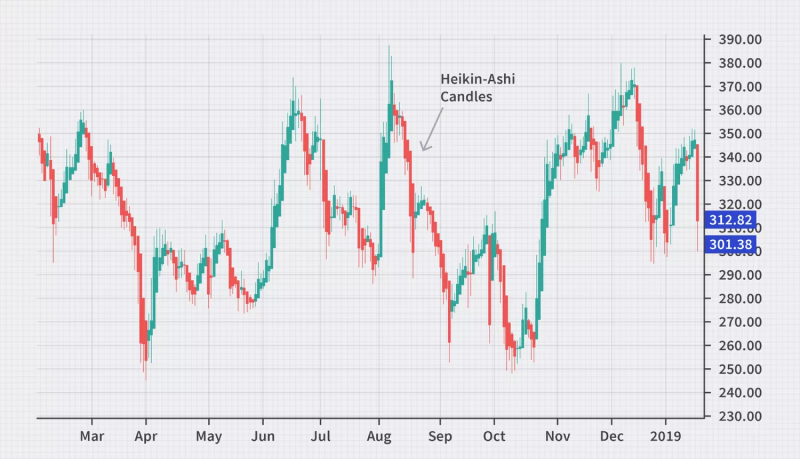
Heikin-Ashi is a candlestick chart with modified open, high, low, and close prices. These modifications create smoother price movements and potentially reduce visual noise.
Look for two consecutive Heikin-Ashi bars with relatively similar-sized real bodies (the colored portion of the bar). These represent the two peaks of the M pattern. The bearish reversal is confirmed when the price decisively breaks below the horizontal line connecting the lows (troughs) between the high bars. This breakout signifies a potential downtrend.
Indicators
Here are the indicators that help confirm the M pattern's signals in a forex market –
Parabolic SAR (Parabolic Stop and Reversal)
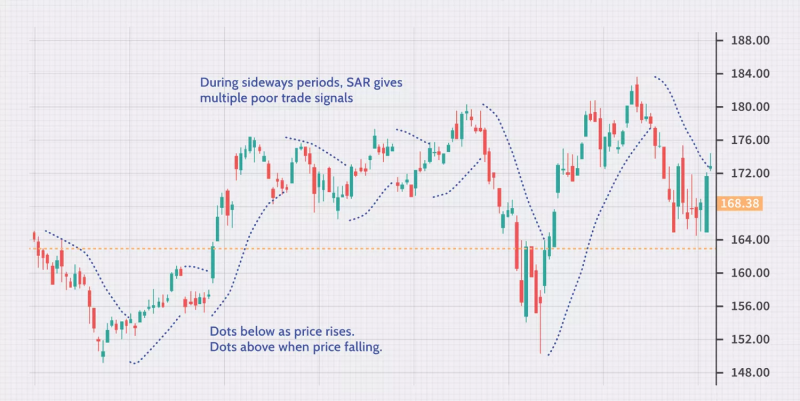
The parabolic SAR indicator plots dots above or below the price, dynamically shifting with the trend.
In an M pattern, the SAR should ideally trail below the price during the uptrend and start to shift upwards as the price reaches the second peak. This can signal a potential reversal aligned with the M pattern's bearish implications.
Average Directional Index (ADX)
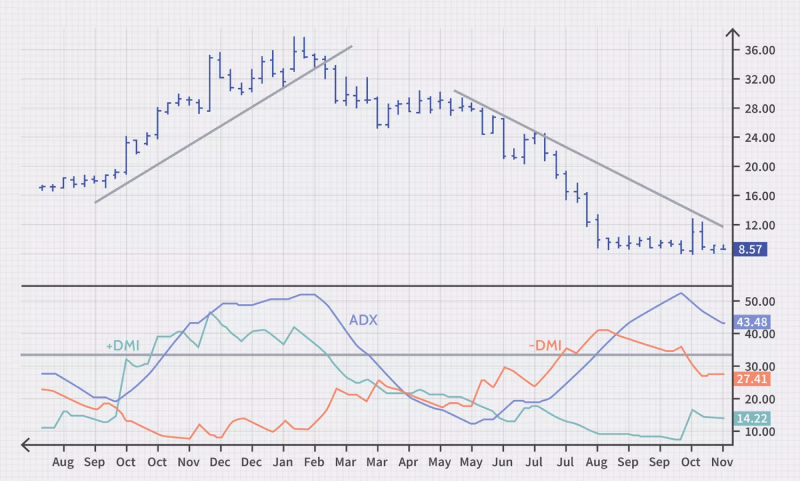
The ADX indicator measures the strength of the trend, regardless of direction. A weakening ADX reading during the formation of the M pattern can suggest diminishing momentum in the uptrend, potentially aligning with the M pattern's bearish signal and increasing confidence in the reversal signal.
Stochastic Oscillator
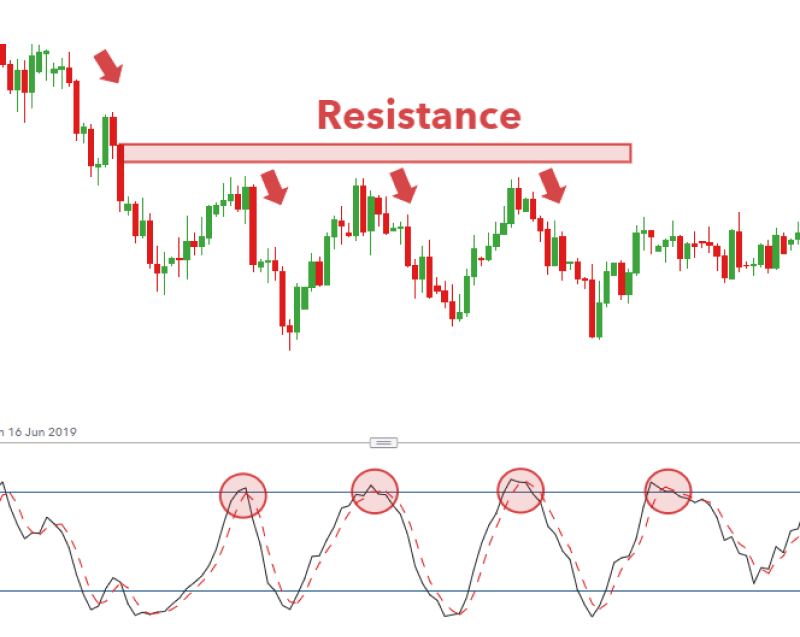
The stochastic oscillator measures the relationship between the closing price and the price range over a specific period.
In an M pattern, the Stochastic Oscillator reaches overbought territory near the first peak and then struggles to reach the same level during the second peak. This divergence between the price and the indicator can hint at weakening long pressure, supporting the M pattern's bearish outlook.
MACD (Moving Average Convergence Divergence)
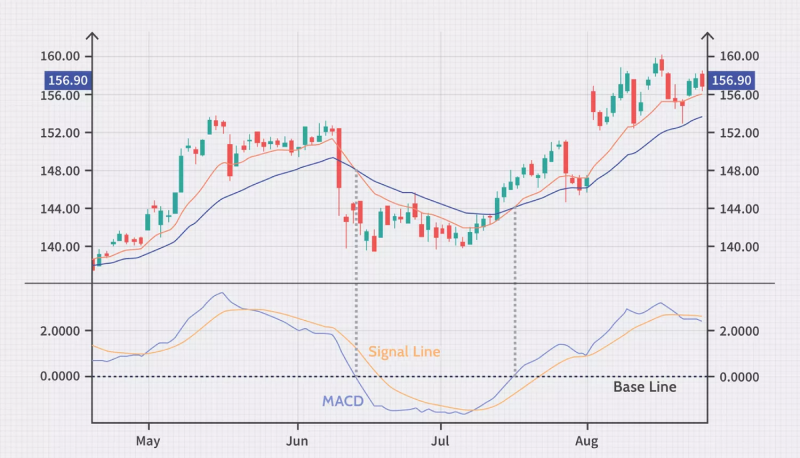
The MACD indicator uses a combination of moving averages to identify trend strength and potential reversals. In an M pattern, the MACD generates a bearish crossover (when the MACD line crosses below the signal line) when the price reaches the second peak.
This crossover confirms a potential downtrend aligned with the M pattern, offering a strong signal for traders to consider exiting long positions or entering short positions.
How to identify bearish signals with the M pattern?
- Look for the two peaks: Identify two consecutive price peaks of roughly similar height on the chosen forex chart. These peaks represent temporary highs in the currency pair's value
- Identify the trough: Between the two peaks, locate a lower trough representing a temporary decline in price. This trough should not be too deep and, ideally, should not breach a significant support level
- Draw the neckline: Draw a horizontal line connecting the swing lows (lowest points) before each price peak. This line represents the neckline, a critical support level. Ideally, the price should not consistently break below this line during the formation of the pattern
- Analyze the second peak: Observe the second price peak. In a strong M pattern, the second peak should ideally be slightly lower than the first peak. This suggests diminishing long pressure and a potential shift in market sentiment towards a downtrend
- Confirm the break below the neckline: The signal for a bearish reversal occurs when the price decisively breaks below the neckline. This breakout suggests a potential downtrend and is often followed by a decline in the currency pair's value
What are the external factors impacting the M pattern?
- Economic data releases: Upcoming or recently released economic data reports can influence market sentiment and potentially impact the formation or confirmation of the M pattern. For example, a stronger-than-expected economic report might trigger renewed entry pressure, causing the price to climb above the neckline and invalidating the M pattern
- Geopolitical events: Global political events or economic crises can create uncertainty and risk aversion in the market. This can lead to sharp price movements that might disrupt the formation of the M pattern or cause a false breakout below the neckline due to temporary risk-off selling
- Central bank policy decisions: Interest rate changes or monetary policy announcements by major central banks can significantly impact currency valuations. If such announcements occur during the formation of an M pattern, they could influence the price movement and potentially invalidate the pattern's bearish signal
- News and market sentiment: Unexpected news events or shifts in market sentiment can trigger volatile price swings that might disrupt the M pattern's formation. For example, positive industry news for a specific currency could lead to renewed long pressure, causing the price to rise above the neckline and negate the bearish implication
Trading Strategies Using M Patterns
Trendline break confirmation strategy
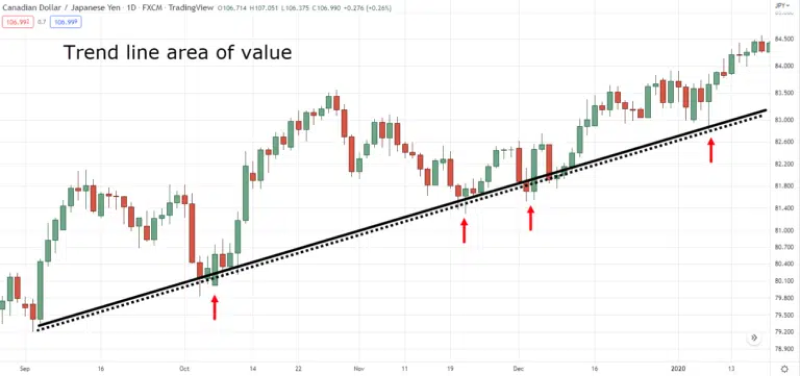
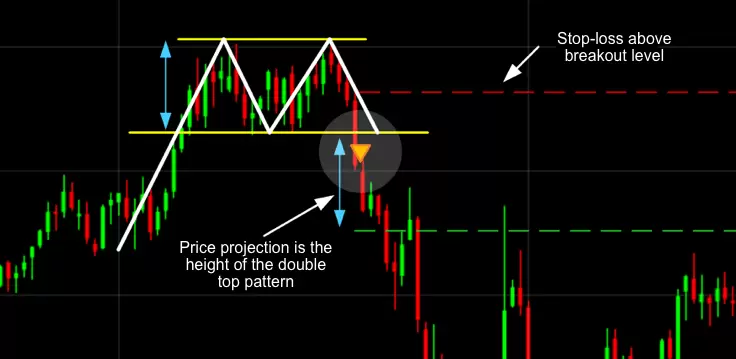
The strategy involves drawing a trendline that connects the low points from the start of the uptrend to the trough between the two peaks of the M pattern. Draw a trend line connecting the swing highs (peaks) during the uptrend leading to the M pattern formation. A confirmed break below this trend line, alongside a break below the M pattern's neckline, strengthens the bearish signal.
Consider entering short positions in anticipation of a further decline once the price breaks below both the neckline and the trend line. Set appropriate stop-loss orders above the neckline or the trend line (whichever is higher) to manage risk.
Bollinger band squeeze strategy
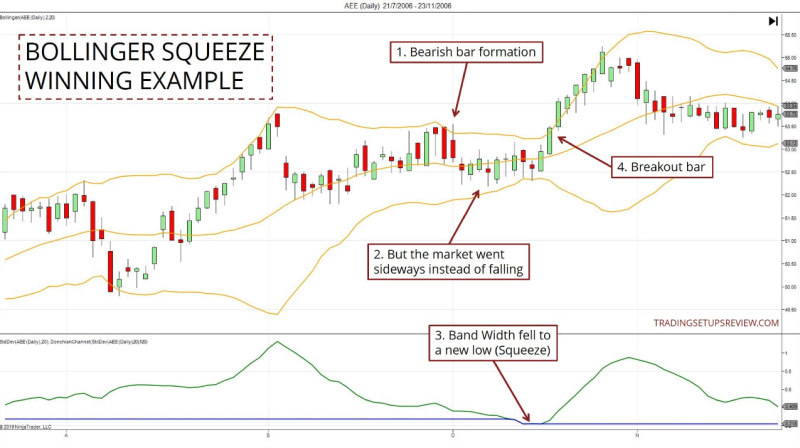
The strategy uses Bollinger Bands to identify periods of low volatility (squeeze) followed by a breakout. A Bollinger Band squeeze indicates a period of consolidation before a potential breakout. If the price breaks below the neckline after a squeeze, it strengthens the bearish signal, and traders can consider entering short positions.
Divergence with volume indicator strategy
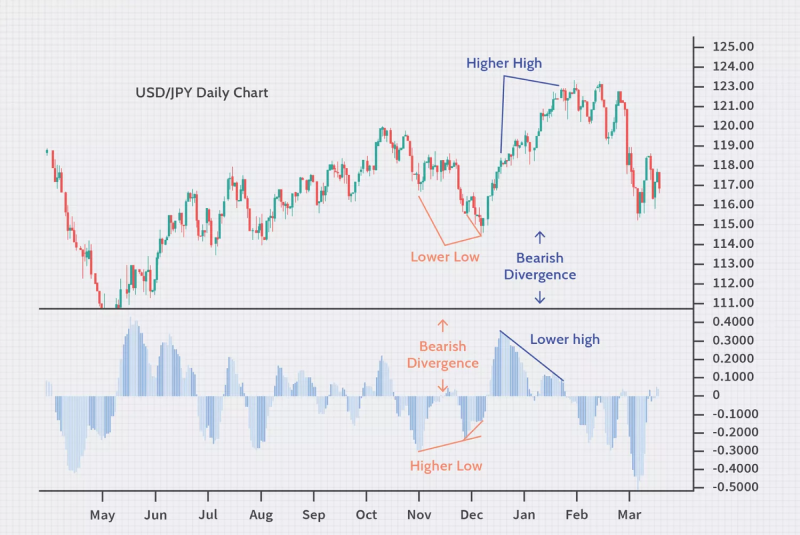
The strategy analyzes the divergence between price movements and volume indicators (such as On-Balance Volume or Volume Oscillator). A bearish divergence occurs when the price makes higher peaks, but the volume indicator makes lower peaks.
Combine the M pattern with a volume indicator like the Relative Volume Index (RVI) or the Moving Average Convergence Divergence (MACD) histogram. Look for a divergence between price and volume during the formation of the M pattern.
A divergence occurs when the price makes a new high (second peak), but the volume indicator fails to reach a new high. If a trader observes a divergence between price and volume during the M pattern formation, it strengthens the potential for a downtrend. A confirmed break below the neckline with high volume can be a strong signal to enter short positions.
Elliott wave theory strategy
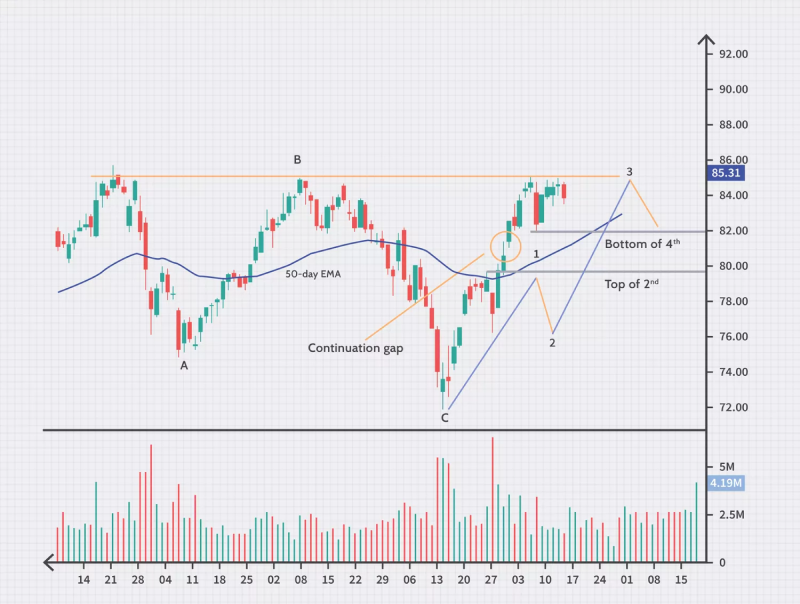
The strategy uses Elliott Wave Theory to analyze price movements within the context of wave patterns. It suggests rice movements occur in five-wave patterns. The M pattern can sometimes coincide with completing the corrective wave (wave B) within a larger bearish trend (wave C).
If the M pattern aligns with the completion of wave B in Elliott Wave Theory, and there's a confirmed break below the neckline, it strengthens the bearish case. Traders can consider entering short positions to capitalize on the potential downtrend of wave C.
Common risks and how to avoid them
- Premature entry: Entering a short position too early before the pattern is fully formed or confirmed can result in losses if the pattern fails to complete. Ensure the pattern is fully formed and the price breaks below the support level (trough) before entering a trade
- Trend continuation instead of reversal: The M pattern may appear during a strong uptrend, where the trend continues upward despite the pattern, leading to losses. Analyze the overall trend using trend indicators like moving averages or ADX. Avoid trading against a strong trend
- Market noise: Short-term market noise and high volatility can create deceptive patterns that mimic the M pattern but do not result in a genuine reversal. Use higher time frames to filter out market noise and reduce the impact of short-term volatility
- False breakouts: The price might temporarily break below the trough (support) level and then reverse, resulting in a false breakout. Wait for a retest of the broken support level to see if it holds as new resistance before entering a trade
Trading the M pattern for reversal signals
The M pattern, a bearish reversal indicator, equips forex traders with insights into potential downtrends. Combining the M pattern with other technical indicators like trend lines, Bollinger Bands, volume indicators, or Elliott Wave Theory can strengthen the trading signals. Risks like unexpected economic news or highly volatile markets can create erratic price movements, making it difficult to identify and trade the M pattern effectively.
Disclaimer: All material published on our website is intended for informational purposes only and should not be considered personal advice or recommendation. As margin FX/CFDs are highly leveraged products, your gains and losses are magnified, and you could lose substantially more than your initial deposit. Investing in margin FX/CFDs does not give you any entitlements or rights to the underlying assets (e.g. the right to receive dividend payments). CFDs carry a high risk of investment loss.