


The inverted hammer candlestick is a powerful chart pattern that signals potential bullish reversals in the market. Traders can improve their decision-making by recognizing this pattern and combining it with other technical indicators. This guide explores the formation, significance, and practical use of the inverted hammer in trading.
What is the inverted hammer candlestick?
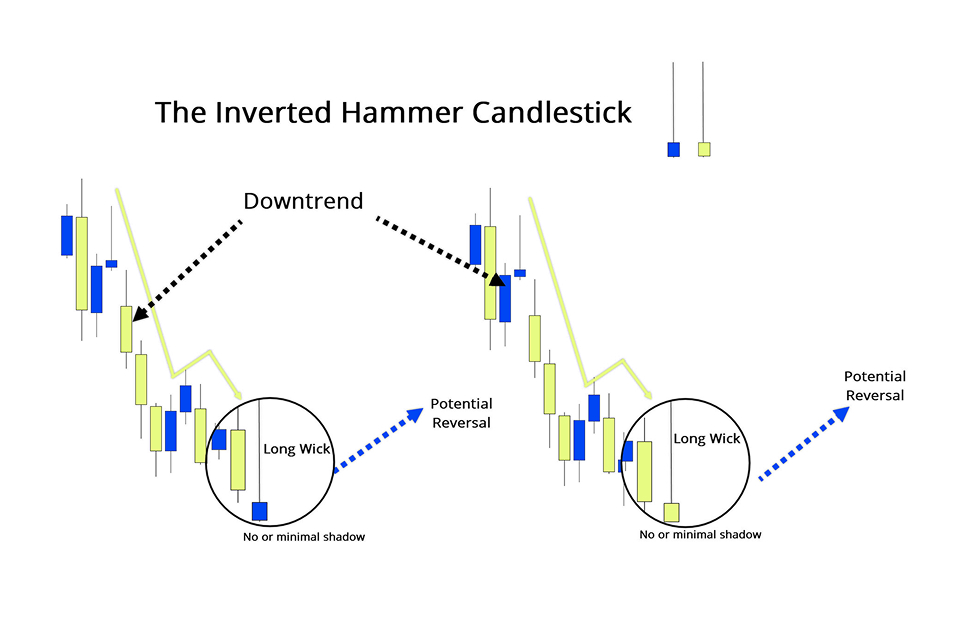
The inverted hammer candlestick is a single-candle charting pattern that signals a potential bullish reversal in a downtrend. It resembles an inverted hammer, with a small real body at the lower end and a long upper shadow. This formation indicates that while bears initially dominate, bulls are gaining momentum, hinting at a possible trend reversal.
The inverted hammer is particularly significant when it appears after a sustained downtrend or near key support levels. It provides traders with a visual cue of a shift in market sentiment.
How does the inverted hammer candlestick form?
The inverted hammer candlestick forms during a downtrend. It reflects a battle between bulls and bears. The pattern begins with bearish pressure, causing prices to drop. However, bulls step in right after pushing the price higher during the trading session. By the close, the price settles near its opening level. This forms a small real body at the lower end and a long upper shadow. This pattern signals potential market exhaustion for bears. It also indicates that bulls may be gaining strength.
How to use the inverted hammer candlestick in trading
Bullish reversal signal
The inverted hammer is a classic bullish reversal pattern. When it appears in a downtrend, it indicates that exit pressure is diminishing and bulls are starting to dominate.
Entry point after confirmation
Traders should wait for confirmation from the next candle. A bullish candle closing above the inverted hammer's high confirms the reversal, providing an ideal entry point.
Spotting potential trend reversal
Look for the inverted hammer near major support levels. These areas often act as a springboard for price reversals, making the pattern more reliable.
Identifying market exhaustion
The inverted hammer highlights market exhaustion, where bears struggle to push prices lower despite initial control. This signals a weakening downtrend.
Breakout confirmation
When an inverted hammer forms close to a resistance level, followed by a breakout, it confirms upward momentum, strengthening one’s bullish outlook.
Support level confirmation
Appearing near support zones, the inverted hammer validates these levels as strong bullish interest areas, increasing confidence in a potential reversal.
Trend continuation
Although rare, an inverted hammer in an existing uptrend can signal sustained bullish momentum, reinforcing an ongoing trend.
Inverted hammer vs. shooting star candlestick
Formation
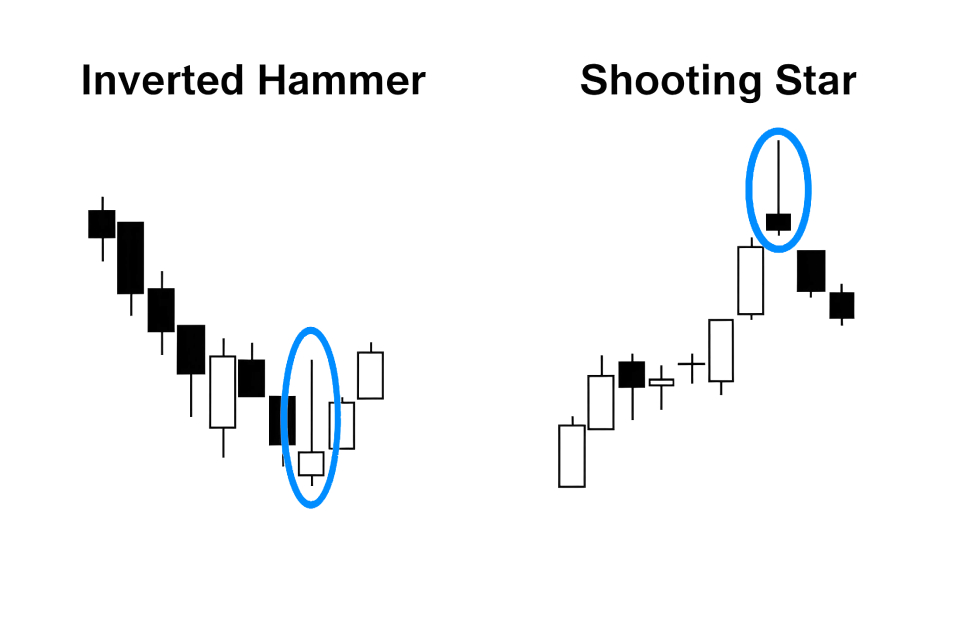
The inverted hammer forms during a downtrend, while the shooting star forms during an uptrend.
Trend context
When it appears after a downtrend, the inverted hammer signals a potential bullish reversal, suggesting that bulls are starting to regain control. In contrast, the shooting star indicates a potential bearish reversal when it emerges after an uptrend, indicating that bears are gaining strength and bulls are losing momentum.
Market sentiment
The inverted hammer signifies that bears dominated initially but were challenged by bulls. This hints at a possible upward price movement. Conversely, the shooting star reveals that bulls controlled the early session, but bears overpowered them by the close. This potentially leads to a downward shift in prices.
Confirmation needed
For the inverted hammer, confirmation comes in the form of a subsequent bullish candlestick or higher closing price. This indicates follow-through long pressure. The shooting star requires a bearish candlestick or lower closing price to confirm that short pressure is intensifying.
Trading implications
The inverted hammer offers traders an opportunity to enter a long position in anticipation of a trend reversal to the upside. On the other hand, the shooting star prompts traders to consider short positions or exit long trades in preparation for a potential downtrend.
Support and resistance interaction
Inverted hammers often appear near support levels, reinforcing their bullish implications as they signal a rebound. Shooting stars are frequently observed near resistance levels, strengthening their bearish signal by indicating a price rejection.
*This is an example only to enhance a consumer's understanding of the strategy being described above and is not to be taken as Blueberry providing personal advice.
Stepwise guide to trade with the inverted hammer candlestick
-
Identify the inverted hammer pattern: Scan charts to find the inverted hammer's distinct shape—a small body with a long upper wick—in a downtrend.
-
Wait for confirmation: The inverted hammer alone isn't sufficient. Wait for the next candle to close higher, confirming a bullish reversal.
-
Confirm the trend: Examine the broader trend using tools like moving averages or trendlines. The pattern is most reliable in a clear downtrend.
-
Check for supporting indicators: Combine the pattern with indicators like RSI (relative strength index) or MACD (moving average convergence divergence) to validate its signal.
-
Enter the trade: Place a long order above the high of the inverted hammer once confirmation is established.
-
Place stop-loss orders: To manage risk, set a stop-loss below the pattern's low. This protects against false breakouts or unexpected market reversals.
-
Execute the order: Complete the trade setup and monitor market conditions for any changes that might impact the trading strategy.
Key considerations when trading the inverted hammer
-
Volume analysis: Increased volume during the formation of an inverted hammer strengthens its reliability. It suggests strong bull interest, making a reversal more likely
-
Market context: The inverted hammer is most effective in a well-defined downtrend. Avoid using it in choppy or sideways markets
-
Risk management: Always use stop-loss orders and limit the exposure to manage risks effectively
-
Multiple confirmations: Never rely solely on the inverted hammer. Combine it with other technical tools and indicators for more accurate predictions
Examples of the inverted hammer
Example 1: Spotting a reversal
A currency pair is in a downtrend and forms an inverted hammer near a support level. The next day, the price closes higher, confirming the reversal. Traders enter a long position, gaining momentum from the upward.
Example 2: Breakout scenario
An inverted hammer forms near a resistance level. The price breaks above the resistance in the next session, confirming a breakout. Traders enter a position and ride the upward surge.
Navigating the forex market analysis with an inverted hammer
The inverted hammer helps traders spot potential bullish reversals, especially near support levels. It improves accuracy when combined with other indicators. However, relying on it alone can lead to false signals, especially in volatile markets. Use it with trend analysis to make informed forex trading decisions accurately.
Disclaimer: All material published on our website is intended for informational purposes only and should not be considered personal advice or recommendation. As margin FX/CFDs are highly leveraged products, your gains and losses are magnified, and you could lose substantially more than your initial deposit. Investing in margin FX/CFDs does not give you any entitlements or rights to the underlying assets (e.g. the right to receive dividend payments). CFDs carry a high risk of investment loss.