


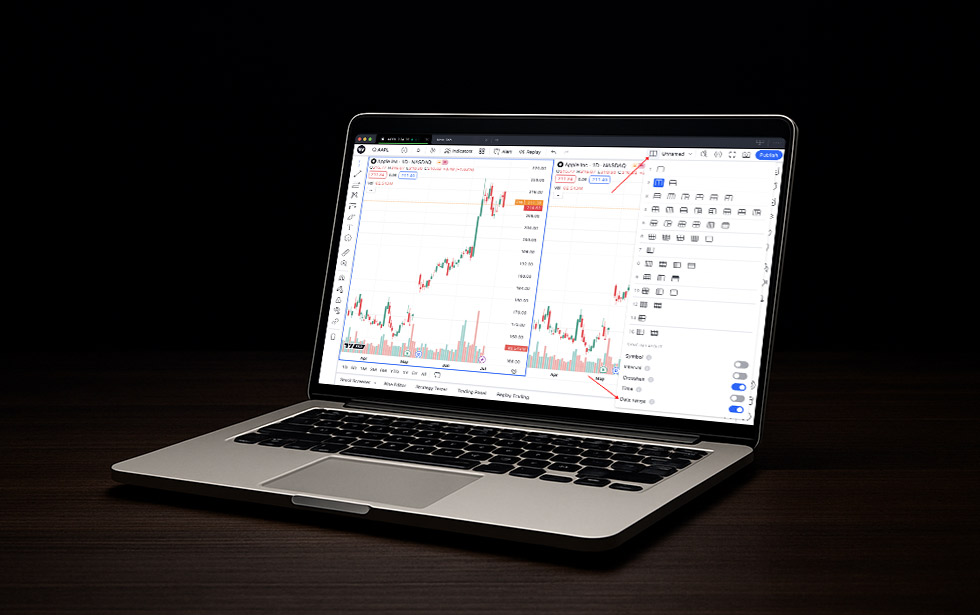
TradingView's multi-timeframe analysis allows traders to view multiple timeframes simultaneously, offering a broader market perspective. By analyzing short, medium, and long-term trends, traders can confirm signals, improve accuracy, and make better-informed decisions, improving their overall strategy.
In this blog, we will explore TradingView's multi-timeframe analysis tools.
*This is an example only to enhance a consumer's understanding of the strategy being described above and is not to be taken as Blueberry providing personal advice.
What are TradingView's multi-timeframe analysis tools?
Price action toolkit
The multi-timeframe analysis tool allows the plotting of Fair Value Gaps, Order Blocks, and Liquidity Grabs across three timeframes. It helps traders identify crucial market levels, helping in precise decision-making. The tool also improves market structure analysis, enhancing accuracy in trade execution and risk management strategies.
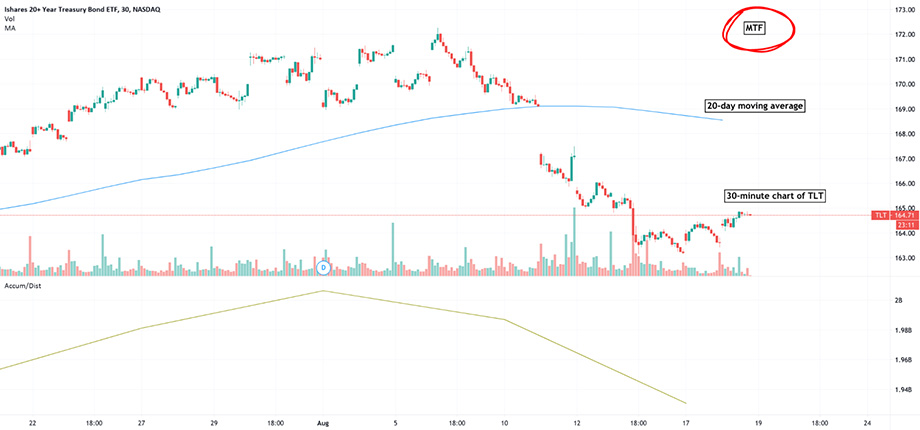
MFTA (Multi-Timeframe Analysis)
MFTA overlays moving averages from higher timeframes onto a single chart. It gives traders a broader market perspective. It also helps in understanding the overall trend direction without leaving the current chart. The MFTA approach enhances trading efficiency, reducing the need for frequent chart adjustments.
AlgoBot TrendPanel
AlgoBot TrendPanel displays trend data from ten different timeframes using customizable indicators. These include EMA, RSI, MACD, and ADX for detailed trend analysis. The tool helps traders spot trend shifts quickly, ensuring a more data-driven and efficient decision-making process.
Multi-timeframe market formation
The multi-timeframe market formation indicator analyzes up to six timeframes. It detects bullish, bearish, or sideways formations. It also identifies key support and resistance zones, assisting in better trend confirmation. By synchronizing multiple timeframes, traders gain a clearer understanding of market direction.
Multi-timeframe trend screener
The multi-timeframe trend screener tracks trends of multiple assets using moving averages. It monitors up to four assets across five different timeframes. The tool highlights bullish or bearish conditions, which helps traders assess market sentiment.
Features of TradingView's multi-timeframe analysis tools
- Multiple chart layouts allow traders to view several charts simultaneously for better comparison
- Customizable timeframes enable users to set and switch between preferred time periods easily
- Synchronized crosshairs help track price movements across multiple charts in real-time
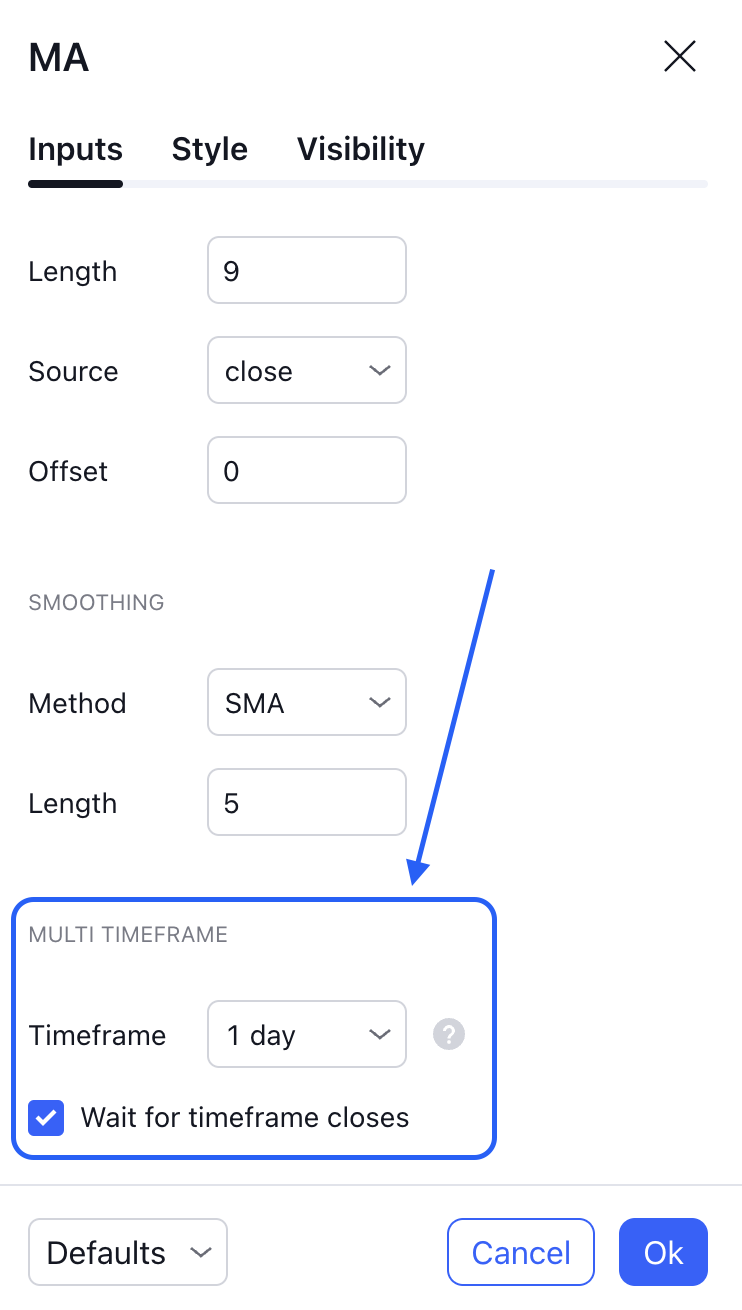
- Overlay indicators across timeframes allow applying technical indicators from different timeframes onto a single chart
- Zoom and scale synchronization ensures consistent zoom levels and scaling across multiple charts
- Timeframe comparison helps traders analyze price action across different timeframes for deeper insights
How to set up multi-timeframe analysis on TradingView
Log into TradingView
Users can visit the TradingView website and sign in to their account. Those without an account can create one at no cost or opt for a premium subscription to access additional features.
Open a chart
After logging in, traders should click on Chart from the main menu to open a new chart window. Depending on the user's trading preferences, the chart can be set to display any asset, such as stocks, forex, or cryptocurrencies.
Select the primary timeframe
A base timeframe should be chosen based on the trader's strategy. Common choices include –
- 5-minute or 15-minute charts for day traders
- 1-hour or 4-hour charts for swing traders
- Daily or weekly charts for long-term investors
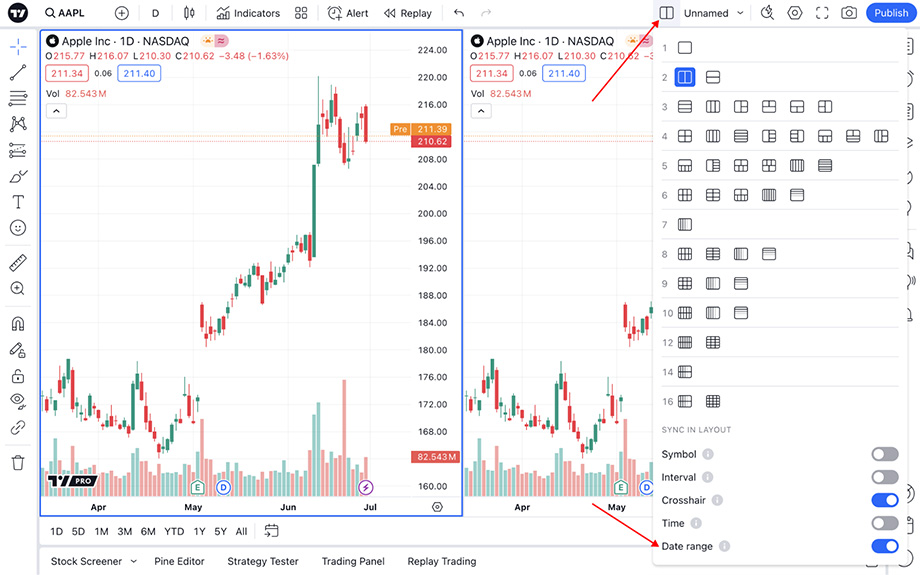
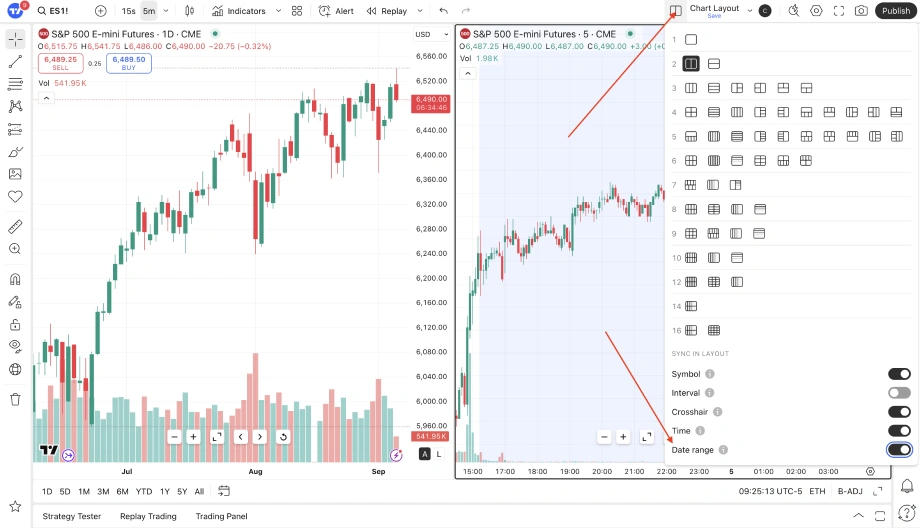
Access the 'Select Layout' menu
The charting interface has a Select Layout button at the top right corner. Clicking it reveals various layout options for multi-chart setups.
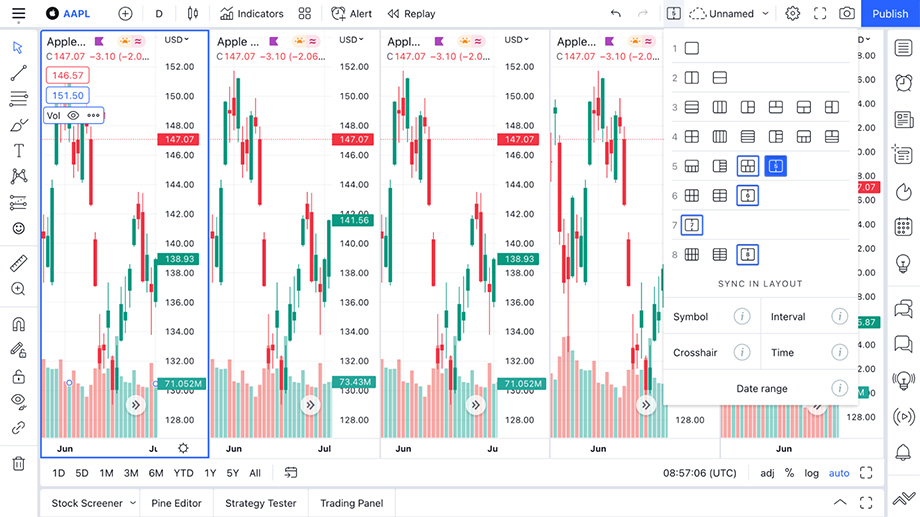
Choose a multi-chart layout
Traders can select from several layout configurations based on their needs, such as –
- 2 charts – Suitable for comparing short-term and long-term timeframes
- 3 charts – Useful for tracking intraday, swing, and macro trends together
- 4 charts or more – Ideal for advanced traders monitoring multiple timeframes simultaneously
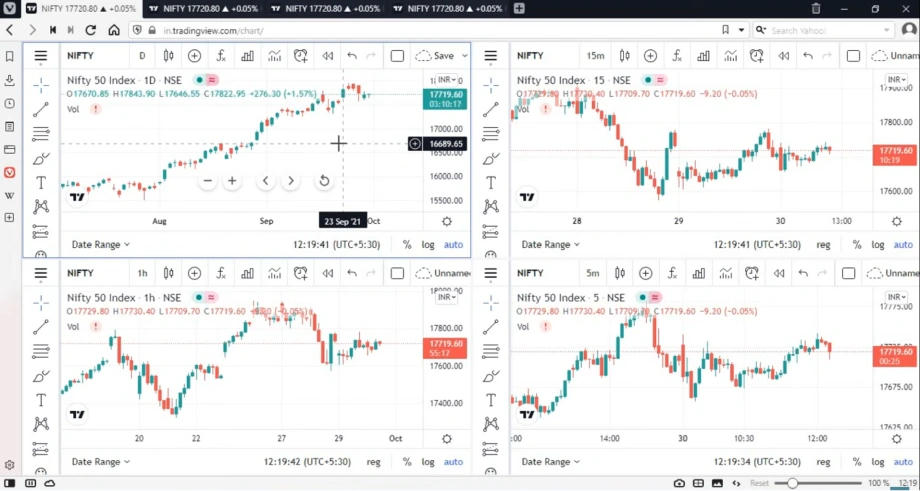
Set different timeframes for each chart
Each chart within the selected layout should be assigned a different timeframe to provide a broader market perspective. Example setups include –
- Scalping: 1-minute, 5-minute, and 15-minute charts
- Swing trading: 1-hour, 4-hour, and daily charts
- Long-term investing: Daily, weekly, and monthly charts
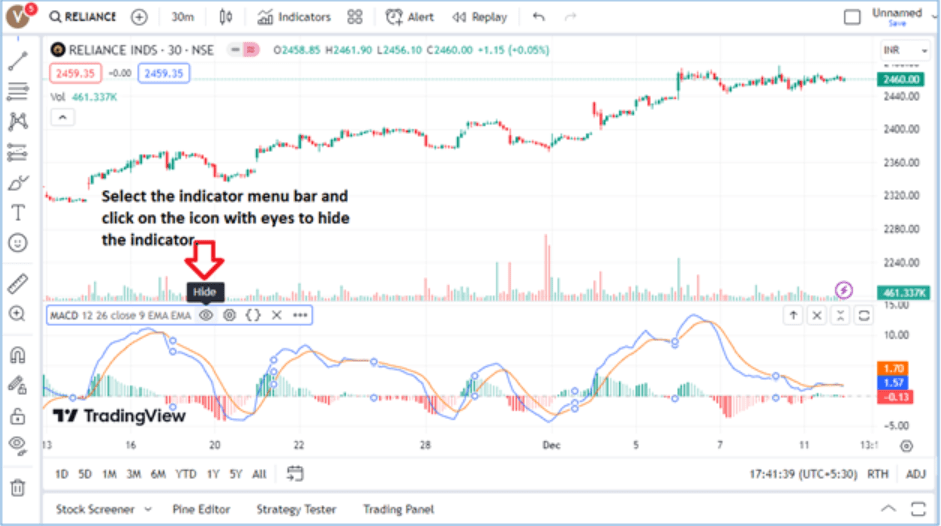
Apply indicators and drawings
Technical indicators and drawing tools should be added to enhance market analysis. Common tools include trend indicators, momentum indicators, support and resistance tools, etc. If needed, drawings can be synchronized across all charts to maintain consistency in analysis.
Synchronize the charts (optional)
Traders can enable chart synchronization by selecting the Sync button, allowing them to link –
- Timeframe synchronization (changes reflect across all charts)
- Crosshair synchronization (track price levels on multiple charts simultaneously)
- Drawing synchronization (apply trendlines and indicators across all timeframes)
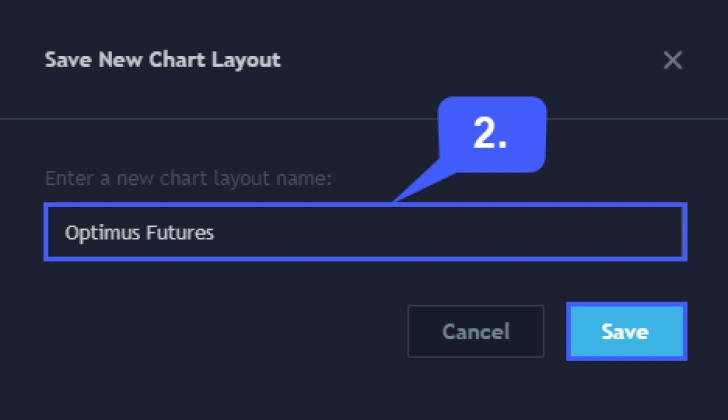
Save the layout for future use
Once the charts are configured, users should click Save to store the setup. This ensures that the multi-timeframe layout remains accessible for future sessions without requiring reconfiguration.
Common mistakes to avoid in multi-timeframe analysis
Using too many timeframes
Traders often use too many timeframes, which can create confusion. Too many timeframes can overwhelm traders while they conduct the analysis. Stick to two or three timeframes to focus on key trends. Limit complexity for better decision-making and clarity in market understanding.
Ignoring trend alignment
Traders sometimes neglect trend alignment, which can create confusion by failing to match trends across timeframes. Ensure trends are aligned across short, medium, and long-term periods. Misalignment can result in conflicting signals and poor trade decisions, affecting gains.
Inconsistent timeframe intervals
Traders may use inconsistent timeframes, which disrupt analysis and comparison. Hence, traders should use timeframes that align logically. For example, one-hour and four-hour charts work well together. Such consistent intervals improve accuracy and help identify market trends more effectively.
Failure to adjust timeframes
Traders often forget to adjust timeframes. Adjusting timeframes ensures relevant insights are captured in changing market conditions. Be flexible and change timeframes as necessary. Adapting to current market conditions helps maintain a clear view of trends.
Maximize multi-timeframe analysis for smarter trading
TradingView's multi-timeframe analysis tools offer a comprehensive market view, helping traders confirm trends and improve decision-making. They allow comparisons between short and long-term movements. However, using too many timeframes can create confusion, and inconsistent signals may arise.
Disclaimer: All material published on our website is intended for informational purposes only and should not be considered personal advice or recommendation. As margin FX/CFDs are highly leveraged products, your gains and losses are magnified, and you could lose substantially more than your initial deposit. Investing in margin FX/CFDs does not give you any entitlements or rights to the underlying assets (e.g. the right to receive dividend payments). CFDs carry a high risk of investment loss.