


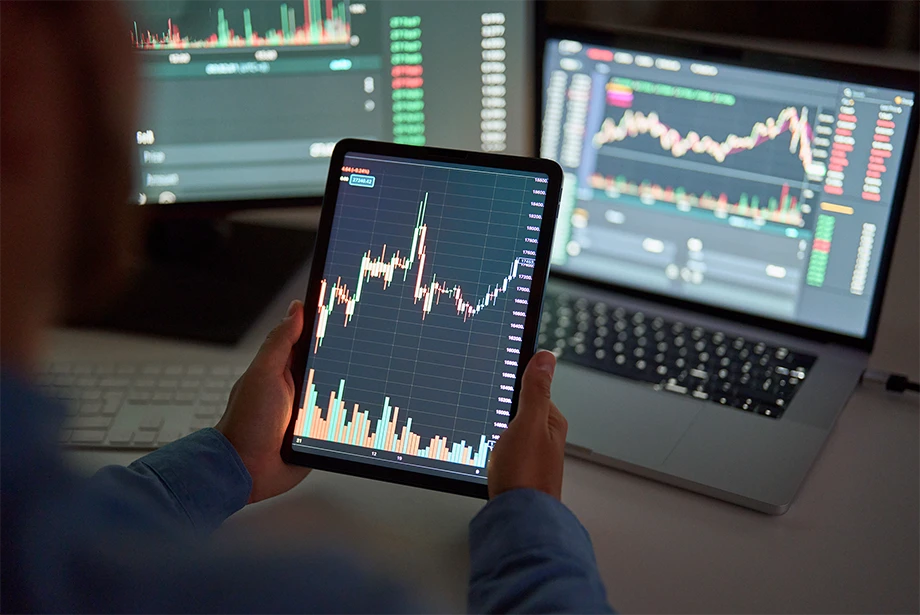
Effective technical analysis starts with the right tools. TradingView’s drawing tools help traders visualize trends, mark key price levels, and identify patterns with precision.
Whether highlighting support and resistance, annotating charts, or refining strategies, annotating charts makes market analysis clearer and more actionable.
In this guide, we’ll explore how to use TradingView’s drawing tools to enhance trading decisions.
This is an example only to enhance a consumer's understanding of the strategy being described above and is not to be taken as Blueberry Markets providing personal advice.
What are drawing tools in TradingView?
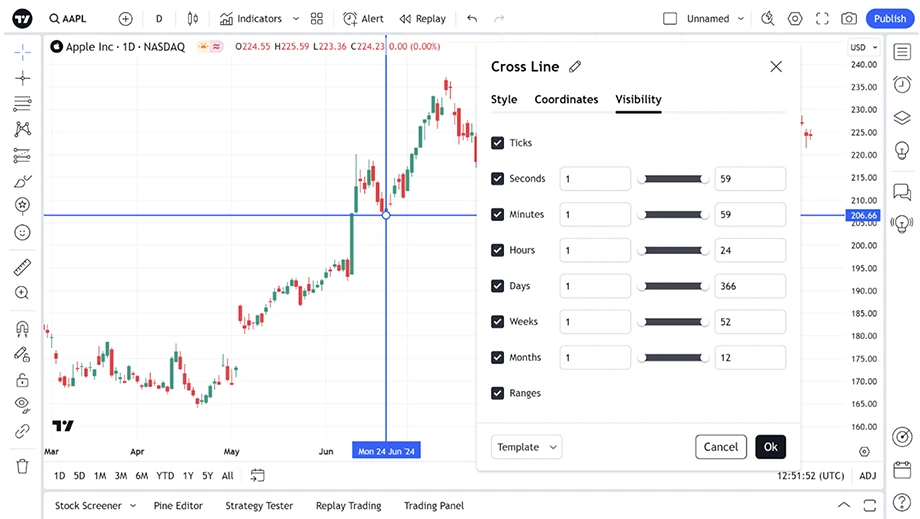
TradingView offers various drawing tools for chart analysis, including trend lines, horizontal lines, and ray tools. They help visualize market trends, patterns, and key price levels. Traders can mark charts, highlight key areas, and enhance technical analysis by identifying support and resistance zones, predicting trends, and measuring price movements.
Types of drawing tools in TradingView
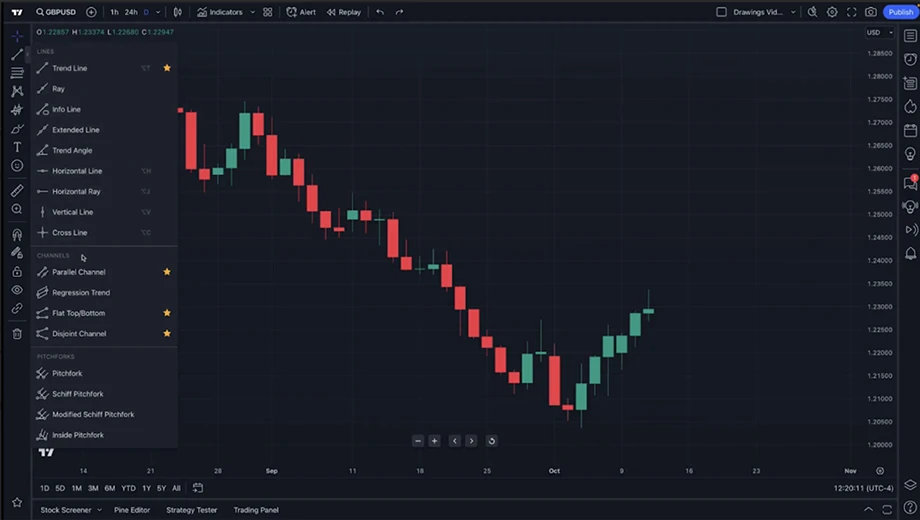
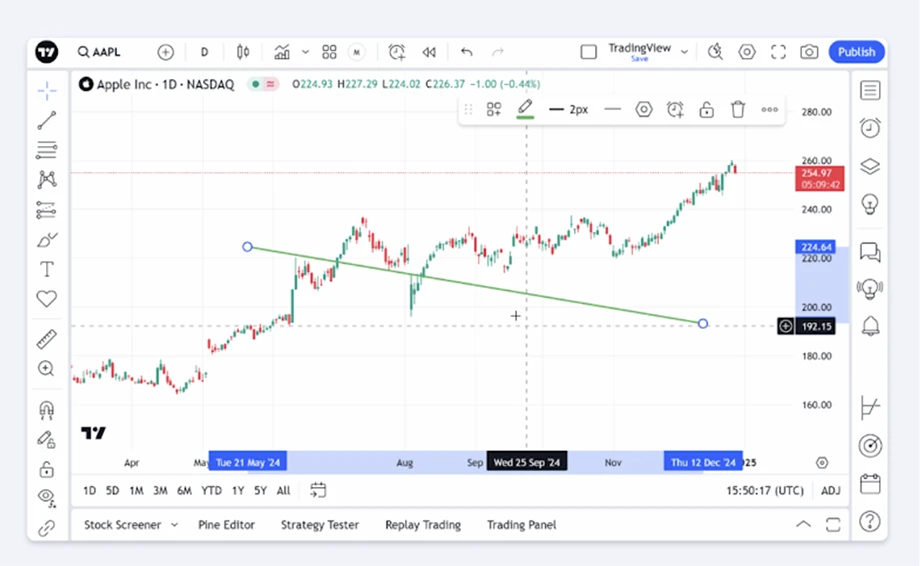
Trend line tools
Trend lines help identify market direction by tracking price movement over time, which leads to accurate trend analysis. Trend lines can be diagonal or horizontal, and traders can use them for breakout predictions and potential reversals.
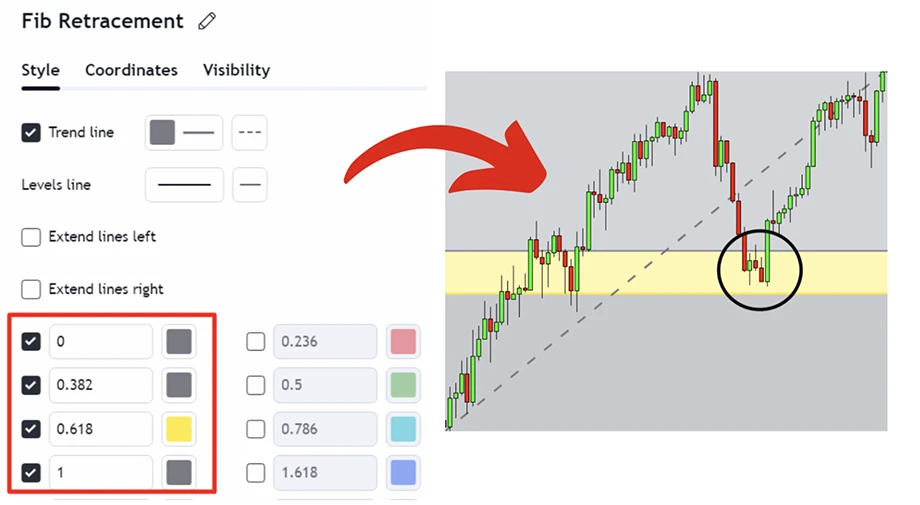
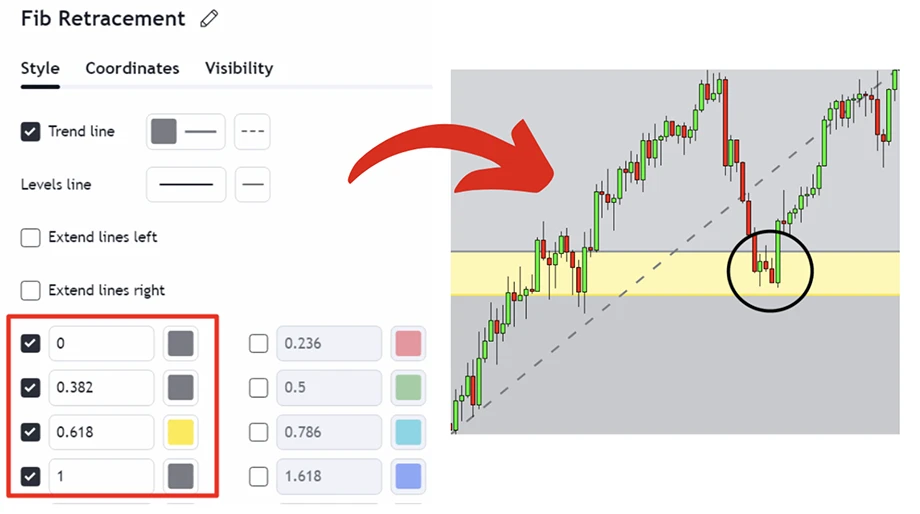
Gann and Fibonacci tools
Gann tools predict price movements using angles and help forecast price trends and reversals. Fibonacci retracement identifies potential support and resistance. Traders can also use them for entry and exit points. Both tools rely on mathematical ratios and are commonly used in swing trading.
Geometric shapes
Geometric shapes highlight areas of interest or uncertainty. It includes rectangles, ellipses, and triangles, which mark key price areas. Traders use them for visual analysis and to help identify consolidation zones or patterns with improved chart visibility and organization. They also assist in defining price action zones.
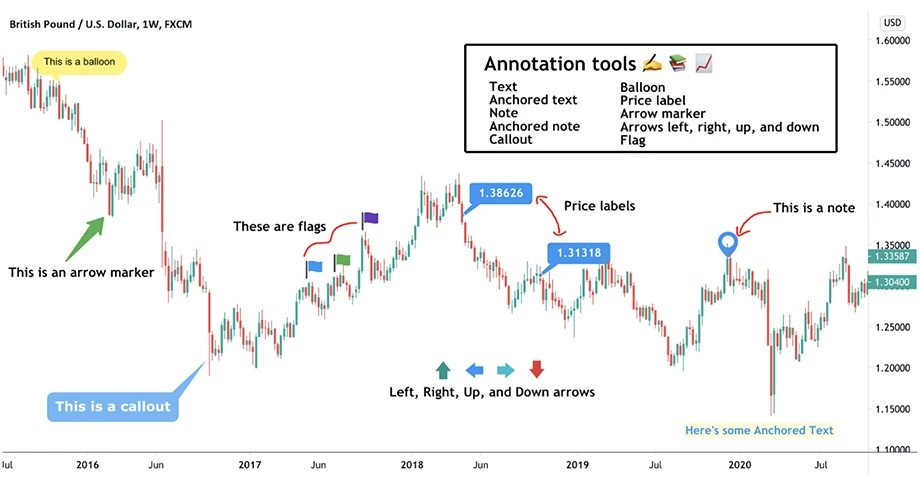
Annotation tools
Annotation tools allow adding text to charts. With these tools, traders can label key price levels and include comments/notes to help explain chart analysis clearly. These tools add context to trading decisions as they allow easy communication of strategies and improve chart readability for analysis.
Patterns
Pattern tools identify chart formations like triangles. They assist in recognizing price action patterns such as head and shoulders, flags, etc. Patterns signal potential price movements or breakouts, which traders use to predict trends and anticipate upcoming market behavior.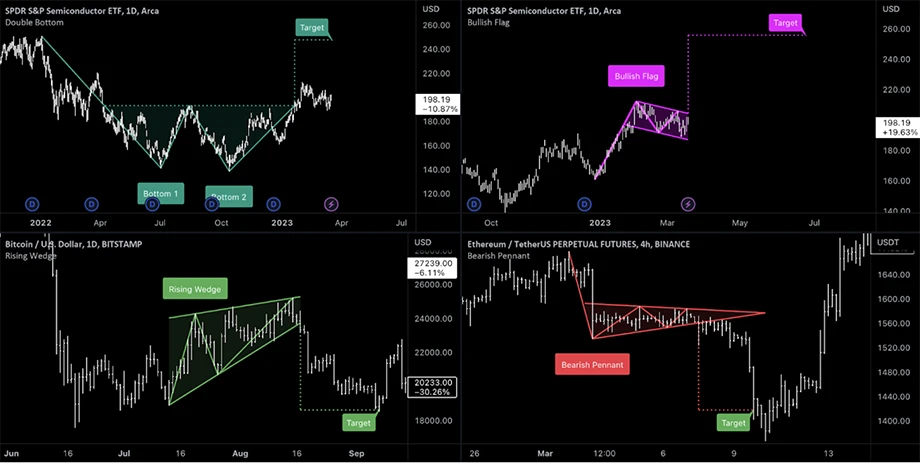
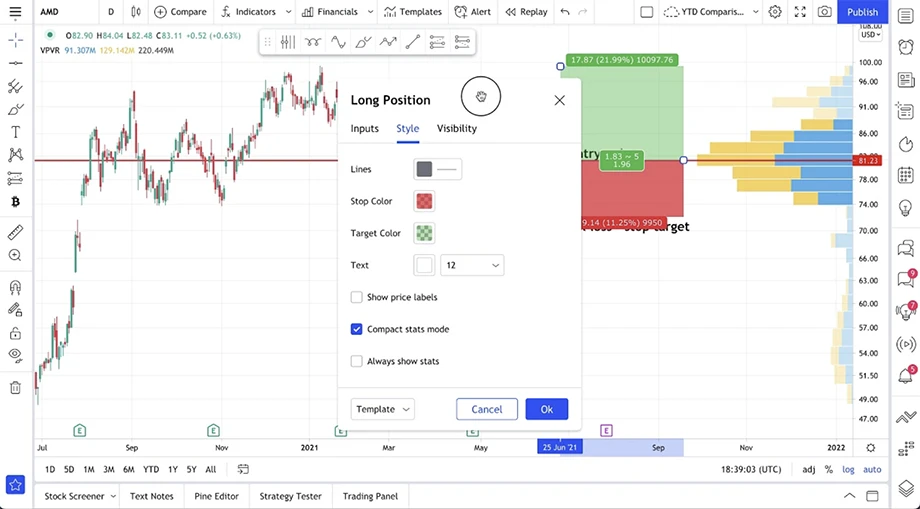
Predictions and measurement tools
Prediction tools forecast potential price levels, such as future price projection and trend continuation/reversal prediction.
Measurement tools calculate price distances and targets. This enables traders to estimate future movements and set gain targets/stop-loss levels. Measurement tools also improve trade accuracy and planning.
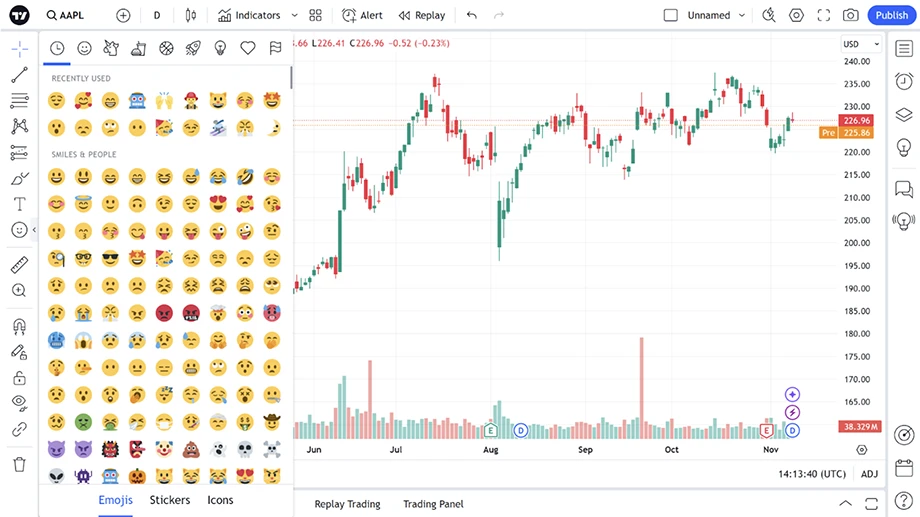
Icons
Icons allow adding images or symbols to charts to represent market events or signals. Traders also use icons for visual reminders, as icons can symbolize news or trade alerts. Icons simplify chart interpretation and analysis, making charts more informative and visually appealing.
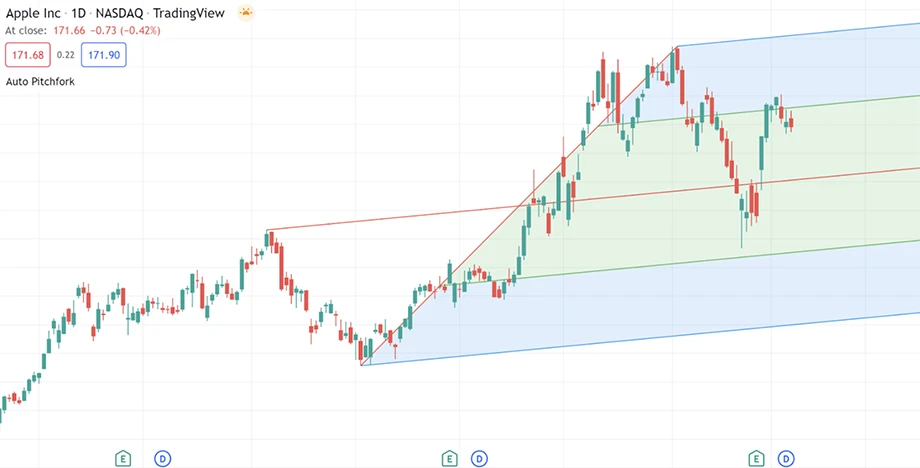
Pitchfork
Pitchfork tools are used to predict price trends. They also help identify potential support and resistance areas. This tool is based on three key points: a trend's start, middle, and end. Traders use pitchforks to spot possible reversals as well.
Stepwise guide to using TradingView's drawing tools
1. Open TradingView and log in
Visit the TradingView website and click Log In.Enter the credentials and click on Sign In to access the account.
2. Locate the drawing tools panel on the left
Look for the drawing tools panel on the left side of the screen. This panel contains all the drawing tools available for use.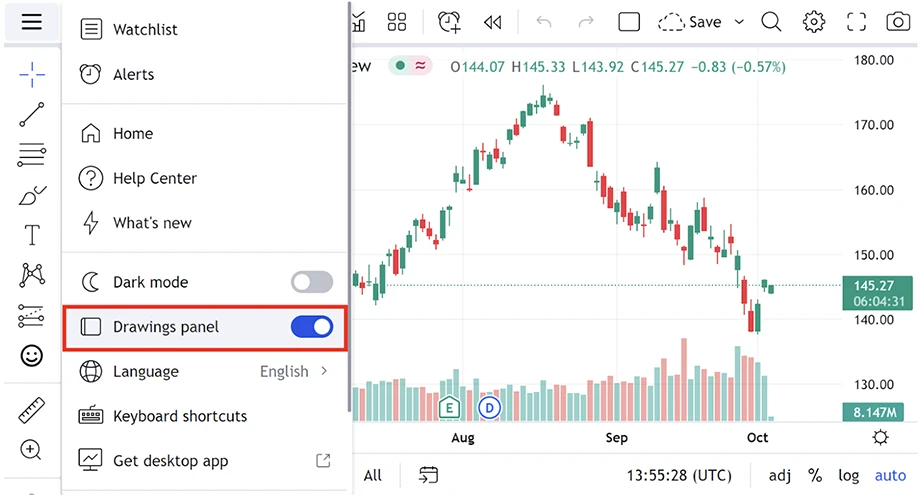
Click on the desired drawing tool category
In the left panel, find and click on the category of tools one wishes to use. This will reveal all the tools within that category.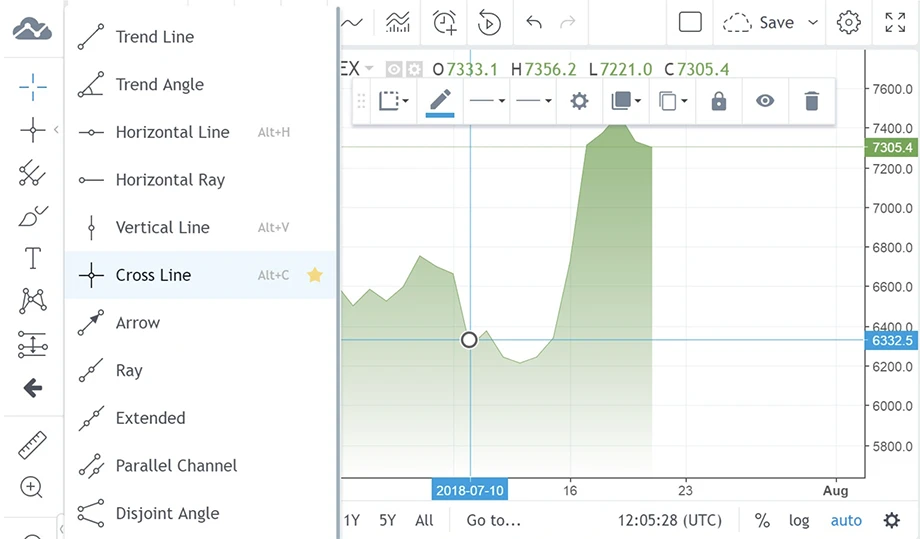
4. Select a specific tool from the dropdown menu
After selecting a category, a drop-down/sidebar menu will appear. From the options displayed, choose the specific tool one wants to use.
5. Click on the chart to set the starting point
Place the cursor on the chart where one wants to begin the drawing. Click to set the starting point of the line or shape.
6. Drag to the desired endpoint and release
Hold the mouse button and drag the cursor to the endpoint. Once the trader is in the right position, release the mouse button to complete the drawing.
7. Click on the drawing to adjust its position
Click on the drawing created to select it. Once selected, the trader can move the drawing to a different location on the chart.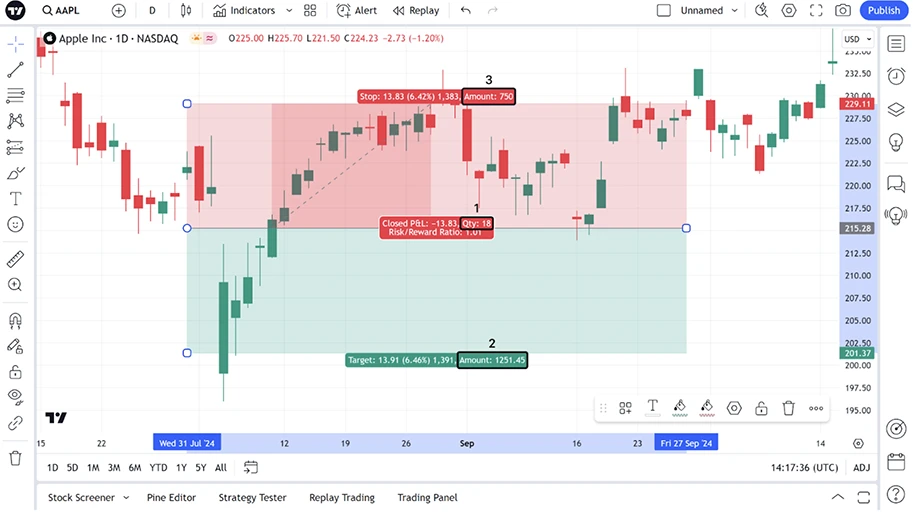
8. Resize or move using the handles
Small handles will appear around the selected drawing. Click and drag them to resize or reposition the drawing as needed.
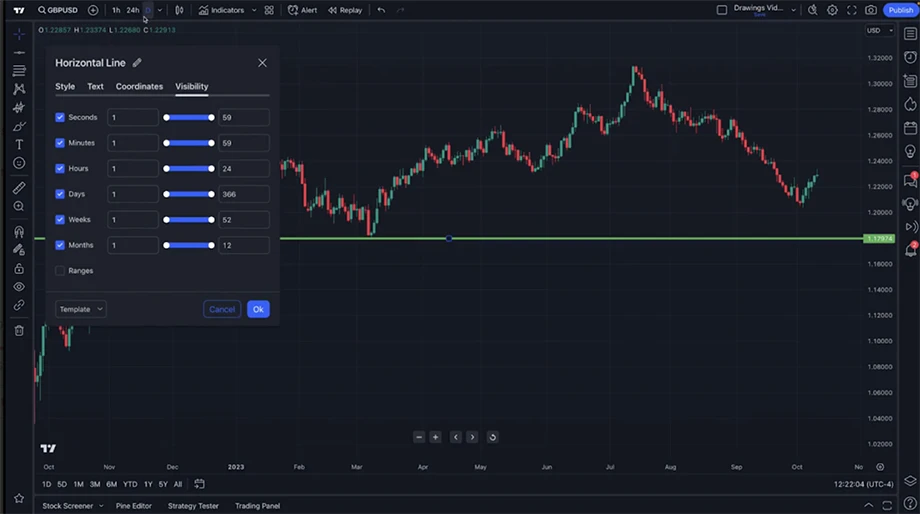
9. Right-click the drawing and select 'Settings' for customization
Right-click on the drawing and choose Settings from the context menu. This will open a window where traders can customize the drawing's appearance.
10. Save the chart layout with drawings
Once satisfied with the layout, click Save or Save As. Enter a name for the layout and click Save to keep all the changes, including drawings.
Annotate charts with TradingView's drawing tools
When traders annotate trading charts, they use strategies as a valuable reference for future analysis. However, it's important to exercise caution. Over-relying on these tools without a comprehensive understanding of market dynamics can lead to misinterpretations. Drawings may also become cluttered or misleading if not managed well.
Disclaimer: All material published on our website is intended for informational purposes only and should not be considered personal advice or recommendation. As margin FX/CFDs are highly leveraged products, your gains and losses are magnified, and you could lose substantially more than your initial deposit. Investing in margin FX/CFDs does not give you any entitlements or rights to the underlying assets (e.g. the right to receive dividend payments). CFDs carry a high risk of investment loss.