


Pivot points are technical indicators that denote reference points and identify support and resistance levels within the trading range. These levels provide traders tangible targets for entry and exit in the forex market.
Let’s look at how to use pivot points for range trading.
What are pivot points?
Pivot points are a technical indicator used in trading to identify potential support and resistance levels based on previous price action. They are calculated using the high, low, and close prices from the previous trading period, such as the previous day, week, or month.
There are four other types of pivot points other than the standard pivot points discussed above –
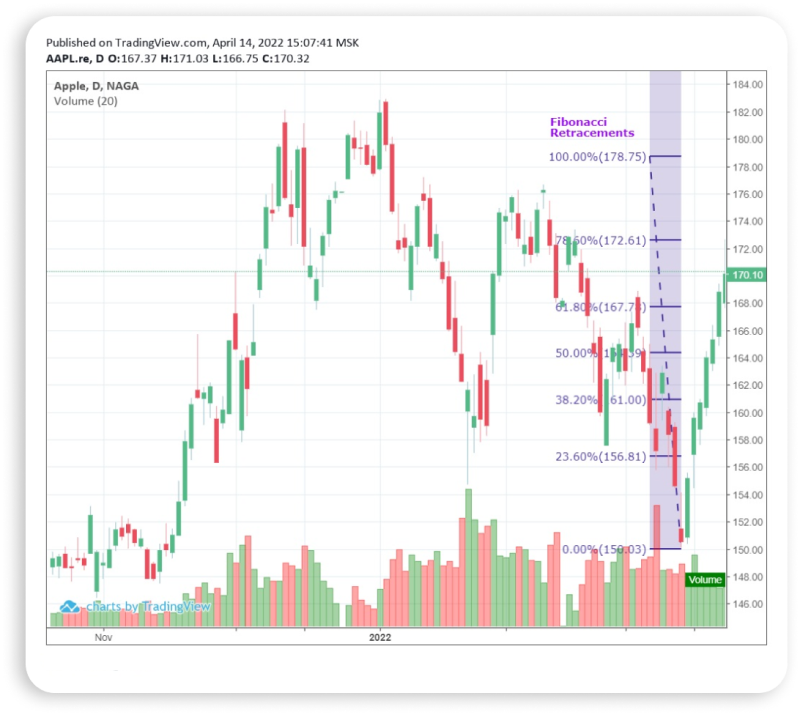
Fibonacci pivot points
Fibonacci pivot points are calculated using Fibonacci retracement levels instead of the traditional high, low, and close prices. These levels are derived from Fibonacci ratios and provide additional insight into potential support and resistance levels.
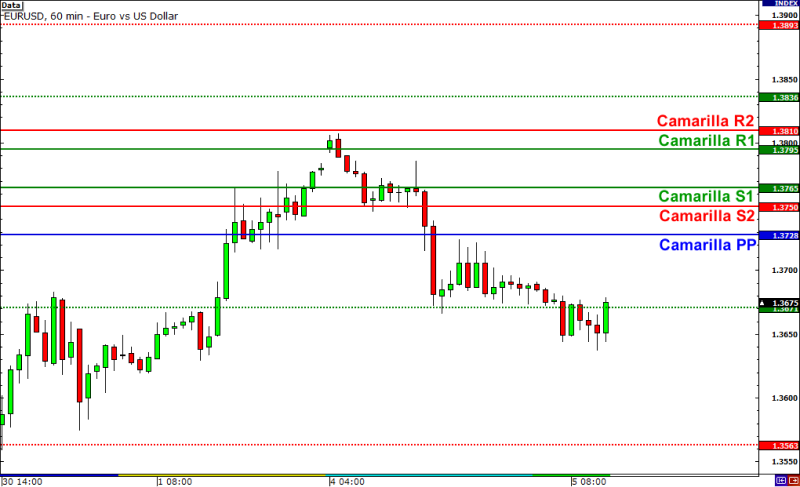
Camarilla pivot points
Camarilla pivot points emphasize recent price action and aim to identify key intraday support and resistance levels. Camarilla pivot points consist of a central pivot point (CP) and additional support and resistance levels labeled as H1, H2, H3, L1, L2, and L3.
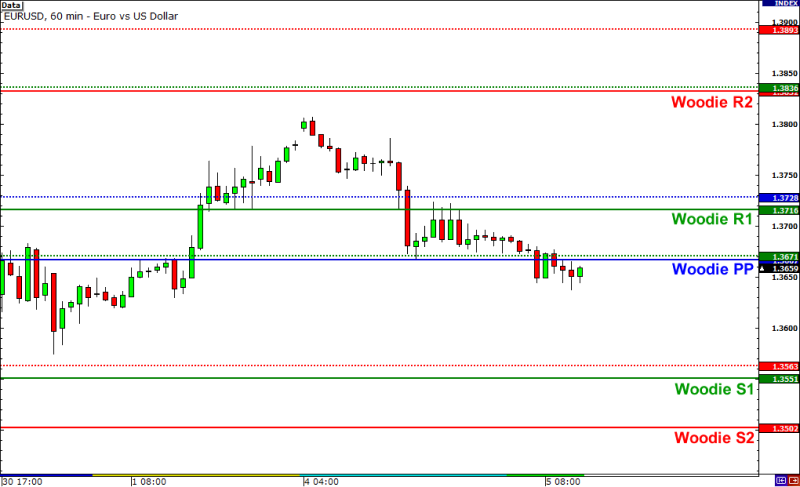
Woodie's pivot points
Woodie's pivot points were developed by a trader named Tom Woodie and are based on the previous day's high, low, and close prices. Unlike standard pivot points, Woodie's pivot points incorporate a concept called pivots based on the trend (PBOT), which adjusts the pivot levels based on the prevailing market trend.
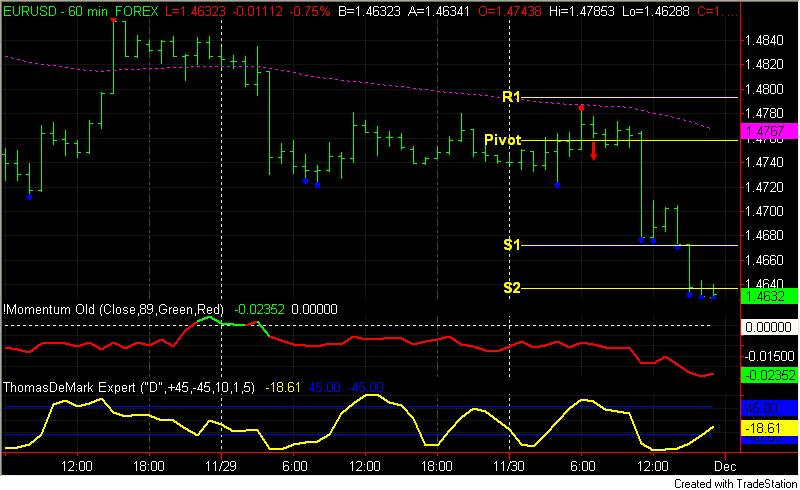
DeMark pivot points
DeMark pivot points are based on the relationship between the previous day's high, low, and close prices, as well as the opening price of the current day. DeMark pivot points aim to identify potential reversal points in the market based on specific price levels.
Advantages and risks of using pivot points for range trading
Advantages
- Clear identification of key levels for support and resistance.
- Ability to conduct multiple time frame analysis, enhancing precision in trade entries and exits.
- Scalping opportunities arise from quick movements around pivot points.
Risks
- False breakouts can occur, leading to losses if trades are entered prematurely.
- Limited applicability in trending markets, as pivot points are more effective in range-bound conditions.
- Pivot points are lagging indicators, potentially resulting in delayed responses to market movements.
How to range trade with pivot points?
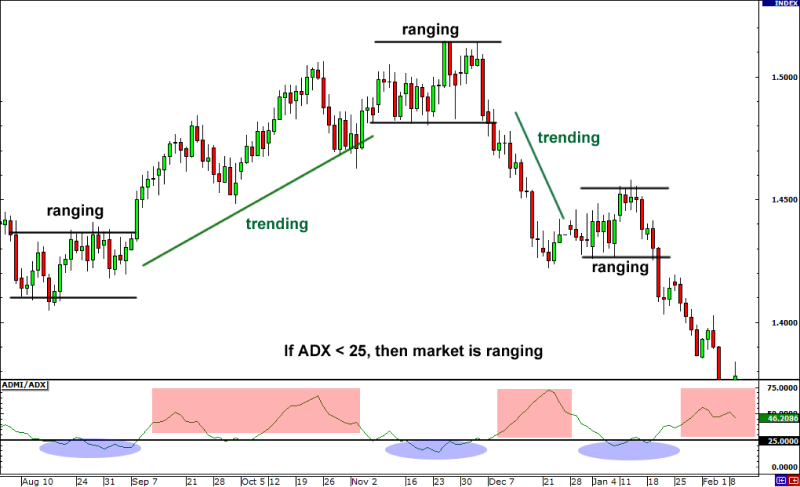
Identify the trading range
Before initiating range trades with pivot points, it is important to identify the market's trading range, such as a sideways range, trending range, volatility range, etc. This range is identified by distinct support and resistance levels, where price tends to oscillate between highs and lows without making significant directional moves.
Calculate pivot points
Pivot points are calculated using the high, low, and close prices from the previous trading period. The most common method is to calculate the Pivot Point (PP) as the average of the high, low, and close prices. Resistance and support levels are then derived from the pivot point, providing key reference points for range trading.
Adjust pivot point settings
Experiment with different timeframes and settings for calculating pivot points to suit the trading style and preferences. Shorter timeframes may require more frequent adjustments to capture changing market dynamics accurately.
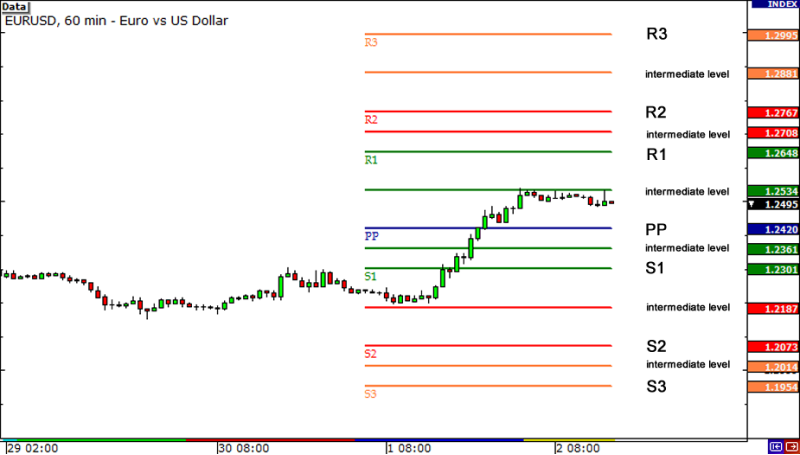
Plot pivot points on the chart
Once calculated, pivot points are plotted on the price chart, as horizontal lines. These lines represent potential areas of support and resistance, guiding traders in identifying entry and exit points for range trades.
Monitor price action at pivot points
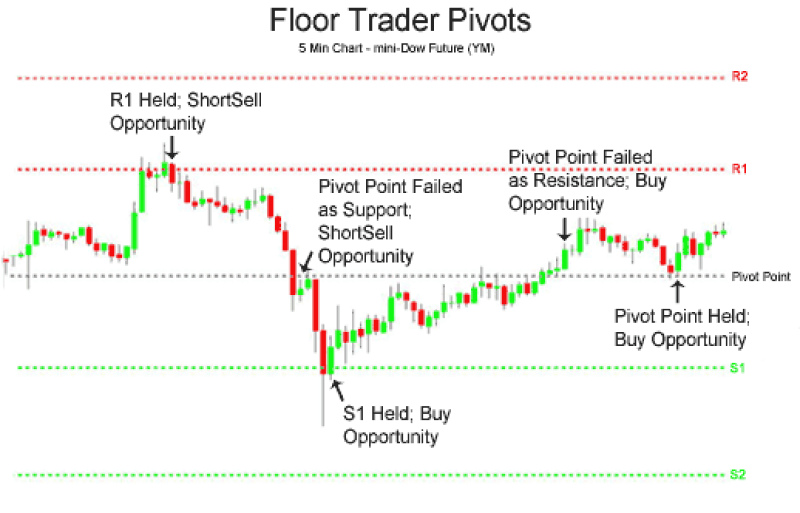
Traders closely monitor price action at pivot points to gauge market sentiment and potential trading opportunities to long or short a trade. Price reactions near pivot points, such as bounces or breaks, provide insights into market dynamics and the strength of support and resistance levels.
- Traders consider placing long orders when the price bounces off a support level near a pivot point, indicating potential upward momentum.
- They may also initiate long positions when the price breaks above a resistance level, signaling a bullish breakout and potential continuation of the uptrend.
Conversely, - Traders may opt to place short orders when the price fails to break above a resistance level near a pivot point, suggesting potential downward pressure.
- Short positions can also be initiated when the price breaks below a support level, indicating a bearish breakout and potential downtrend continuation.
Factor in market volatility
High volatility can impact the reliability of pivot points as support and resistance levels. During volatile market conditions, traders may need to widen their range boundaries or wait for more precise price action signals before entering trades.
Identify entry and exit points
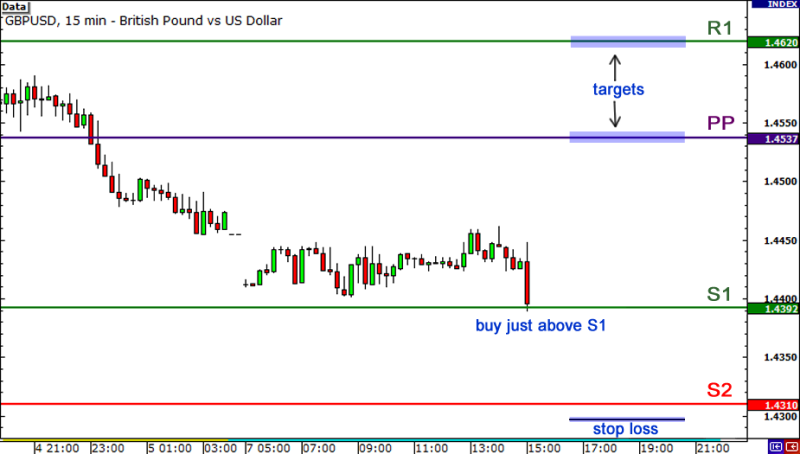
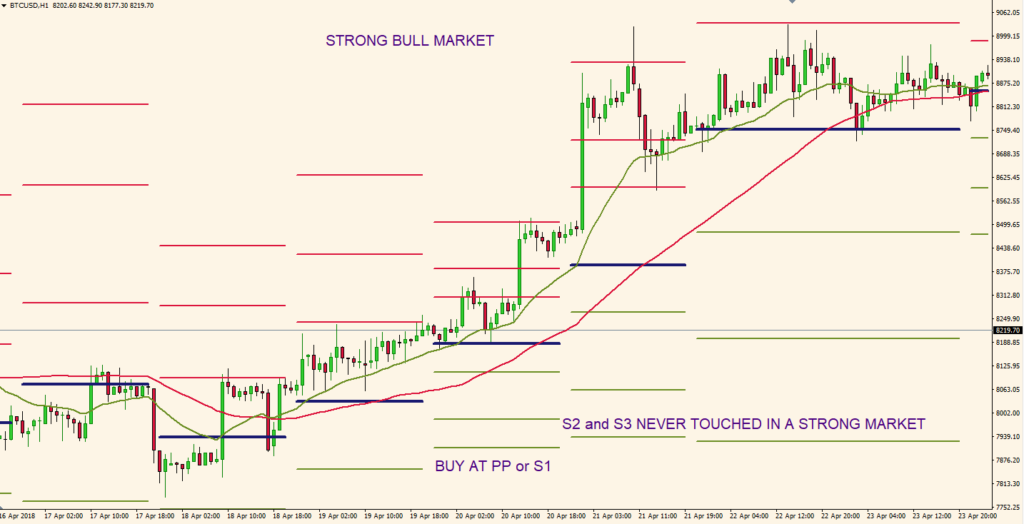
Using pivot points as reference levels once plotted on the chart, traders then identify potential entry and exit points for range trades. In range-bound markets, traders may purchase near support levels (S1, S2, S3) and short near resistance levels (R1, R2, R3).
Evaluate the overall market sentiment
When it comes to pivot points, evaluating overall market sentiment is crucial for accurate range trading. Traders should gauge broader market sentiment through various indicators, ensuring their decisions align with prevailing market dynamics –
- Sentiment indicators: Use metrics like the Put/Call ratio or volatility indices to understand whether the market sentiment is bullish or bearish.
- Market breadth: Assess the market's overall health by looking at the number of advancing versus declining currencies.
- Investor sentiment surveys: Monitor investor insights to gauge the sentiment of retail investors and align trading strategies accordingly.
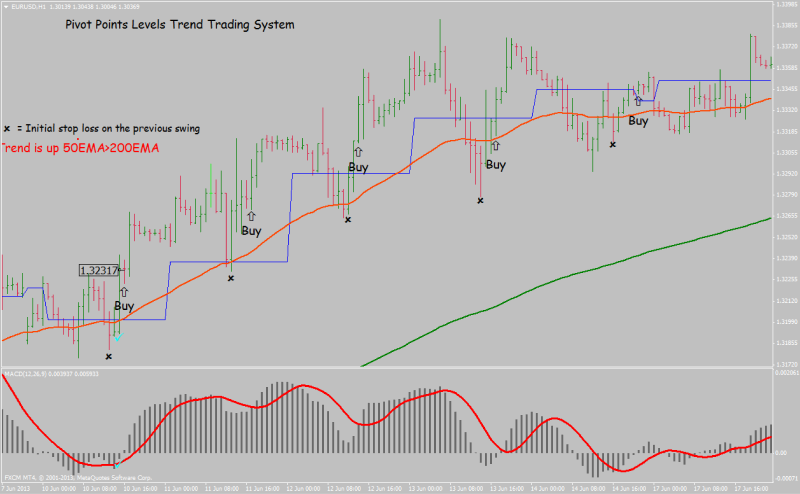
Confirm with other indicators
Before executing trades, confirming trading signals provided by pivot points with other technical indicators is important. Traders may seek additional confirmation from indicators such as trend lines, moving averages, or chart patterns to validate trading decisions and reduce the risk of false signals.
Identifying multiple support and resistance zones with pivot points
Incorporating pivot points into range trading strategies offers traders a systematic and objective approach to navigating the forex markets. Pivot points to reducing reliance on subjective analysis, promoting consistency, and reducing emotional biases. However, it is also essential to acknowledge that pivot points, like any trading tool, carry inherent risks, including the possibility of false breakouts or whipsaws, which can lead to losses if not managed properly.
FAQs
We’re here to help you every step of your trading journey. Here are some answers to the more frequent questions we get asked.
How do pivot points help traders during range-bound market conditions?
Pivot points provide reference levels, such as support and resistance, where price movements often pause or reverse. This makes them particularly useful for identifying potential trading ranges.
Can pivot points be used alongside other technical indicators?
Yes, pivot points are often used with additional indicators like moving averages, trend lines, or candlestick patterns to support trading decisions.
What should traders consider when selecting the type of pivot points to use?
The type of pivot points depends on a trader’s strategy. For example, Fibonacci pivot points are tailored to retracement analysis, while Camarilla pivot points are designed for intraday price movements.
How can market volatility influence the effectiveness of pivot points?
In highly volatile markets, price movements can breach pivot levels more frequently, reducing their reliability. Traders may need to adjust their approach or combine pivot points with other tools.
Are pivot points effective in all market conditions?
Pivot points tend to work well in range-bound markets. However, their effectiveness can diminish in strongly trending markets where prices move beyond established support or resistance levels.
Why is market sentiment important when trading with pivot points?
Market sentiment provides context to pivot point levels, helping traders anticipate potential price behavior and make better-informed decisions.
How can traders use pivot points to plan entry and exit strategies?
Traders often monitor support levels near pivot points for potential buying opportunities and resistance levels for potential selling opportunities. Market sentiment and volatility should also be considered when forming these strategies.
Disclaimer: All material published on our website is intended for informational purposes only and should not be considered personal advice or recommendation. As margin FX/CFDs are highly leveraged products, your gains and losses are magnified, and you could lose substantially more than your initial deposit. Investing in margin FX/CFDs does not give you any entitlements or rights to the underlying assets (e.g. the right to receive dividend payments). CFDs carry a high risk of investment loss.