


Customizing charts on TradingView allows traders to personalize their analysis experience. By adjusting chart types, timeframes, and colors and adding indicators, traders can tailor their setup to suit their trading strategy. Customization also helps identify trends faster, better trading focus, and streamlines decision-making.
In this article, we take a look at how traders can customize charts in TradingView in a few easy steps.
This is an example only to enhance a consumer's understanding of the strategy being described above and is not to be taken as Blueberry providing personal advice.
Using charts in TradingView
Visual representation of market data
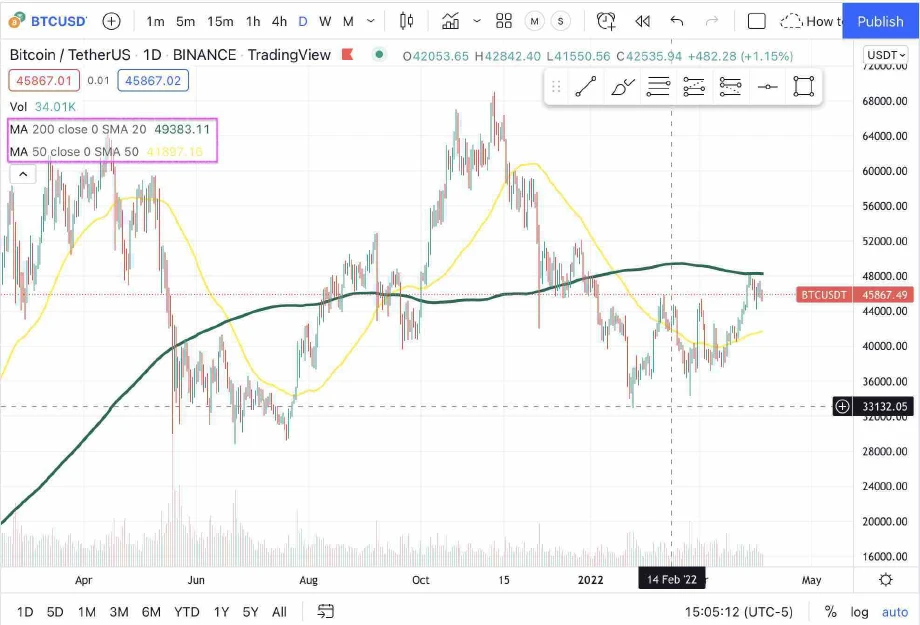
Charts in TradingView provide a clear, visual overview of market movements. The visual format helps traders quickly interpret price changes, volume, and trends. It also simplifies complex market data, making it easier for traders to spot patterns.
Technical analysis tool for identifying trends
Charts serve as tools for technical analysis. Traders use various indicators, such as moving averages or RSI, to analyze price action. These indicators help identify market trends, whether bullish, bearish, or sideways.
Price action analysis for market insights
Price action analysis relies on chart patterns and candlestick formations to predict future price movements. Traders observe key price points like support, resistance, and breakouts to understand market behavior. It helps gain insights into market sentiment.
Historical data tracking for pattern recognition
TradingView charts allow traders to track historical data over time. By reviewing past price movements, traders can recognize recurring patterns, such as head and shoulders or double tops. Historical data helps predict future market trends and price action.
Performance comparison between assets
Charts enable traders to compare multiple assets side by side. They can compare price movements, volatility, and overall performance across different assets, helping them identify potential opportunities and diversify their trading portfolios.
Top chart types available on TradingView
Candlestick chart
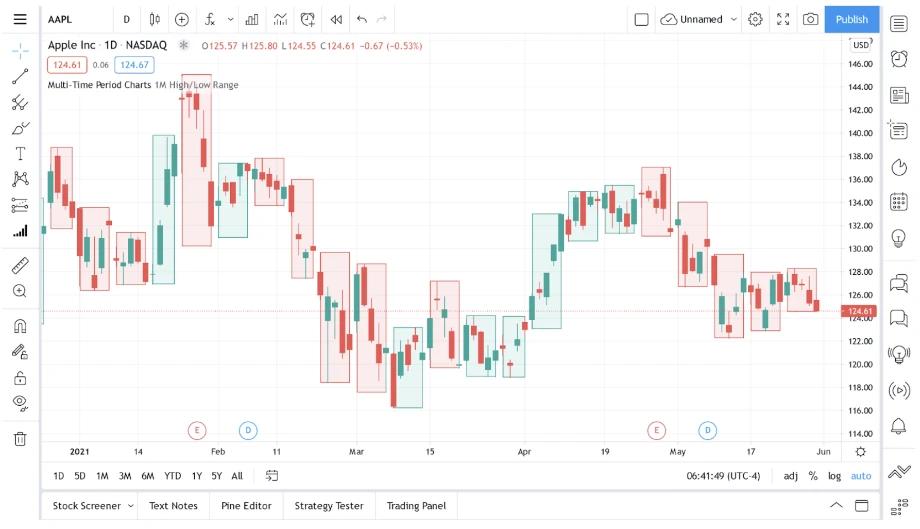
Candlestick charts clearly and visually display price movements. Each candlestick shows the open, high, low, and close prices. The body color indicates bullish or bearish trends. Candlestick patterns help traders spot reversals and continuation signals and provide in-depth market insights.
Line chart
Line charts show price movements as a continuous line connecting closing prices over a period. They also provide a simple overview of market trends, which is ideal for identifying overall direction and trends. The line chart type is suited for quick market trend analysis.
Bar chart
Bar charts display open, high, low, and close prices. Each bar represents a single period of market activity. The horizontal line shows the opening and closing prices, whereas the vertical line indicates the range of price movement. Bar charts offer more detail than line charts and help traders analyze price fluctuations.
Heikin-Ashi chart
Heikin-Ashi charts are modified candlestick charts that smooth out price data to reveal trends more clearly. The Heikin-Ashi chart type filters out market noise and helps traders identify stronger trends. Heikin-Ashi charts are also useful for determining trend direction, making it easier to spot potential reversals.
How to customize charts in TradingView
Log in to the TradingView account
To begin, users should log into their TradingView account. An account is required to customize charts and save layouts for later use. New users can enter their username and password or sign up.
Select a chart
Once logged in, users should click on the Chart option to begin analyzing markets. This opens the default chart view, which can then be customized according to the user's preferences. After the chart appears, the asset and timeframes can be selected.
Choose the asset to be analyzed
Users can select the asset or market they want to analyze. TradingView supports a wide range of assets, such as stocks, forex pairs, cryptocurrencies, and commodities. The choice of asset is important when focusing on the desired trading strategy.
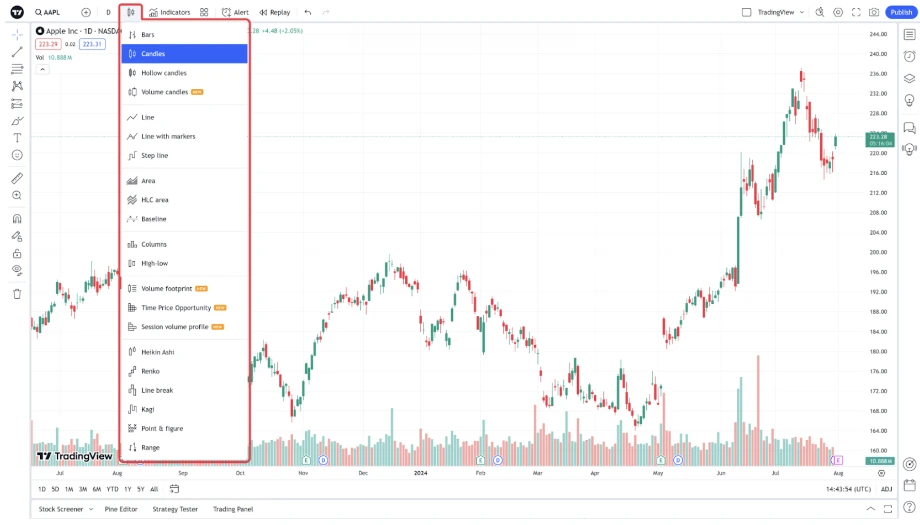
Select the chart type
Next, users should choose the chart type that fits their analysis style. TradingView offers multiple chart types, including Candlestick, Line, Bar, and Heikin Ashi. The right chart type helps traders to track market movements.
Customize timeframes
Users can customize the timeframe based on their trading strategy. TradingView offers timeframes ranging from seconds to months. Adjusting the timeframe helps traders analyze market trends according to their preferred trading horizon.
Add indicators and tools
Users can improve their analysis by adding indicators and drawing tools. TradingView provides numerous technical analysis tools like RSI, MACD, Bollinger Bands, and more. Additionally, users can draw trendlines, channels, or Fibonacci retracements to aid their analysis.
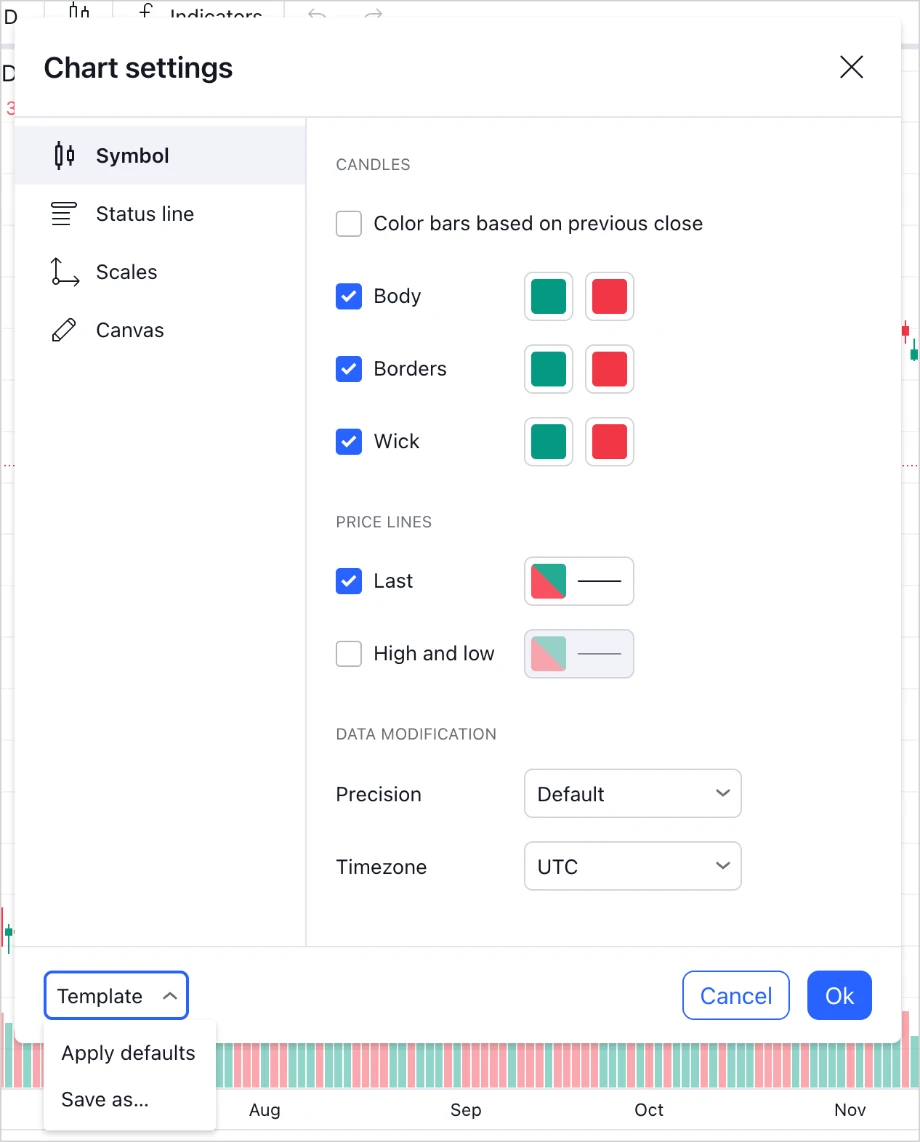
Change chart colors and themes
Users can customize the appearance of their charts by adjusting colors and themes. The feature helps make the chart more visually appealing or easier to read. Modifying the colors of candles, gridlines, and the background can improve clarity.
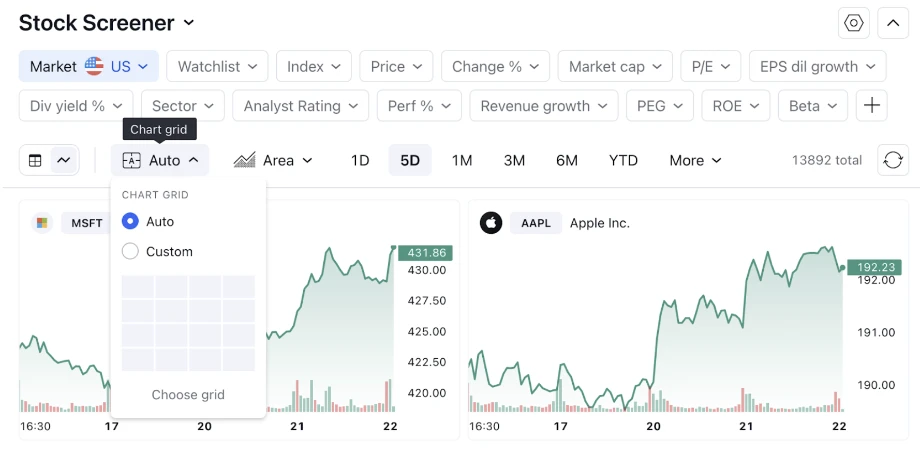
Adjust the scale and grid
Users can adjust the chart's scale and grid for better readability. Zooming in or out modifies the scale while customizing gridlines makes the chart more organized, helping users accurately read price levels and market movements.
Add alerts
Users can set price alerts to stay informed of market movements. TradingView allows alerts based on price points, indicator values, or trend conditions, ensuring users are promptly notified when significant levels are reached.
Save the custom chart layout
Once the chart is customized, users can save the layout for future use. TradingView offers the option to save multiple layouts with different settings. This saves time by eliminating the need to redo customizations when analyzing new assets.
Export and share (optional)
If necessary, users can export or share their charts. TradingView allows users to save charts as images or export data for further analysis. Users can also share their charts with others via social media, email, or by generating a direct link.
Balance customization for optimal trading efficiency on TradingView
Customizing charts on TradingView allows traders to tailor their analysis tools, chart appearance, and timeframes. It also improves the visual appeal and clarity of data. However, over-customization may lead to information overload or distractions. Beginners may struggle with complex settings. Chart customization improves user experience but requires careful balance to avoid confusion and ensure practical analysis.
Disclaimer: All material published on our website is intended for informational purposes only and should not be considered personal advice or recommendation. As margin FX/CFDs are highly leveraged products, your gains and losses are magnified, and you could lose substantially more than your initial deposit. Investing in margin FX/CFDs does not give you any entitlements or rights to the underlying assets (e.g. the right to receive dividend payments). CFDs carry a high risk of investment loss.