


TradingView is a platform for analyzing the forex market. It offers advanced charting tools, indicators, and real-time data. Whether a trader is just starting out or is an experienced one, TradingView provides a range of features to suit each one's trading needs.
Let's dive into using TradingView for forex market analysis.
Using TradingView for forex analysis: Top features
Real-time market data
TradingView provides live forex price updates, allowing traders to track market movements as they happen. Access to real-time data supports timely analysis and reduces lag in market monitoring.
Advanced charting tools
TradingView offers detailed charts for forex analysis. Multiple chart types suit different trading strategies. Custom timeframes also allow precise market trend tracking. Traders can analyze price movements more clearly with advanced charting tools.
Customizable indicators and overlays
Users can add indicators to refine forex strategies. Custom overlays clearly highlight key price levels. Traders can also adjust settings to match their needs. Personalizing tools improves trading accuracy and efficiency.
Multi-timeframe analysis
Viewing different timeframes helps one understand broader trends. Short-term charts show quick price movements, while long-term charts reveal overall market direction. The approach enhances strategic decision-making in forex trading.
Drawing tools for technical analysis
TradingView provides tools like trendlines and Fibonacci retracements. Traders use them to identify key market patterns. Drawing tools also assist in marking support and resistance. Such visual analysis strengthens overall forex trading strategies.
Market heatmaps
Heatmaps spot strong and weak currency pairs. It comes with color coding which makes market sentiment easy to read. Traders can quickly identify potential trading opportunities with heatmaps. They also simplify comparative forex analysis.
Social trading and community ideas
Traders can share insights and strategies on TradingView. Social features enable learning from market experts. Community-driven ideas also help refine forex trading approaches. Such interactive discussions improve decision-making and market understanding.
Integration with brokers for live trading
TradingView connects with brokers for direct execution. Traders can place orders without leaving the platform. The seamless integration improves trading speed and convenience. Efficient execution improves overall forex trading performance.
How to read forex charts on TradingView
Open TradingView and log in
Visit the official website to access TradingView. Enter login details to access the trading dashboard. Traders must ensure account settings match personal trading preferences. A personalized dashboard will improve the overall trading experience.
Search for forex pairs
Use the search bar to find currency pairs. Type the pair symbol to locate it.
Choose the chart type
Select a suitable chart type for analysis. For example, candlestick charts show price movements with clarity, whereas line charts simplify trend identification over time. The right chart type improves market interpretation.
Understand the price scale
Observe the vertical axis displaying price levels. Higher prices indicate bullish movement in forex, while lower prices suggest bearish trends in currency pairs. Understanding the scale helps assess market direction.
Review timeframes
Switch between different timeframes for better insights. Short-term traders prefer 1-minute or 5-minute charts. Whereas, long-term investors analyze daily or weekly charts. Timeframe selection aligns with trading strategy.
Identify trend and price action
Look for upward or downward movement in charts. Strong trends indicate market direction and strength. Additionally, price action helps determine potential entry points. Recognizing trends improves forex trading decisions.
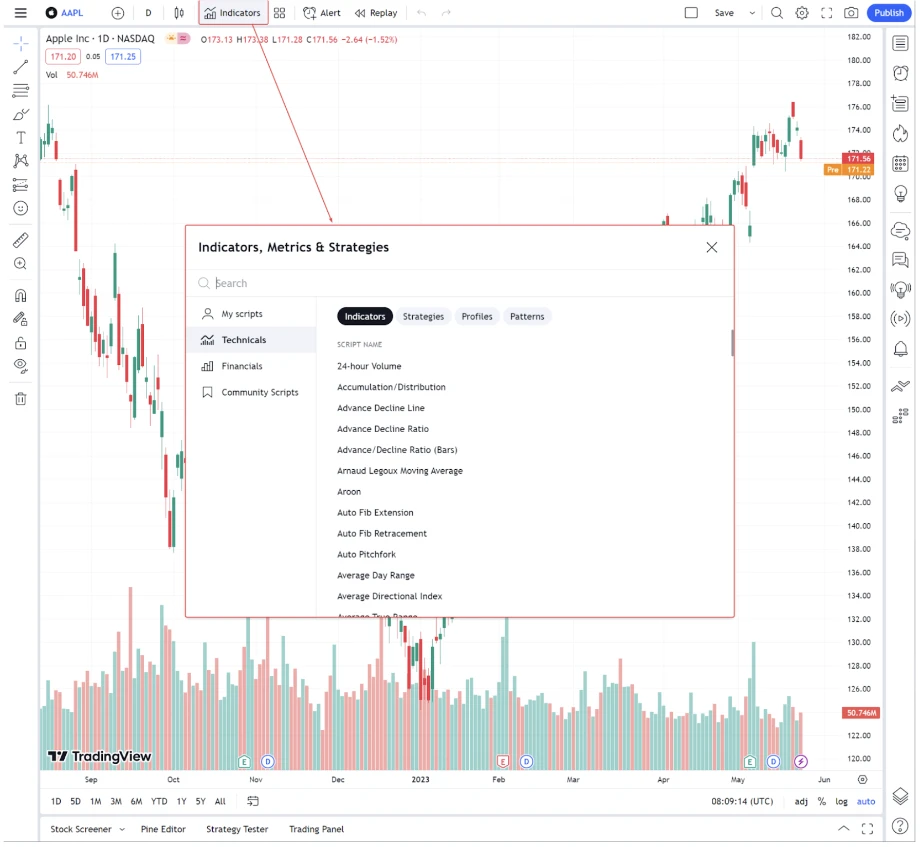
Apply technical indicators
Use indicators like RSI, MACD, moving averages, and more. These tools help confirm market trends. Customizing indicators refine personal trading strategies. Indicators provide deeper insights into price movements.
Use drawing tools
Draw trendlines, Fibonacci levels, and support zones with drawing tools. These tools help traders mark key levels easily. Visual analysis strengthens technical forecasting abilities, and using drawing tools also improves forex market insights.
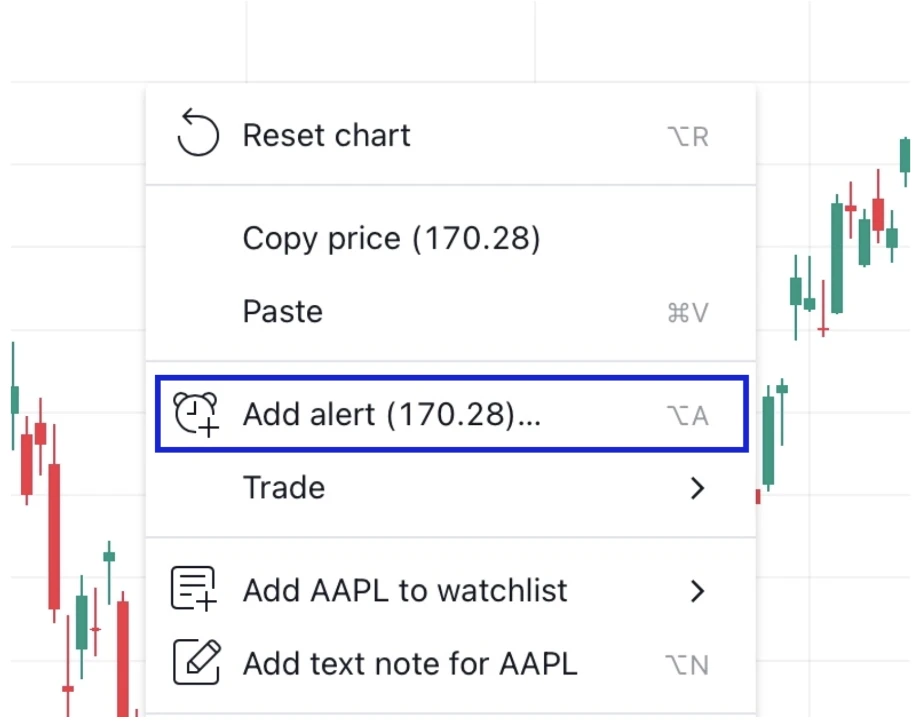
Set price alerts
Configure alerts for important price movements. Alerts notify traders of potential trade opportunities. Timely notifications also help you react quickly to changes. Smart alerts improve market monitoring efficiency, as well.
Analyze volume
Check volume bars to measure market participation. High volume confirms strong trends in forex trading, while low volume may indicate weak market activity. Analyzing volume supports better trade decisions.
Save and customize the chart
Personalize the chart layout for easier future analysis. Save preferred settings for quicker access later. A customized view improves trading efficiency, and well-organized charts simplify ongoing forex market analysis.
This is an example only to enhance a consumer's understanding of the strategy being described above and is not to be taken as Blueberry providing personal advice.
How to use TradingView for backtesting forex strategies
Log in to the TradingView account
Traders must first access TradingView using their login credentials. They should then familiarize themselves with the platform’s features for a smoother experience. TradingView's user-friendly interface enables traders to test various tools easily. A well-structured setup ensures a seamless backtesting process.
Select the forex pair for backtesting
The trader must choose a currency pair relevant to their strategy. Major pairs like EUR/USD, GBP/JPY, and USD/JPY offer high liquidity. Minor or exotic pairs, however, may behave differently under certain conditions.
Selection should be based on volatility, trading style, and strategy goals. Frequently traded pairs provide more reliable data for backtesting. Traders can begin with pairs they are familiar with. A well-chosen forex pair increases the accuracy of the results.
Choose the desired timeframe
Selecting the appropriate timeframe depends on the trader's objectives. Scalpers use 5-minute or 15-minute charts for quick trades. Swing traders rely on hourly or daily timeframes for trend confirmation. Long-term investors analyze weekly or monthly charts for broader trends.
Each strategy performs differently across various timeframes. Choosing the right timeframe ensures more accurate backtesting, and comparing multiple timeframes provides deeper market insights.
Use the Strategy Tester tool
TradingView's Strategy Tester tool helps traders simulate their strategies using historical data. The feature automates performance calculations. It also provides essential trading metrics.
The tool then assists in validating trading approaches before live execution.
The Strategy Tester also saves time compared to manual backtesting. Traders can adjust various settings and see the results. Efficient use of this tool increases confidence in a strategy.
Select or create a strategy
Traders can choose from TradingView's pre-built strategies or develop a custom one. The platform offers various predefined strategies for different trading styles. Custom strategies allow traders to refine their approaches further.
Those with coding knowledge can also create personalized scripts. Testing multiple strategies together helps identify the most effective one.
Apply the strategy to the chart
Once a strategy is selected, it must be applied to the forex chart. The chart will then display entry and exit points based on the strategy’s conditions. This visual representation helps traders observe past trade performance.
Understanding historical data allows for further refinements. Adjusting parameters in real-time improves accuracy. The applied strategy should align with trading objectives and risk tolerance.
Adjust strategy settings
Traders must fine-tune their strategy settings to optimize performance. Adjusting stop-loss levels can help manage risk. Tweak take-profit levels for improved trade exits. Modifying indicator parameters also ensures alignment with market conditions.
Testing strategies with different trade sizes can assist in evaluating position management. Even small adjustments may influence trading outcomes, but results are not guaranteed. Proper fine-tuning supports informed trading decisions.
Analyze backtest results
Reviewing key performance metrics is crucial for assessing a strategy's effectiveness. Traders should examine the win rate, drawdown, and gain level. Analyzing the total number of trades executed provides deeper insights.
Identifying weak areas also allows for necessary refinements. Evaluating performance across different conditions helps in further adjustments. A thorough analysis ensures that the strategy is viable for live trading.
Optimize the strategy
Traders should remove elements that reduce gains and optimize the strategy. Adjusting position sizing and leverage improves risk management. Furthermore, testing different stop-loss and take-profit levels refines execution.
Modifying strategy conditions also ensures adaptability to different market scenarios. The goal is to maximize returns while minimizing risks. A well-optimized strategy increases consistency and long-term trading viability.
Test across different time periods
The strategy should be tested across various historical periods. Comparing performance during different market cycles ensures adaptability. Backtesting in both high and low volatility conditions also provides better insights.
Analyzing results in bullish and bearish trends highlights strengths and weaknesses. Testing across multiple timeframes improves overall strategy outcomes. A strategy that performs well in diverse conditions is always more reliable.
Use multiple strategies for comparison
Comparing different strategies helps traders identify the suitable trading approach. Various methods, such as moving averages, breakout trading, and trend-following strategies, offer different advantages. Some strategies perform well in trending markets, while others excel in ranging conditions.
Evaluating multiple methods provides a more balanced approach to trading. A diversified strategy portfolio reduces dependence on a single technique. Comparing these results improves overall trading performance.
Save backtest results
Saving backtest results allows traders to track improvements over time. Maintaining records helps in analyzing long-term performance. Additionally, reviewing past data provides insights into strategy refinements.
Well-documented results assist in identifying recurring market patterns, and organized data supports continuous learning and strategy enhancement. A structured approach to backtesting contributes to long-term trading gains.
This is an example only to enhance a consumer's understanding of the strategy being described above and is not to be taken as Blueberry providing personal advice.
Using technical indicators for forex analysis on TradingView
Moving averages for trend identification
Moving averages smooth price action over a chosen period. They help traders identify the overall market direction. Traders use them to spot entry and exit points.
- A rising moving average signals an uptrend forming
- A falling moving average indicates a potential downtrend ahead. Crossovers between short- and long-term averages confirm trends
RSI for overbought and oversold conditions
The Relative Strength Index (RSI) measures price momentum shifts.
- Values above 70 indicate an overbought market condition
- Values below 30 suggest an oversold market setup
Traders use RSI to anticipate potential trend reversals early. Divergences between RSI and price action signal warnings. Adjusting RSI periods also improves its responsiveness to market conditions.
MACD for trend and momentum analysis
The MACD helps identify trend strength and direction changes. It consists of two moving averages and a histogram.
- An MACD crossover above zero suggests bullish momentum rising
- A crossover below zero signals growing bearish strength
The histogram reflects momentum changes in real-time visually. Traders rely on MACD for trend confirmation signals.
Bollinger bands for volatility analysis
Bollinger bands expand and contract based on market volatility. Wide bands indicate high volatility, while narrow bands suggest low volatility and potential breakouts. Traders use these bands to identify breakout and reversal opportunities.
- Price touching the upper band signals possible overbought conditions
- Price reaching the lower band suggests an oversold market
Stochastic oscillator for identifying reversal points
The stochastic oscillator measures momentum shifts in price.
- Readings above 80 suggest an overbought market condition
- Readings below 20 indicate an oversold market setup
Traders look for crossovers to confirm potential reversals. Divergences between the price and the oscillator signal trend weakness. It also helps traders spot turning points before price movements occur.
Tips for maximizing TradingView's forex analysis capabilities
Utilize drawing tools for accuracy
Drawing tools help mark key support and resistance levels. Traders use trendlines to identify breakout opportunities early. Fibonacci retracements highlight potential price reversal zones. Channels help track price movements within a defined range. Accurate drawings improve trade entries and exits effectively. They enhance technical analysis and decision-making precision.
Explore community ideas
TradingView's community shares valuable insights and strategies daily. Traders can access ideas from experienced professionals. Analyzing shared strategies also refines personal trading approaches.
Traders can compare multiple viewpoints to improve decision-making skills. Such community insights provide fresh perspectives on forex trends.
Use the mobile app for analysis on-the-go
The TradingView mobile app allows market monitoring anywhere. Real-time alerts notify traders of price movements, and mobile-friendly charts enable quick technical analysis.
Traders are able to execute trades without needing a desktop setup. Seamless synchronization keeps all data updated automatically. Such on-the-go access ensures no trading opportunities are missed.
Apply custom scripts and strategies
TradingView allows custom scripts for advanced technical analysis. Traders can automate strategies using Pine Script. Custom indicators also enhance market predictions with unique insights.
Strategy optimization becomes better with tailored scripts. Backtesting tools also help refine personalized trading approaches. Custom scripts provide an edge in volatile forex markets.
Create watchlists for easy access to key assets
Watchlists help traders track multiple forex pairs conveniently. Organizing assets streamlines analysis and decision-making processes. Customizing lists based on strategy also improves efficiency.
Price alerts ensure traders stay updated on movements. Monitoring the specific assets eliminates distractions from unnecessary market noise. Watchlists also simplify forex market tracking for better focus.
Use the replay feature to practice strategies
The replay feature simulates past market conditions while backtesting. Traders can test strategies without risking actual capital, and reviewing past price movements can also improve their pattern recognition skills.
Better forex analysis with TradingView tools
TradingView's tools improve forex analysis with precision. Drawing tools help mark key levels for better trade entries. Whereas community ideas offer fresh insights and strategy comparisons. However, over-reliance on indicators may lead to analysis paralysis. Community ideas can sometimes be biased or misleading; hence should always be confirmed with technical analysis.
Disclaimer: All material published on our website is intended for informational purposes only and should not be considered personal advice or recommendation. As margin FX/CFDs are highly leveraged products, your gains and losses are magnified, and you could lose substantially more than your initial deposit. Investing in margin FX/CFDs does not give you any entitlements or rights to the underlying assets (e.g. the right to receive dividend payments). CFDs carry a high risk of investment loss.