
I guess many retail traders either wanted the markets to close early at the end of last week or stay open for the weekend depending on what side of the market they were on. This week the markets will open with some further uncertainty as traders continue to digest the recent tariff announcements. The data doesn’t stop however, and we will see key releases from the United States, United Kingdom and New Zealand.
Forecast for April 7, 2025
USD Outlook
The USD climbed on Friday after the tariff fallout, but bond yields remain under pressure. This sentiment could continue into the new trading week, with more key data on the horizon, it will be hard for the greenback to make a big comeback. Attention will be paid to CORE CPI (Consumer Price Index) on Thursday, which is forecast to rise to 0.3%. A higher number here, combined with a lower consumer sentiment figure expected on Friday could continue to compound the pressure being felt in the markets.
The CME FedWatch Tool analyses the bond market to predict what traders are pricing in for the next Federal Reserve meeting. As of this week the chance of a rate cut by the Fed has now changed dramatically. Just a week ago, the tool showed a 81.5% probability of a rate held by the Fed, however, this has now come down to a 66.7% probability. If bond traders continue to price there is more chance of a rate cut coming, then the USD could weaken.
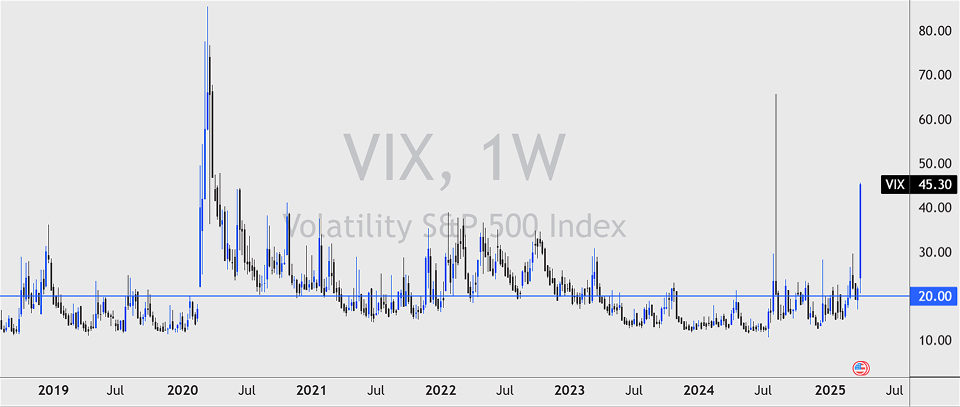
On the side of risk, the volatility index reached the highs of 45.30, showing extreme fear has taken a hold of the markets. Often when we see spikes on the VIX we can see it fall, leading to a reversal in the price action caused. But this time the tale may be different, and we may see volatility remain high for now.
USD/JPY Outlook
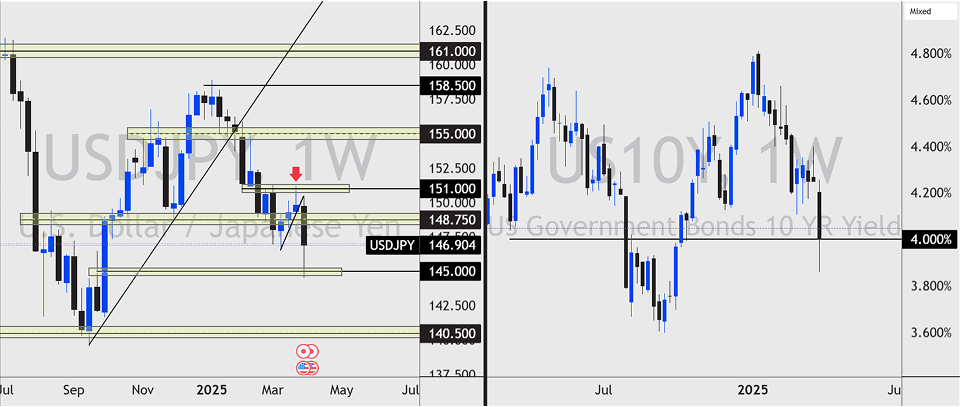
The Japanese Yen was one of the top performing currencies last week to no real shock. When fear rises the JPY is often the go to for the market and this time was no exception. If you were monitoring the price action on AUD/JPY you would have seen the forex pair fall to 5.8% open to close. USD/JPY suffered a similar fate, falling 4% from weekly high to low.
We often discuss the correlation between the US10Y (United States 10-year treasury bond yields) and the USD/JPY, which is a close one. US10Y has now traded to a yearly low of 4%, meaning that traders are beginning to price in significant rate cuts by the Federal Reserve. If these bond yields continue to fall then we could expect the USD/JPY price to go with it.
USOIL (Crude Oil) Outlook
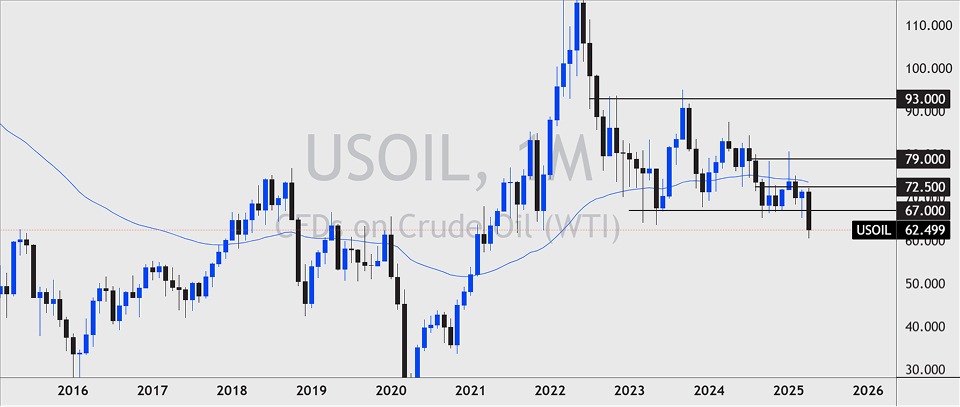
When Donald Trump was sworn in as the new President of the United States, he stated in a speech that he wanted to see lower oil prices. As the United States is the largest producer of oil in the world, it meant the market took his word seriously. The price of crude oil fell in dramatic fashion last week and has currently formed new multi-year lows at $62.50. This new low comes after the price breached the longstanding support at $67.00. Oil prices have a strong relationship with CPI in the U.S which could mean that the inflation rate in the U.S will come in lower over the next few months.
OPEC+ on Friday announced that they will raise production output despite the fall in price, which could compound the weakness we are seeing in the prices currently.
NASDAQ Outlook
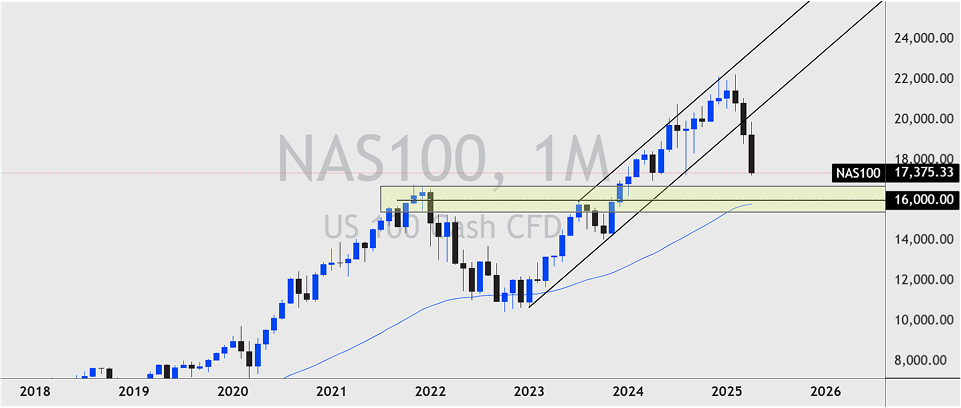
The Nasdaq is now down 9.9% for the month of April and we are only one week in. That shows us how the market felt about the recent narrative around Trump's tariffs. Tech stocks have been hit hard as Trump announced further tariffs on the likes of China, Taiwan and Singapore.
President Donald Trump placed a 32% tariff on Taiwan, which prompted Taiwan based stocks to fall aggressively. Taiwan is the global leader in electronics and semiconductors, which Trump wants to try and slow down whilst the U.S can catch up with their advancements.
The price of the Nasdaq breached a bullish channel which was formed from the lows of 2022, and was anchored to the low of October 2023. This bearish drop could bring the price into the supporting zone around $16,000. On the weekly chart the 50 week moving average sits just below this level and could be targets for strong sellers.
Trade smarter with low spreads and lightning-fast executions. Open a live account today and experience unparalleled support from our dedicated customer service team. Blueberry is here to help every step of the way!
Trade Now Open a Demo Account