


The yield curve in forex is crucial as it provides insights into interest rate expectations and economic conditions, influencing currency valuations. By analyzing yield curves, traders can anticipate shifts in central bank policies, predict future interest rate movements, and identify potential trading opportunities.
However, it's important to acknowledge that navigating the intricacies of the yield curve comes with its own set of risks and challenges. One potential risk is the inherent uncertainty in economic forecasting, as unexpected events or policy changes can quickly alter market dynamics. Additionally, yield curve analysis requires a deep understanding of macroeconomic indicators and the ability to interpret complex financial data accurately.
In this article, we discuss everything about the yield curve, its strategies, and how to use them in forex.
What is a yield curve?
A yield curve (YC) is a graphical representation of the relationship between the interest rates (yields) and the maturity dates of a set of fixed-income securities, such as bonds, with similar credit quality but different maturity dates. The yield curve shows the yields of bonds plotted against their respective maturities, ranging from short-term to long-term.
Typically, a yield curve slopes upward, indicating that longer-term bonds have higher yields than shorter-term bonds. This normal yield curve reflects the expectation that investors require higher compensation (in the form of higher interest rates) for holding onto investments for a longer period due to the increased risk associated with time, such as inflation risk or uncertainty about future interest rates.
However, yield curves can take various shapes, including:
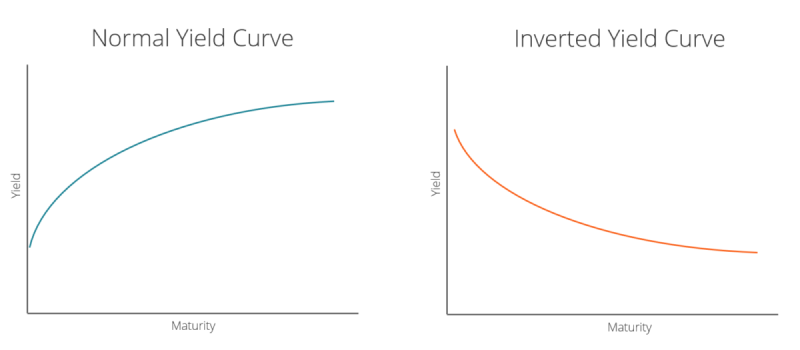
- Normal yield curve: Normal YC is where longer-term bonds have higher yields than shorter-term bonds.
- Inverted yield curve: Shorter-term bonds have higher yields than longer-term bonds. An inverted yield curve is often considered a sign of economic recession or an impending economic downturn. It suggests that investors expect interest rates to fall in the future, possibly due to a weakening economy.
- Flat yield curve: When there is little difference between short-term and long-term interest rates. A flat yield curve might indicate uncertainty about future economic conditions.
How to identify a yield curve?
Collect bond yield data
Start by gathering yield data for bonds with different maturities issued by the same entity (government or corporation) and with similar credit risk. Traders can typically find this data on financial news websites, trading platforms, or financial databases.
Plot the yields against maturities
Once traders have the yield data, they can plot it on a graph with the bond maturities on the horizontal axis (x-axis) and the corresponding yields on the vertical axis (y-axis). Each point on the graph represents the yield of a bond with a specific maturity.
Interpret the shape
After plotting the data, analyze the shape of the curve. A normal yield curve slopes upwards, indicating that longer-term bonds have higher yields than shorter-term bonds. An inverted yield curve slopes downwards, meaning that short-term bonds have higher yields than long-term bonds. A flat yield curve shows little difference in yields between short-term and long-term bonds.
Consider economic implications
Once traders have identified the shape of the yield curve, consider its implications for the economy. A normal yield curve is generally associated with a healthy economy, while an inverted yield curve often signals an economic downturn or recession.
Monitor changes over time
Yield curves are dynamic and can change in response to economic conditions, central bank policies, and market sentiment. Continuously monitor changes in the yield curve to gauge shifts in market expectations and the economic outlook.
Use additional analysis
While plotting and interpreting the yield curve is essential, it is also helpful to supplement the analysis with other economic indicators, such as inflation rates, unemployment data, and central bank statements, to comprehensively understand the market environment.
How to use a yield curve in forex?
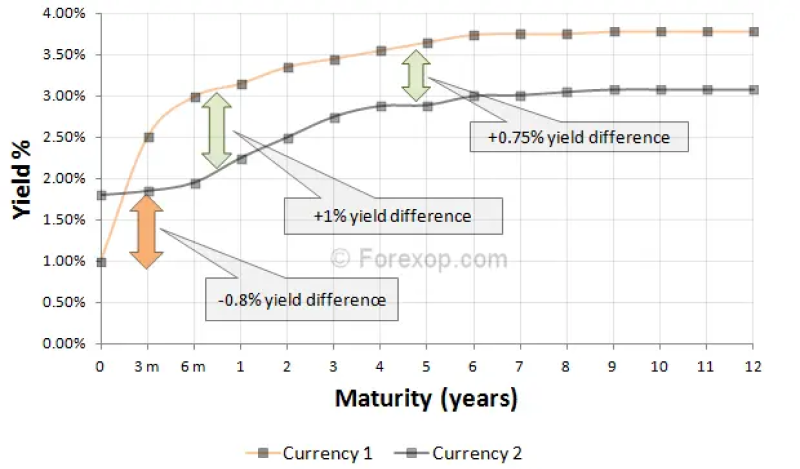
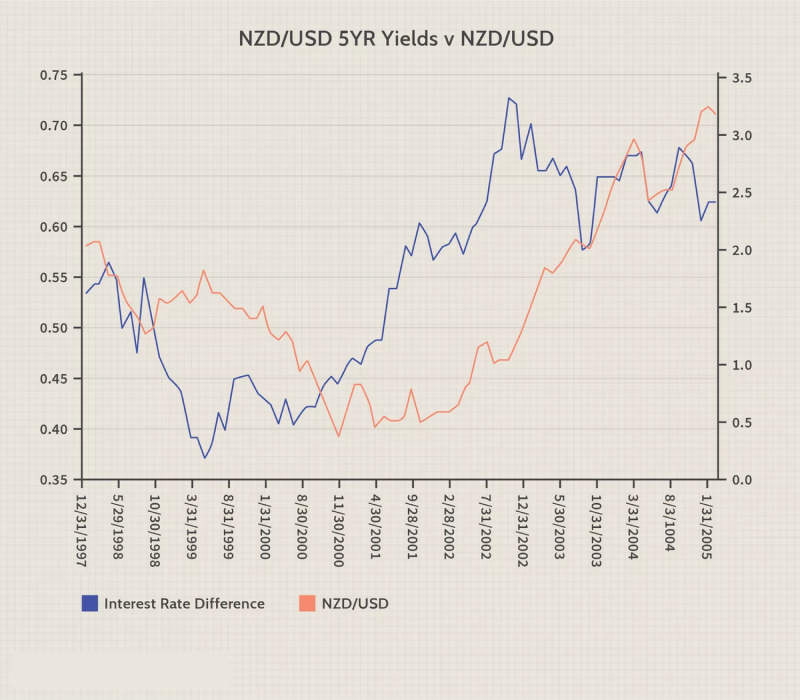
Interest rate differentials
Pay attention to interest rate differentials between currencies. Currencies with higher interest rates are typically more attractive to investors as they offer higher investment yields. Traders often purchase currencies with higher interest rates and short currencies with lower interest rates to gain from the interest rate differentials.
Central bank policies
Monitor central bank policies and announcements as central banks adjust interest rates based on economic conditions, which can influence currency valuations. For example, suppose a central bank signals an intention to raise interest rates (resulting in an upward-sloping yield curve). In that case, it may lead to an appreciation of the currency relative to others.
Carry trade strategy
Consider employing the carry trade strategy, which involves borrowing a currency with a low-interest rate and investing in a currency with a high-interest rate. While not directly tied to yield curves, the carry trade strategy relies on interest rate differentials, which can be seen as analogous to yield differentials.
Impact of yield curve shifts
Although forex trading does not involve direct yield curve analysis, changes in yield curves in major economies can impact currency markets indirectly. For instance, an inverted yield curve in a major economy may signal an impending recession, leading to risk aversion and potentially affecting currency valuations negatively.
Incorporate fundamental analysis
Combine yield curve analysis with fundamental analysis of economic indicators such as GDP growth, inflation, employment data, and trade balances. This holistic approach can provide a more comprehensive understanding of the factors influencing currency movements.
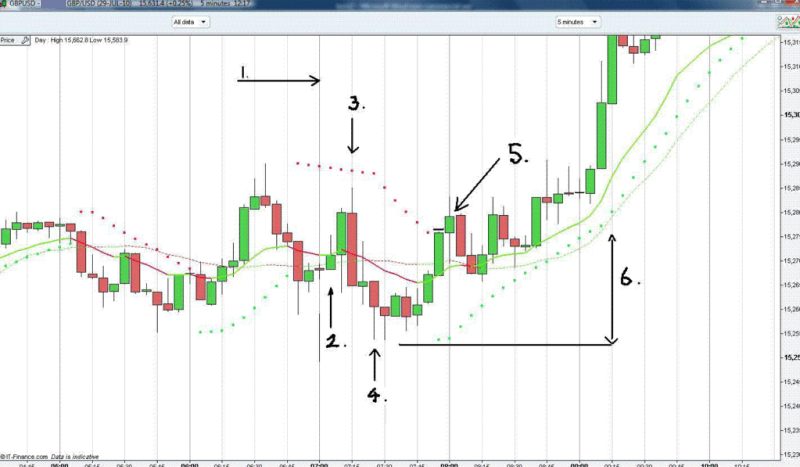
Technical analysis confirmation
Use technical analysis techniques to confirm and complement the fundamental analysis. Technical indicators such as moving averages, support and resistance levels, and chart patterns can help identify potential entry and exit points for forex trades based on fundamental factors, including interest rate differentials influenced by yield curves.
Advantages and risks of using a yield curve
Advantages
- Interest rate expectations: Yield curves provide valuable insights into market expectations regarding future interest rates. By analyzing the shape and movements of yield curves, investors can gauge sentiment and anticipate potential shifts in monetary policy.
- Economic indicator: Yield curves are considered leading indicators of economic conditions. Changes in yield curve shapes, such as inversions, can signal impending economic recessions or expansions, helping investors make informed decisions about asset allocation and risk management.
- Risk assessment: Yield curves offer a framework for assessing risk in fixed-income investments. By comparing yields across different maturities, investors can evaluate the relative risks associated with short-term versus long-term bonds and adjust their portfolios accordingly.
Risks
- Predictive limitations: While yield curves are valuable indicators, they have limitations in predicting future economic and market conditions accurately. Unexpected events and structural changes can lead to deviations from historical patterns, challenging the reliability of yield curve analysis as a predictive tool.
- Assumption of rational markets: Yield curve analysis relies on the assumption of efficient and rational markets. However, market dynamics are often influenced by behavioral biases, speculation, and irrational exuberance, leading to potential distortions in yield curve signals.
- Central bank interventions: Central bank interventions, such as quantitative easing or interest rate manipulation, can distort yield curve signals and disrupt their predictive accuracy. Unconventional monetary policies can artificially influence bond yields and yield curve shapes, complicating interpretation for investors.
Top tips to use a yield curve accurately
Integrate with carry trade
Consider interest rate differentials derived from the yield curve when engaging in carry trade strategies. Favor currencies with higher interest rates and positive yield differentials compared to currencies with lower rates.
Evaluate forward rate agreements (FRAs)
Use yield curve analysis to assess the attractiveness of forward rate agreements. Compare the implied forward rates derived from the yield curve with market expectations and adjust trading strategies accordingly.
Consider inflation expectations
Incorporate inflation expectations derived from the yield curve into trading decisions. Higher inflation expectations may lead to steeper yield curves, affecting currency valuations and influencing trading strategies.
Monitor central bank guidance
Stay informed about central bank policies and guidance regarding interest rates and monetary policy. Changes in central bank stance can impact yield curves and currency markets, providing valuable insights for trading decisions.
Forex strategies to use with the yield curve
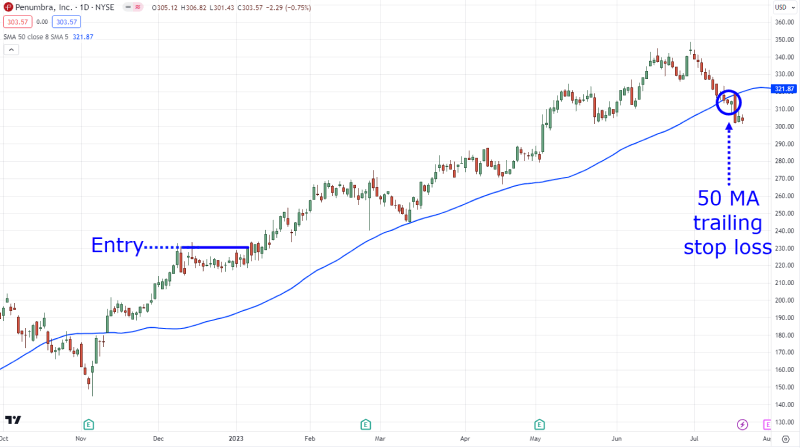
Trend following
The trend-following strategy in forex involves identifying and trading in the direction of persistent price trends using technical analysis tools. Traders can incorporate yield curve analysis to confirm and reinforce their trading decisions.
For example, if the yield curve steepens, indicating expectations of higher long-term interest rates, trend-following traders may look for currency pairs exhibiting strong upward trends that align with this expectation. They might use technical indicators such as moving averages or trendlines to identify these trends and enter positions accordingly. Additionally, they may use the yield curve as a guide to determine the duration of their trades, opting for longer-term positions if the yield curve suggests sustained trends in interest rates.
Arbitrage strategy (triangular arbitrage)
Yield curve analysis can be crucial in identifying potential arbitrage opportunities in forex trading. Traders can compare the yield curves of different currencies to identify discrepancies in interest rate expectations. If the yield curve suggests that one currency is expected to have higher future interest rates than another, traders may exploit this information to execute triangular arbitrage. They would purchase the undervalued currency and short the overvalued currency to gain from the eventual convergence of prices as interest rate expectations align.
Yield spread trading strategy
Yield spread trading involves analyzing the yield differentials between currency pairs derived from the yield curve. Traders can use this strategy to identify relative value opportunities in forex markets. For example, if the yield spread widens between two currencies due to changes in interest rate expectations, traders may take positions to capitalize on this discrepancy. They could long the currency with the higher yield and short the currency with the lower yield, expecting the yield spread to narrow as interest rate expectations adjust eventually.
Hedging
Yield curve analysis can inform hedging strategies aimed at managing currency risk exposure. Traders may use yield curve information to assess interest rate differentials between currencies and determine the appropriate hedging instruments or strategies. For example, if the yield curve suggests that interest rates in one currency are expected to rise relative to another currency, traders may hedge their currency exposure by taking offsetting positions in currency pairs or derivatives contracts. By incorporating yield curve analysis into their hedging decisions, traders can better manage currency risk in their portfolios.
Breakout trading
Breakout traders seek to capitalize on significant shifts in market sentiment or volatility. Yield curve analysis can provide valuable insights into potential catalysts for breakouts in forex markets. Traders may look for instances when the yield curve undergoes significant changes, such as flattening or inverting, which may signal economic risks or shifts in interest rate expectations.
By monitoring the yield curve alongside technical indicators, breakout traders can identify opportune moments to enter positions and capitalize on volatile moves in currency pairs.
Relative value strategy
In the relative value strategy, traders aim to exploit discrepancies in yield differentials between currencies. By comparing yield curves of different countries, traders identify currencies that are undervalued or overvalued relative to their interest rate expectations.
Balancing the advantages and risks of yield curve analysis in forex trading
Utilizing the yield curve in forex trading offers advantages such as informed decision-making based on interest rate expectations, aiding in risk management and strategy formulation.
However, excessive reliance on yield curve analysis may overlook other crucial factors impacting currency markets, leading to suboptimal trading decisions and increased exposure to market volatility. Traders must balance yield curve analysis with comprehensive market analysis and risk assessment to mitigate these risks and maximize trading effectiveness in the forex market.
Disclaimer: All material published on our website is intended for informational purposes only and should not be considered personal advice or recommendation. As margin FX/CFDs are highly leveraged products, your gains and losses are magnified, and you could lose substantially more than your initial deposit. Investing in margin FX/CFDs does not give you any entitlements or rights to the underlying assets (e.g. the right to receive dividend payments). CFDs carry a high risk of investment loss.