The Golden Cross trading signal helps identify potential trend reversal, helping traders identify entry and exit points. It assists in confirming shifts from bearish to bullish trends, reducing trading risks, and capitalizing on market opportunities.
In this article, we will learn all about golden cross trading, its strategies, advantages, and risks.
What is golden cross trading?
Golden cross trading is a technical analysis indicator which occurs when the 50-day short-term moving average crosses above a 200-day moving average, signaling a potential uptrend. It is considered a bullish signal and is used by traders to make trading decisions, mostly to enter long orders.
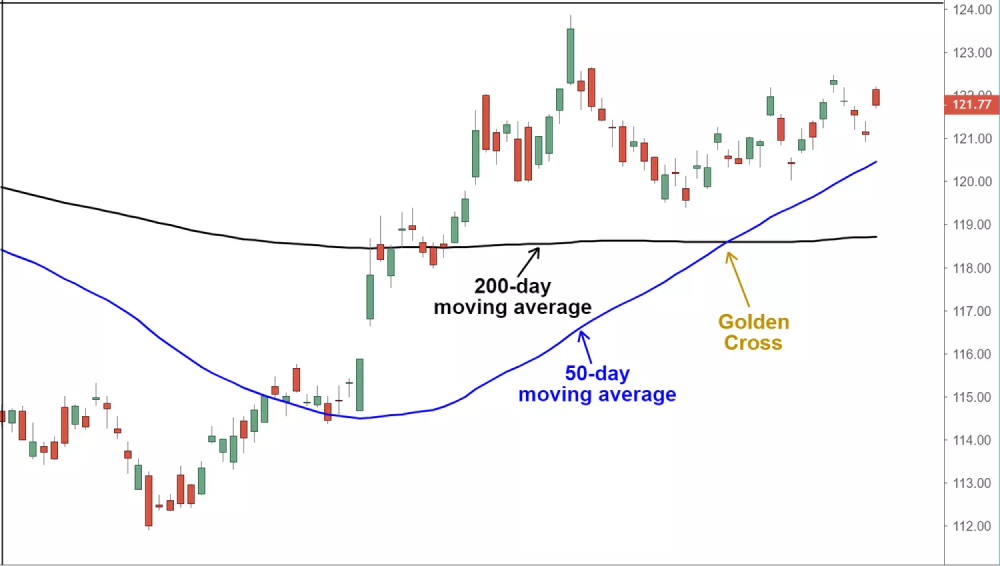
There are three key stages of a golden cross as follows:
1- Downtrend: Before a golden cross can occur, the asset is typically in a downtrend. This means that the price of the currency pair has been declining over time.
2- Crossover: The actual golden cross event takes place when the 50-day SMA crosses above the 200-day SMA. It is considered a bullish signal because it suggests that the shorter-term price trend is turning more positive and potentially indicates a shift from a bearish to a bullish market sentiment.
3- Confirmation: Traders often wait for trend confirmation before taking action. Confirmation can come in the form of higher trading volume or other technical indicators that support the bullish sentiment. This helps reduce false signals.
How does a golden cross form?
A golden cross forms in the following way:
The upward momentum: This stage starts with price action consolidating or even sharply turning higher after a prolonged period of declining prices. This initial change in price behavior indicates that the previous downtrend may be losing momentum and could be setting the stage for a potential trend reversal. During this stage, the 50-day simple moving average (SMA) remains below the 200-day SMA.
The golden cross: The golden cross itself occurs when the 50-day SMA crosses above the 200-day SMA. It is seen as a bullish signal and a trigger for potential entry points in the market. Traders and investors often interpret the golden cross as a sign that the shorter-term price trend is turning more positive.
Continued upward momentum: After the golden cross forms, price action typically continues to move higher, often creating a new uptrend. In this stage, the 50-day SMA may act as dynamic support for price action, providing a level of support as prices rise. Ideally, the price remains above the 50-day SMA for an extended period, confirming the strength of the new bullish trend and the formation of the golden cross.
Advantages and risk of a golden cross formation in forex
Advantages
- Confirms long-term trends: A golden cross can help confirm the presence of a long-term trend, making it easier for traders to align their strategies with the prevailing market direction.
- Helps in risk management: It can be used to set stop-loss levels more effectively by providing a clear signal to traders and assisting in risk management.
- Confirms reversal trends: In some cases, a golden cross may signify the reversal of a previous downtrend, allowing traders to capitalize on the potential early stages of a new uptrend.
- Gives backtesting potential: Traders can use historical data to backtest the effectiveness of the golden cross strategy, helping them refine their trading approach and gain confidence in its performance.
Risks
- Gives false signals sometimes: Like any technical indicator, a golden cross is not foolproof and can sometimes produce false signals. Market conditions can change rapidly, leading to unexpected reversals or whipsaws (a quick and unexpected reversal in price, often leading to losses for traders who took positions based on previous signals).
- Leads to market noise: In volatile or ranging markets, golden crosses can generate noise and result in frequent, ineffective signals. Traders may find it challenging to distinguish genuine crossovers from false ones.
- Results in subjectivity: Interpretation of golden crosses can be subjective, as traders may vary in their criteria for confirming the signal. This subjectivity can lead to inconsistency in trading decisions.
- Limited predictive power: While a golden cross can provide valuable information about past price movements, it has limited predictive power. It tells traders about historical trends but does not promise future price behavior. Traders should use additional indicators and analysis to enhance their decision-making.
What can a golden cross identify?
Long signals
A golden cross identifies long signals, indicating a potential opportunity to enter a long position in the market. When the 50-day simple moving average (SMA) crosses above the 200-day SMA, it suggests a shift in market sentiment from bearish to bullish, signaling that prices may rise. Traders use this signal to consider purchasing an asset or currency with the expectation of gaining from an upward price trend.
Stop losses
Traders often use a golden cross to set stop-loss orders. A stop-loss is a predetermined price level at which a trader will exit a position to limit potential losses. By placing a stop-loss order below the entry price for a long trade triggered by a golden cross, traders aim to protect their capital in case the market moves against their position, mitigating the risk of substantial losses.
Confirmations
While a golden cross is a strong bullish signal, traders often seek confirmations from other technical indicators or analysis methods before making trading decisions. These confirmations may include increased trading volume, additional technical patterns (e.g., candlestick patterns), or alignment with fundamental analysis. Confirmations help traders reduce the likelihood of false signals and provide added confidence in the trading strategy based on the golden cross.
Mistakes to avoid while trading with the golden cross
- Late entries: Avoid entering a trade too late after a golden cross signal has formed, as the most suitable entry points often occur shortly after the crossover. Delayed entries may result in missed gain potential or increased risk.
- Chasing the cross: It means entering a trade without considering other factors or confirming indicators. It's essential to avoid rushing into a trade solely based on the golden cross signal and to perform a comprehensive analysis.
- Ignoring the market context: Neglecting the broader market context, such as economic events, geopolitical factors, or market sentiment, can lead to poor trading decisions. The golden cross should be used in conjunction with an understanding of the overall market environment.
- Ignoring trade volume: Ignoring trade volume can be a mistake. A valid golden cross signal is often accompanied by increased trading volume, indicating strong market participation. Failing to consider volume can result in misguided trades.
- Curve fitting: Avoid the temptation to fit historical data to the golden cross strategy too precisely. Over-optimizing a trading strategy to past data may make it less effective in real-time trading situations. It's essential to balance historical performance with adaptability to current market conditions.
Top golden cross trading strategies
Mean reversion
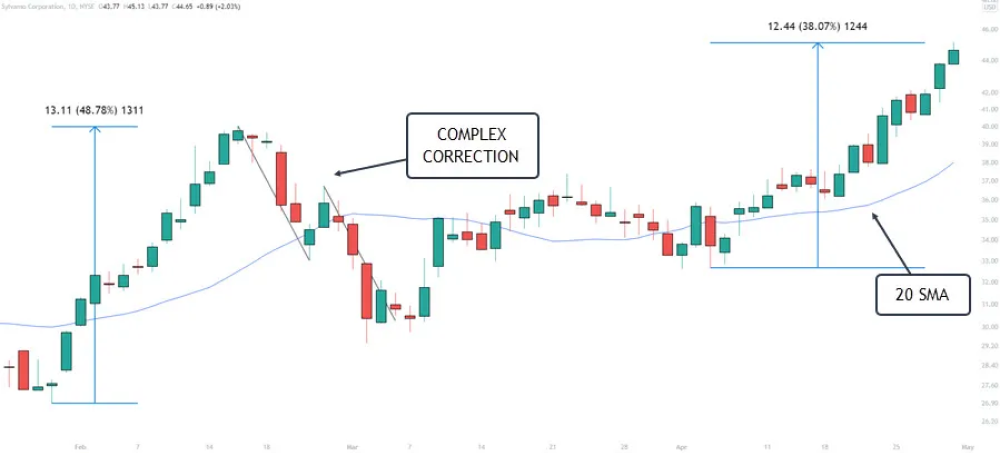
The mean reversion strategy takes advantage of the golden cross signal after a prolonged downtrend. It is based on the concept that prices tend to return to their historical average. When the 50-day SMA crosses above the 200-day SMA, it suggests that the downtrend may be losing momentum and a reversal might be underway. Traders using this strategy expect the price to return to its historical mean and enter long positions to gain from this reversion to the mean.
50 EMA carry
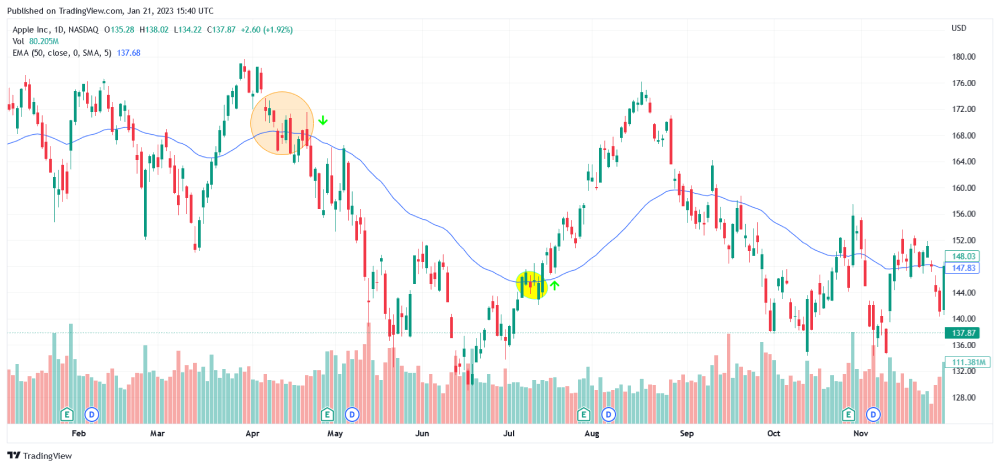
The 50 EMA carry strategy focuses on the 50-day exponential moving average (EMA) crossing above the 200-day SMA. Traders use the 50 EMA as a support level for their trades. The EMA gives more weight to recent price data, making it more responsive to changes and recent prices. As it crosses above the slower 200-day SMA, it confirms a bullish trend. Traders enter long positions and aim to carry them as long as the trend remains intact, using the 50 EMA as a reference point.
Double bottom
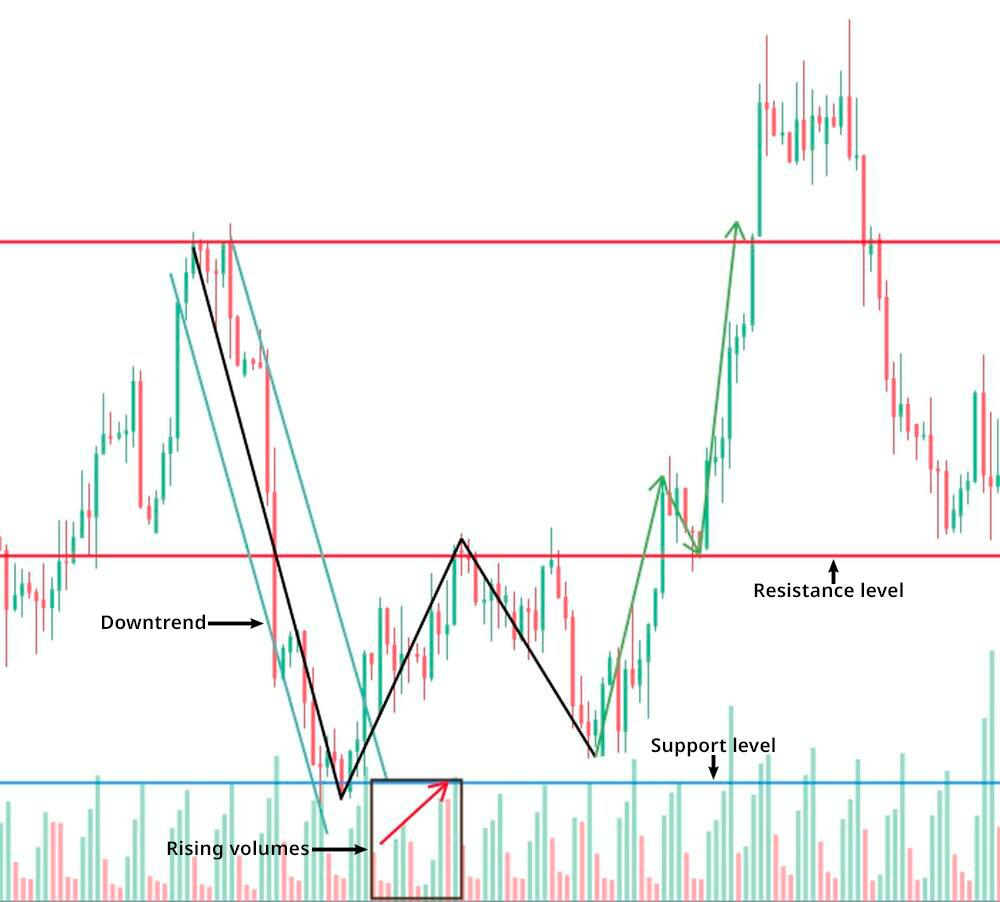
The double bottom is a bullish reversal pattern characterized by two distinct price troughs at roughly the same level. When this pattern is identified, and a golden cross occurs, it serves as a confirmation of the reversal. Traders take long positions, expecting the price to rise after the golden cross, in line with the double bottom pattern's bullish implication.
Pullbacks on 50 EMA
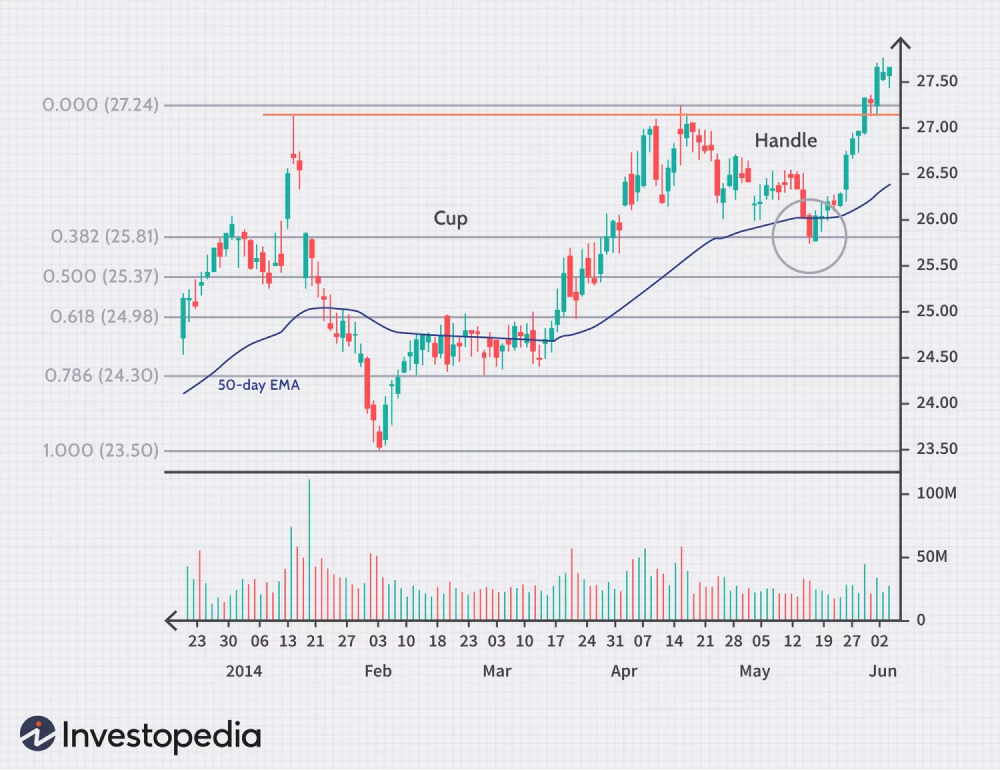
The pullback strategy leverages the 50-day EMA as a support level after a golden cross. Traders observe price pullbacks that touch or approach the 50 EMA. The 50 EMA is seen as a support zone, and when the price retraces to this level, traders consider it an opportunity to enter long positions. The pullback entry is in line with the prevailing uptrend indicated by the golden cross.
Oscillator confirmation strategy
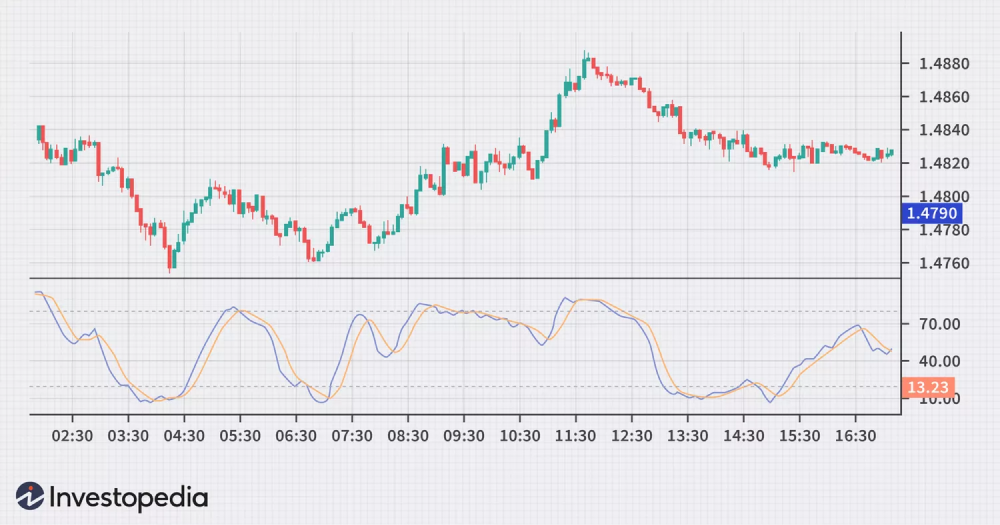
In this approach, traders combine the golden cross with technical oscillators like the relative strength index (RSI) or stochastic oscillator. After a golden cross is confirmed, traders use these oscillators to assess whether the market is overbought or oversold. If the oscillator indicates an overbought condition (when the currency pair price has risen too rapidly and is likely to see a reversal or correction soon), they may be cautious about entering a long position and vice versa. The oscillator serves as a secondary confirmation tool to improve trade timing.
How to trade forex with the golden cross?
1- Identify the golden cross: The first step is to recognize when a golden cross occurs. This happens when the 50-day simple moving average (SMA) crosses above the 200-day SMA as discussed above. This is the trader's primary signal for a potential trend reversal.
2- Look for bullish reversal patterns: To confirm the signal and find setups for long downtrends, search for bullish reversal patterns such as three white soldiers or bullish flag patterns that align with the golden cross. These patterns can provide additional confidence in the trend change.
3- Use line segments and trendlines: Apply technical analysis tools like line segments and trendlines to further support the trading decisions based on the golden cross. These tools help traders identify key levels, chart patterns, and trend directions that align with the crossover signal.
4- Find the double bottom: Combine the golden cross with a double bottom chart pattern. A double bottom is a bullish reversal pattern characterized by two price troughs at approximately the same level. When it coincides with a golden cross, it strengthens the signal for a shift from a bearish to a bullish trend.
5- Confirm with volume: Pay attention to trading volume. An increase in trading volume when the golden cross occurs can be a strong confirmation of the trend reversal. Higher volume suggests increased market participation and conviction in the new trend.
6- Set entry points: Determine the entry and exit points based on the risk tolerance and trading strategy. The golden cross marks the entry, while stop-loss orders can help manage potential losses.
7- Set stop-loss: To manage risk, traders often set stop-loss orders to limit potential losses. These levels are determined based on the trader's risk tolerance and market conditions.
6- Monitoring and exit: Traders continuously monitor the market after entering a position. If the market conditions change and the bullish sentiment weakens, they may exit the long trade and enter a short trade. This could happen if the 50-day SMA crosses below the 200-day SMA, indicating a bearish signal.
Navigating the forex market with golden cross trading
The golden cross indicator is advantageous as it helps in risk management and can also enhance trading strategies. However, it is not without risks, as it may produce false signals and is subject to market volatility. Traders should combine it with sound analysis and risk mitigation techniques for a well-rounded approach.
Disclaimer: All material published on our website is intended for informational purposes only and should not be considered personal advice or recommendation. As margin FX/CFDs are highly leveraged products, your gains and losses are magnified, and you could lose substantially more than your initial deposit. Investing in margin FX/CFDs does not give you any entitlements or rights to the underlying assets (e.g. the right to receive dividend payments). CFDs carry a high risk of investment loss.


