


Engulfing candlestick patterns act as a window into the market's psyche, revealing potential shifts in sentiment. They enable traders to anticipate potential trend reversals, adjust their positions, and potentially capitalize on new market directions before the price movement becomes too pronounced.
This article will cover all aspects of trading forex with the engulfing pattern.
What is an engulfing pattern?
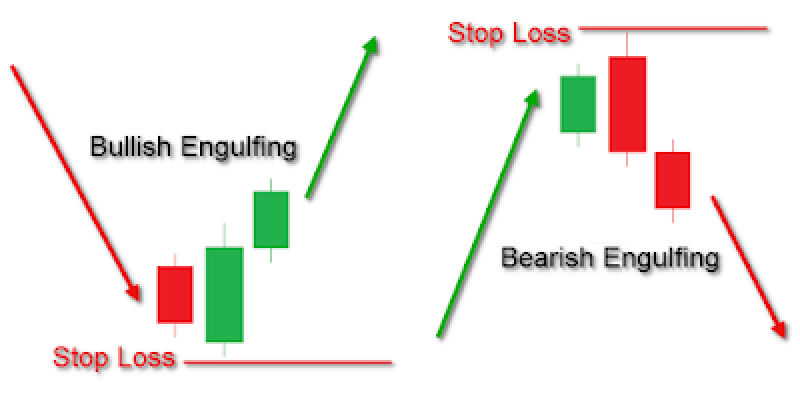
The engulfing candlestick pattern signals a potential trend reversal. It is a two-candlestick pattern:
- The first candle is a small candlestick, either red (bearish) or green (bullish).
- The second candle is a larger candlestick that completely engulfs the body of the first candle, meaning its price range covers the entire price range of the first candle.
The first and second candles indicate that the direction of the potential trend reversal depends on
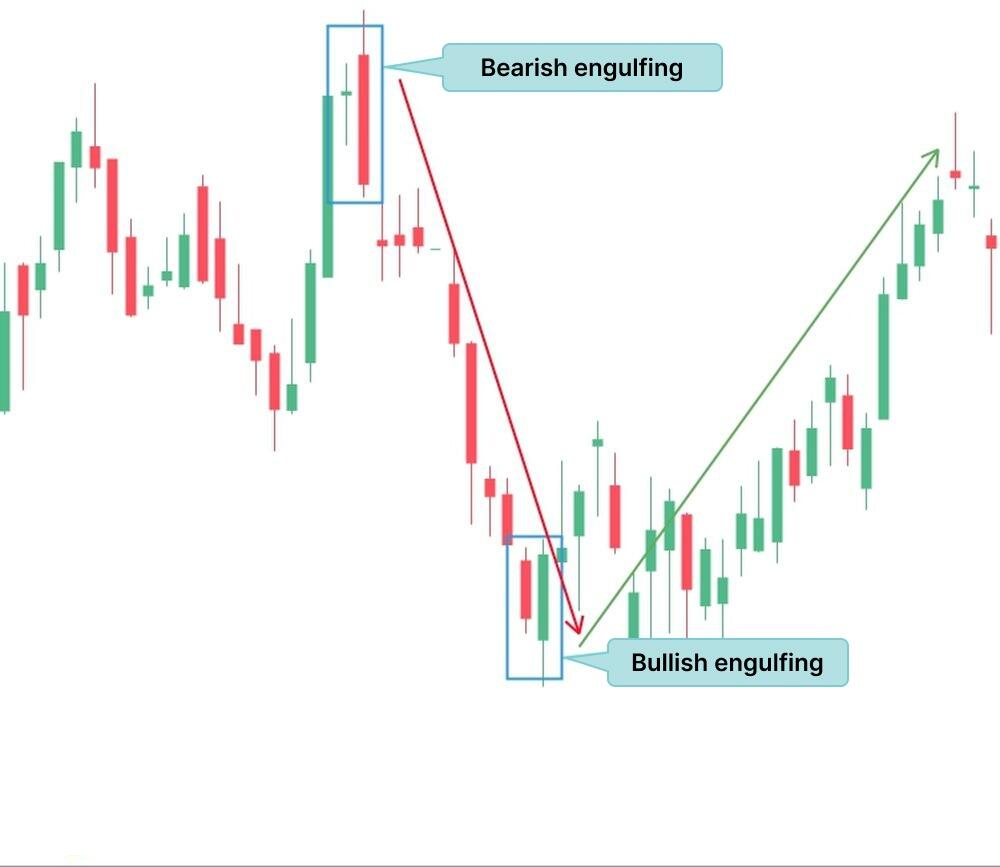
the color of the engulfing candle. Bullish engulfing candlestick patterns occur when a green engulfing candle follows a downtrend, suggesting a potential reversal to an uptrend. Meanwhile, bearish engulfing candlestick patterns occur when a red engulfing candle follows an uptrend, suggesting a potential reversal to a downtrend.
What is the bullish engulfing pattern?
The bullish engulfing candlestick pattern is an uptrend reversal signal and can be recognized in the following way:
- Downtrend: The pattern typically appears at the end of a downtrend, characterized by a series of lower highs and lower lows
- Small bearish candlestick: The first candle is a small red bearish candlestick, indicating continued exit pressure
- Engulfing green candle: The second candle is a larger green candlestick that completely engulfs the body of the first red candle. This signifies a surge in entry pressure, potentially overpowering the bears
- Shifting momentum: The engulfing patterns suggest a potential shift in market sentiment, with bulls gaining control after a downtrend
How to trade with the bullish engulfing patterns
Here are the steps to trade when the bullish engulfing pattern appears:
- Identify the downtrend
To find a bullish engulfing pattern, look for a clear downtrend in the forex pair one is interested in. This will be characterized by a series of lower highs and lower lows.
- Spot the engulfing pattern
Identify a small red candlestick, indicating continued exit pressure during the downtrend. Following the red candle, look for a larger green bullish engulfing candlestick that completely engulfs the body of the red candle. This signifies a surge in entry pressure.
- Confirmation
While engulfing candlestick patterns are a good starting point, confirmation is crucial to strengthen the signal. Look for increased volume in the chart patterns, which suggests more bears are entering the market, supporting the potential uptrend.
- Enter the trade
Confirmed bullish engulfing candlesticks can be a potential entry point for a long position in anticipation of a price increase. However, always prioritize risk management when it comes to bullish engulfing candlestick patterns by placing stop-loss orders below the low of the red candle to limit potential losses if the uptrend fails to materialize.
*This is an example only to enhance a consumer's understanding of the strategy being described above and is not to be taken as Blueberry. providing personal advice.
What is a bearish engulfing pattern?
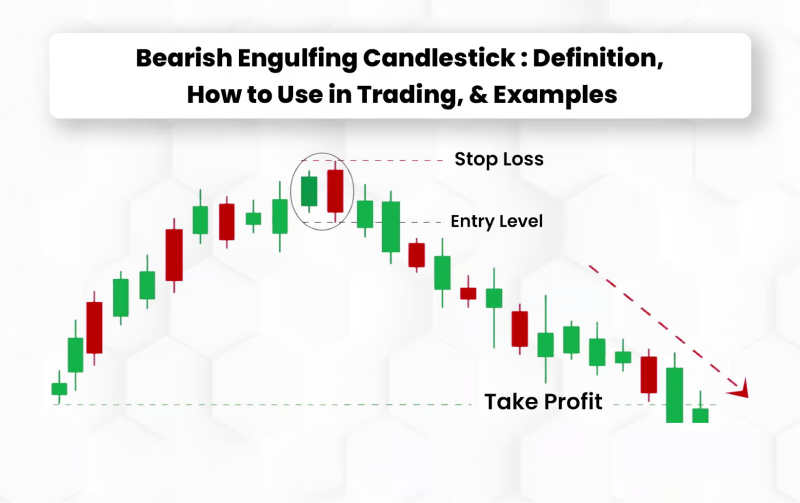
The bearish engulfing candlestick pattern is a downtrend reversal signal and can be recognized in the following way:
- Uptrend: Look for the pattern to appear at the end of an uptrend, characterized by a series of higher highs and higher lows
- Small bullish candlestick: The first candle is a small green bullish candlestick, indicating continued entry pressure
- Engulfing red candle: The second candle is a larger red engulfing candlestick that completely engulfs the body of the first green candle. This signifies a surge in exit pressure, potentially overpowering the bears
- Shifting momentum: The engulfing pattern as confirmed by the second candle suggests a potential shift in market sentiment, with bears gaining control after an uptrend
How to trade with a bullish engulfing pattern
- Identify the uptrend
Look for a clear uptrend in the forex pair one is interested in. This will be characterized by a series of higher highs and higher lows.
- Spot the engulfing pattern
Identify a small green candlestick, indicating continued entry pressure during the uptrend. Following the green candle, look for a larger red engulfing candlestick that completely engulfs the body of the green candle. This signifies a surge in exit pressure.
- Confirmation
While the engulfing candlestick pattern is a good starting point, confirmation is crucial to strengthen the signal. Look for a significant increase in trading volume on the engulfing red candle. This suggests that more bears are entering the market, supporting the potential downtrend.
- Potential entry point
A confirmed bearish engulfing pattern can be a potential entry point for a short position in anticipation of a price decline. However, prioritize risk management by placing a stop-loss order above the high of the red candle to limit potential losses if the downtrend fails to materialize.
*This is an example only to enhance a consumer's understanding of the strategy being described above and is not to be taken as Blueberry. providing personal advice.
Trading strategies for engulfing patterns
Classic engulfing pattern strategy
The classic engulfing pattern strategy involves identifying clear bullish or bearish engulfing patterns and trading them based on their immediate confirmation. It relies on entry, stop-loss, and take-profit rules.
- Identify the pattern: Look for a clear bearish or bullish engulfing pattern.
- Confirm the trend: Ensure the pattern appears after a well-defined trend (uptrend for bearish engulfing, downtrend for bullish engulfing).
- Entry point: Enter the trade at the opening of the next candle following the engulfing pattern.
- Stop-loss: Place a stop-loss just below the low of the bullish engulfing candle or above the high of the engulfing candle.
- Take-profit: Aim for a risk-reward ratio of at least 2:1 or set gain targets at previous support/resistance levels.
Volume confirmation strategy
The volume confirmation strategy improves the classic strategy approach by adding a volume confirmation step, ensuring that the bearish or bullish engulfing candle pattern is supported by strong market participation.
- Pattern identification: Spot the bullish or bearish engulfing pattern.
- Volume analysis: Ensure the engulfing candle has a significantly higher volume than the preceding candle, indicating strong market sentiment.
- Entry point: Enter the trade as soon as the bullish or bearish engulfing candlestick pattern is confirmed with high volume.
- Stop-loss and take-profit: Use the same stop-loss and take-profit strategies as the classic method.
Multi-timeframe analysis
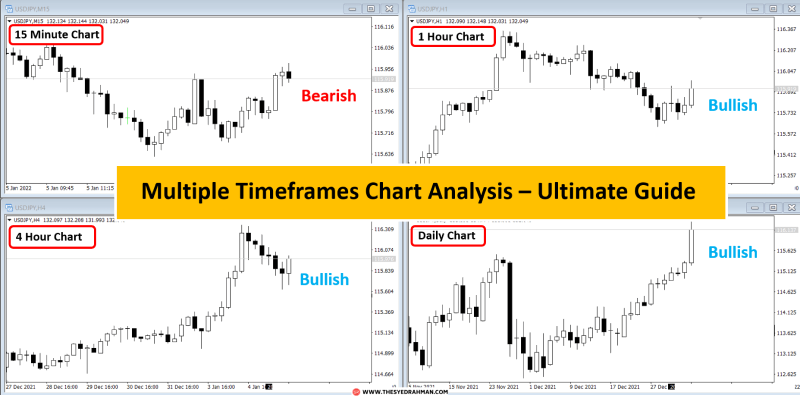
The multi-timeframe analysis strategy involves confirming the bullish or bearish engulfing patterns on a higher timeframe and using a lower time frame for precise entry points, improving the accuracy of trades.
- Identify on a higher time frame: Find bearish or bullish engulfing patterns on a higher time frame (such as daily or weekly chart patterns).
- Confirm on lower time frame: Move to a lower time frame (such as hourly chart patterns) to find a suitable entry point.
- Entry point: Enter the trade when the lower time frame confirms the direction of the higher time frame engulfing pattern.
- Stop-loss and take-profit: Use appropriate stop-loss and take-profit levels based on lower time frame analysis.
Engulfing pattern with support and resistance
The support and resistance strategy for engulfing patterns focuses on finding bullish and bearish engulfing patterns near support and resistance levels, providing additional confirmation and potential trade opportunities.
- Identify key levels: Mark the chart's significant support and resistance levels.
- Find engulfing patterns: Look for bullish (or bearish) engulfing patterns forming near support (or resistance) levels.
- Entry point: Enter the trade when the bullish (or bearish) engulfing pattern is confirmed at a support (or resistance) level.
- Stop-loss and take-profit: Place a stop-loss order just below (or above) the support (or resistance) level and set gain targets at the next significant resistance (or support) level for the bullish (or bearish) engulfing pattern.
Trendline and engulfing pattern
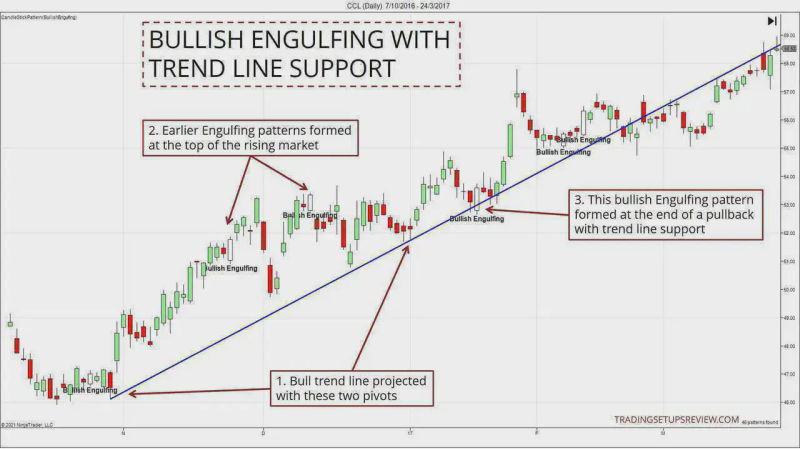
The trendline strategy combines trendline analysis with bearish or bullish engulfing patterns to identify trades that align with the overall trend direction, increasing the likelihood of accurate trades.
- Draw trend lines: Draw trend lines connecting significant lows (or highs), showing the upward (or downward) trend.
- Spot engulfing candlestick patterns: Identify bullish (or bearish) engulfing candle patterns that form near the upward (or downward) trendline.
- Entry point: Enter the trade when the bullish (or bearish) engulfing pattern confirms a bounce off the upward (or downward) trendline.
- Stop-loss and take-profit: Set a stop-loss just below (or above) the trendline for a bullish (or bearish) pattern and take-profit at the next significant resistance (or support) level or trendline.
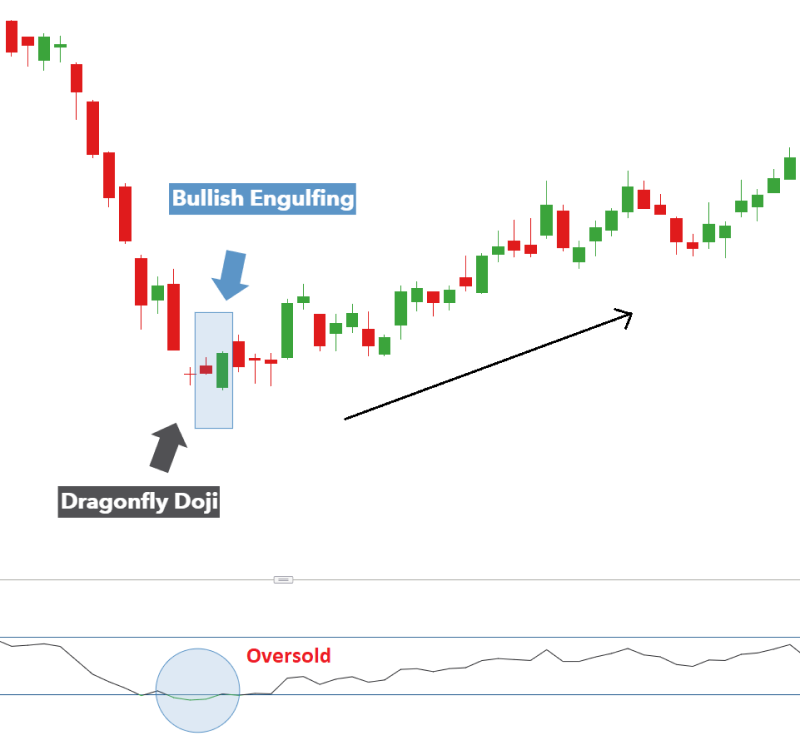
Combine with RSI
This strategy uses technical indicators such as the Relative Strength Index (RSI), to confirm overbought or oversold conditions when an engulfing pattern forms, adding an extra layer of trade validation.
Use the RSI to identify overbought conditions (above 70) for bearish patterns or oversold conditions (below 30) for bullish patterns.
- Find engulfing patterns: Look for bullish (or bearish) engulfing patterns that coincide with oversold (or overbought) RSI conditions.
- Entry point: Enter the trade when the pattern aligns with RSI signals (bullish pattern with oversold RSI, bearish pattern with overbought RSI).
- Stop-loss and take-profit: Place stop-loss orders below (or above) the low (or high) of the bullish (or bearish) engulfing pattern and aim to gain targets at significant resistance (or support) levels.
Reliability and accuracy of engulfing patterns
The success rate of engulfing patterns
Engulfing patterns offer a decent success rate, typically hovering around 63%. This positions them as relatively reliable two engulfing candlestick reversal patterns. They can be a good starting point for identifying potential market trend shifts.
However, there exist some limitations to using the engulfing patterns, such as:
- False signals: Engulfing patterns can sometimes occur due to market noise rather than a genuine reversal pattern, leading to false signals
- Misinterpretation: Engulfing patterns are most reliable in the context of an existing market trend. In ranging or sideways markets, their reliability decreases. Hence, candlestick patterns can be misinterpreted if not viewed in the broader context of the market's overall market conditions and sentiment
- Pattern dependency: Relying exclusively on engulfing patterns without integrating other technical analysis methods can limit a trader's effectiveness and increase risk
- Confirmation bias: Traders might see candlestick patterns that confirm their pre-existing beliefs or expectations, leading to biased decision-making
Real-life examples of bullish and bearish engulfing patterns
Bullish engulfing patterns example
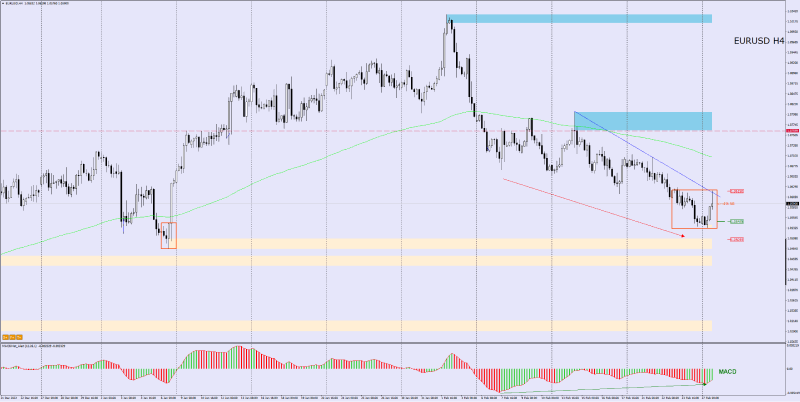
The daily chart showed a bullish engulfing pattern for EUR/USD, with the current price within the formation. This suggests a possible trend two-candle reversal pattern from bearish to bullish.
- Traders should wait for a breakout from the engulfing pattern for confirmation. Additionally, the MACD needs to overcome 1.0620 to signal a bullish trend
- The price bounced off a trendline (resistance zone), which coincides with the maximum point of the engulfing pattern. This creates a strong confluence of resistance
Trading options:
- Breakout purchase: A break above 1.0620 on both the price chart and the MACD would be a strong signal for a long position
- Upward trend divergence: The rising MACD suggests a potential upward trend breakout, even though the price might test the demand zone at 1.0505 before continuing its climb
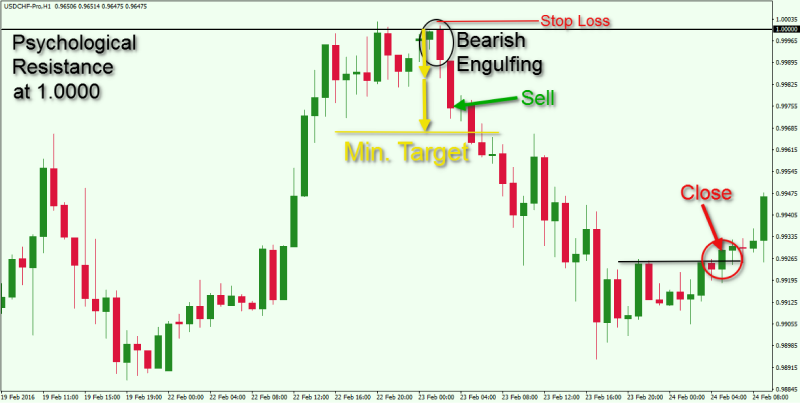
Bearish engulfing pattern example
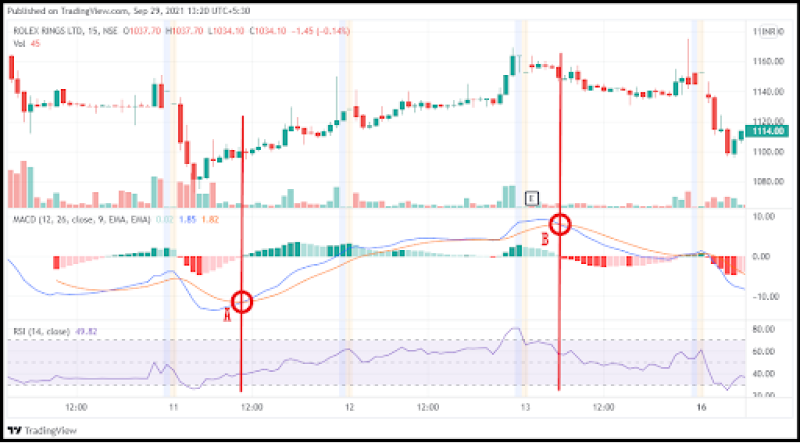
Let's consider an example of a bearish engulfing pattern formed on the NZD/USD daily chart pattern at a swing high. This engulfing candle's range surrounds the previous candle. This setup offers high-probability trades with good risk-reward ratios (such as three times the risk for a 2% risk). These trades can be quick, taking only around 12 hours.
Here's the 3-step confirmation process for this chart:
- Engulfing pattern: Identify an engulfing candlestick at a swing high.
- Broken support: Ensure the engulfing candlestick breaks below a critical support level.
- Optional confirmation: Look for bearish price action (like a pin bar) when the broken level is retested as new resistance for additional confirmation.
While less probable, entering at a specific price without confirmation (blind entry) on a 50% retracement of the engulfing candlestick can be gainful. However, be aware that blind entries lack confirmation and thus are riskier.
Importance of engulfing patterns in trading
Price action confirmation
Engulfing patterns themselves can sometimes offer confirmation through price action. For instance, a bullish engulfing candlestick pattern followed by a continuation higher with limited retracement (small candles or wicks) strengthens the bullish signal and vice versa. Recognizing these price action confirmations within the engulfing pattern itself can further enhance the trader's confidence in the reversal pattern.
Sentiment shifts
Engulfing patterns are like market mood swings. A large green (bullish) or red (bearish) candle swallowing a smaller one indicates a surge in entry or exit pressure, potentially overpowering the prior trend.
Early warning system
Engulfing patterns can emerge at the early stages of a potential trend reversal pattern, offering traders a chance to capitalize on a shift in market momentum before the price movement becomes too pronounced. This early warning function allows for potentially more gainful entry points into trades aligned with the new trend direction.
Key takeaways on mastering engulfing patterns
Engulfing candlestick patterns stands out as a cornerstone of technical analysis in forex trading. These formations offer valuable insights into shifting market sentiment and the potential for trend reversals. By understanding their formation and incorporating confirmation techniques, traders can leverage engulfing patterns to identify high-probability trading opportunities and enhance the overall effectiveness of their strategies.
Disclaimer: All material published on our website is intended for informational purposes only and should not be considered personal advice or recommendation. As margin FX/CFDs are highly leveraged products, your gains and losses are magnified, and you could lose substantially more than your initial deposit. Investing in margin FX/CFDs does not give you any entitlements or rights to the underlying assets (e.g. the right to receive dividend payments). CFDs carry a high risk of investment loss.