


Technical indicators for swing trading help navigate the market trends and analyze price movements. They can suggest entry, exit, and stop-loss points, helping swing traders capitalize on opportunities.
In this article, we will discuss the top indicators traders can use for swing trading.
What is swing trading?
Swing trading involves holding positions for days to weeks to gain from short-term price movements in a currency pair’s price. It is a trading style that sits medium-term traders who want to trade between day trading (where positions are held for hours or minutes) and long-term investing (where positions are held for months or years).
Top indicators to use with swing trading
Moving averages
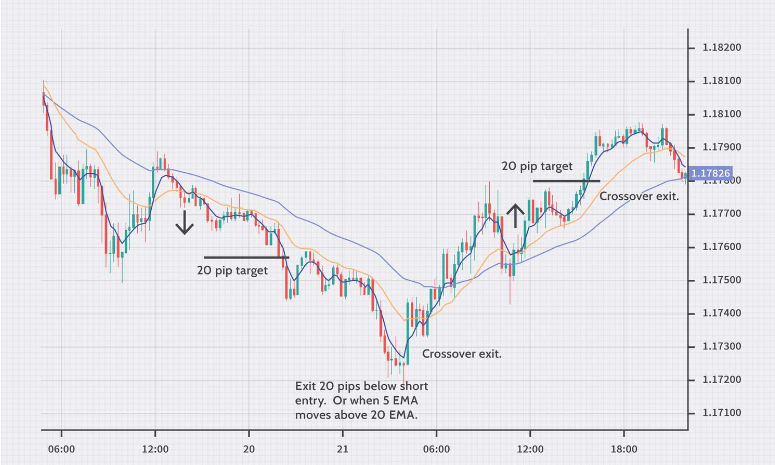
Moving averages are a technical indicator in which the average price of a currency pair is calculated over a specific period (such as 50-day MA). A rising MA indicates an uptrend, while a falling MA suggests a downtrend.
MAs help swing traders identify the underlying trend and avoid whipsaws (false signals) by smoothing out price fluctuations. This allows swing traders to position themselves for sustained price movements.
To use moving averages in swing trading, identify the overall trend. Enter a long order when the price breaks above a rising MA and exit it when the price falls below it. Short trades can be initiated when the price falls below a falling MA. Stop-loss can be placed below the MA for long trades and above the MA for short trades, or a set distance away based on volatility.
Relative strength index (RSI)
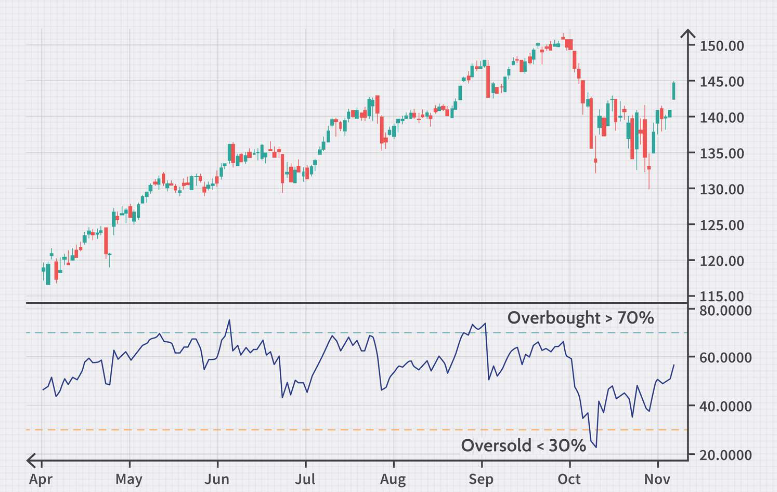
RSI measures the magnitude of recent price changes to identify overbought (above 70) or oversold (below 30) conditions. It helps swing traders identify potential entry points during trend continuations. Oversold readings (below 30) can signal long opportunities in an uptrend, while overbought readings (above 70) can signal potential shorting opportunities in a downtrend. However, RSI shouldn't be used alone to confirm a trend reversal.
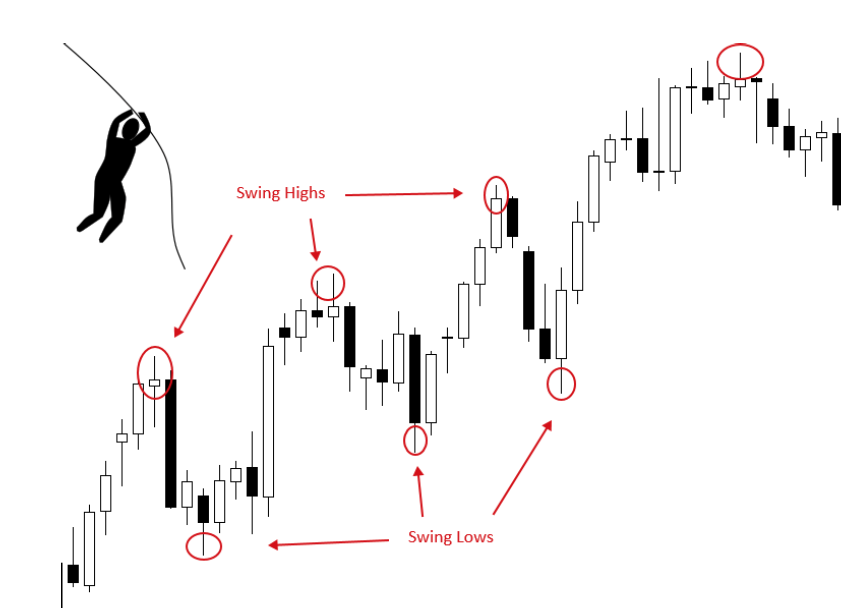
In swing trading, traders can enter a long order when the RSI dips below 30 (oversold signal), suggesting a potential trend reversal. Conversely, they can exit a long order or initiate short trades when RSI climbs above 70 (overbought signal). Stop-loss can be placed below the swing low for long trades and above the swing high for short trades.
Moving average convergence divergence (MACD)
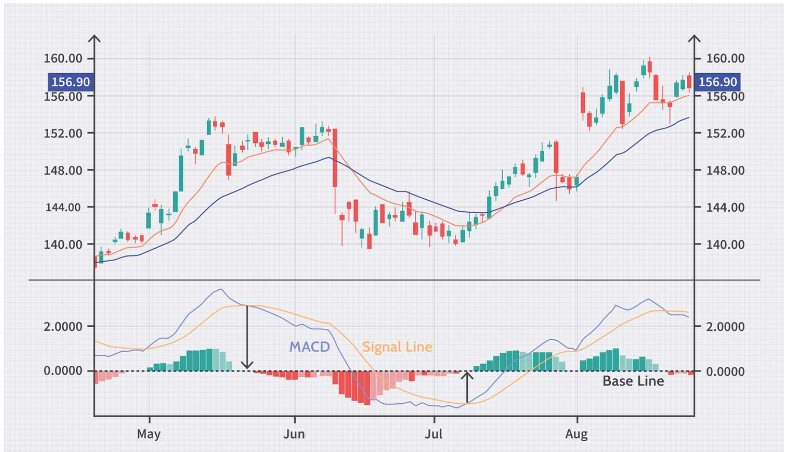
MACD compares two moving averages to identify trend strength and potential reversals. A long signal occurs when the MACD line (fast MA - slow MA) crosses above the signal line (slow MA of the MACD line). Conversely, a short signal occurs when the MACD line crosses below the signal line.
MACD helps swing traders identify confirmations of trends and potential trend reversals. A crossover above the signal line during an uptrend or below the signal line during a downtrend strengthens the trend's validity. Divergences between MACD and price action (price keeps rising while MACD falls) can indicate a potential trend reversal but require further confirmation.
Enter a long order when the MACD line crosses above the signal line, confirming an uptrend. Exit a long order or initiate a short order when the MACD line crosses below the signal line, suggesting a downtrend reversal. Stop-loss can be placed below the recent swing low for longs and above the recent swing high for shorts.
Bollinger bands
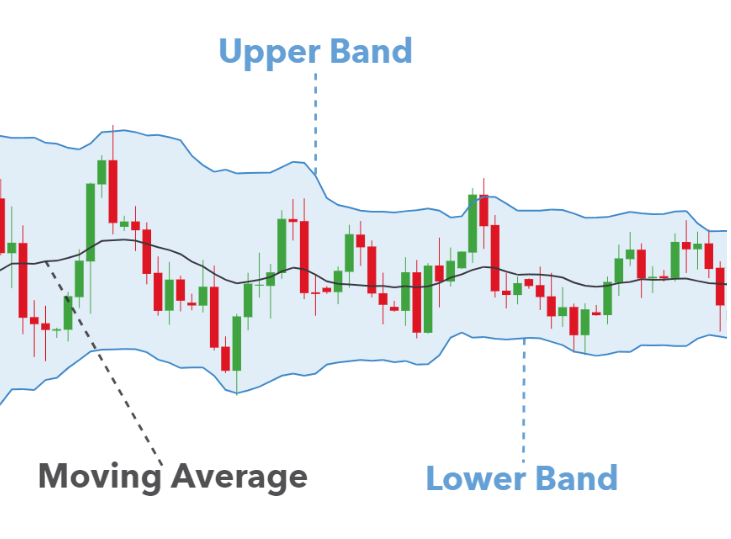
Bollinger bands are volatility bands around a moving average (typically 20-day MA). They can help swing traders identify potential entry and exit points based on volatility. When the Bollinger Bands contract, it suggests low volatility and a potential breakout in either direction. Conversely, expanding Bollinger Bands indicate higher volatility and swing traders may choose to exit their positions or wait for a clearer sign of direction before entering a new trade.
While swing trading, traders can place a long order near the lower Bollinger Band (potential entry pressure) during a downtrend. Conversely, they can exit long orders or initiate short orders near the upper Bollinger Band (potential exit pressure) during an uptrend. Stop-loss can be placed below the lower Bollinger Band for longs and above the upper Bollinger Band for shorts.
Stochastic oscillator
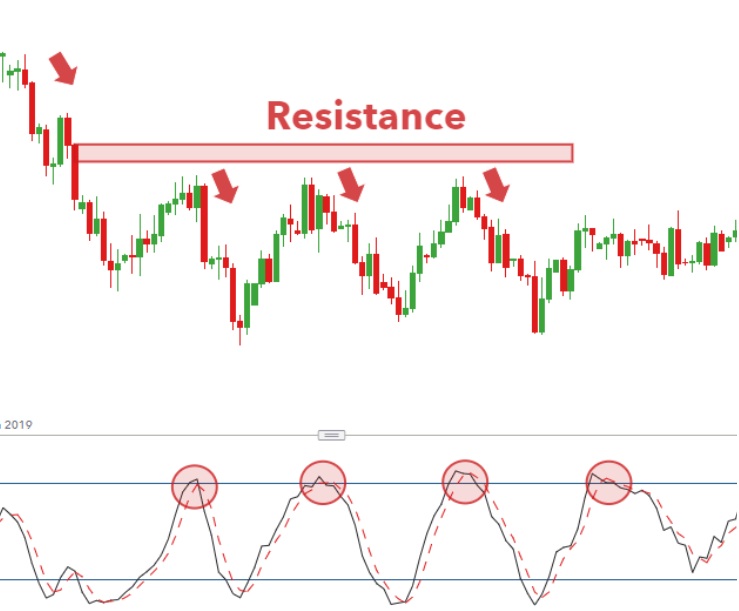
Stochastic oscillator measures the relationship between a currency pair’s closing price and its price range over a specific period. It fluctuates between 0 and 100, with readings below 20 indicating oversold and readings above 80 indicating overbought conditions. Similar to RSI, it helps swing traders identify potential entry points during trend continuations.
Traders can enter a long trade when the stochastic oscillator dips below 20 (oversold signal) during an uptrend, suggesting the uptrend might have room to continue. Conversely, exit a long trade or initiate a short trade when the stochastic oscillator climbs above 80 (overbought signal) during a downtrend, but look for confirmation from price action or other indicators before entering a short position. Stop-loss can be placed below the swing low for long trades and above the swing high for short trades.
Fibonacci retracement levels
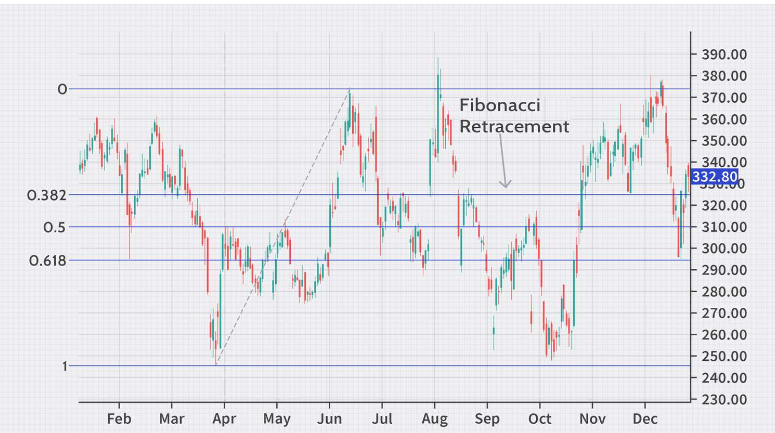
Derived from the Fibonacci sequence, Fibonacci retracement levels (23.6%, 38.2%, 50%, and 61.8%) indicate potential support and resistance zones after a strong price move. These levels help swing traders identify potential entry and exit points based on retracements after a trend.
During an uptrend, these levels can indicate areas where the price might pull back before continuing upwards. Conversely, during a downtrend, they can indicate potential bounces before the downtrend resumes.
Enter a long order near these retracement levels during an uptrend, anticipating the uptrend to resume and vice versa. Stop-loss can be placed below the entry for longs and above the entry for shorts, or a set distance away based on volatility and the chosen Fibonacci level.
On-balance volume (OBV)
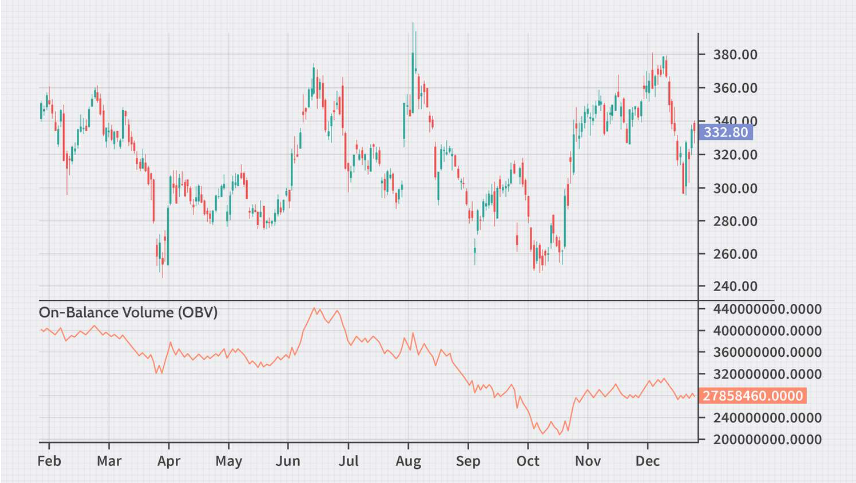
OBV is an accumulation/distribution indicator that tracks volume changes to suggest entry or exit pressure. Rising OBV suggests long pressure while falling OBV suggests short pressure. OBV can help swing traders gauge trading pressures behind a price move, potentially confirming trend continuations or reversals.
During swing trading, traders can look for rising OBV alongside rising prices to confirm the strength of an uptrend. Conversely, look for falling OBV alongside falling prices to confirm a downtrend.
Combine technical indicators while swing trading
In conclusion, while swing trading indicators offer valuable insights, traders must be aware of the challenges and risks involved. Market volatility can lead to unexpected price swings, and relying on a single indicator may result in false signals. Combining multiple indicators can mitigate some risks but also requires skill and experience. Additionally, emotional biases and rapid market changes can impact decision-making.
Traders need to stay vigilant, continuously learn, and adapt their strategies to manage these risks effectively and maintain consistent profitability.
Disclaimer: All material published on our website is intended for informational purposes only and should not be considered personal advice or recommendation. As margin FX/CFDs are highly leveraged products, your gains and losses are magnified, and you could lose substantially more than your initial deposit. Investing in margin FX/CFDs does not give you any entitlements or rights to the underlying assets (e.g. the right to receive dividend payments). CFDs carry a high risk of investment loss.