


To trade or to fade? USDCAD under the spotlight! Dive into today's analysis as we dissect the market dynamics, from breached resistance to looming central bank decisions. Stay ahead with our fundamental and technical insights!
#ForexTrading #USDCAD #MarketAnalysis #FundamentalAnalysis #TechnicalAnalysis
Watch the video to learn more...
USDCAD TRADE OR FADE?
In today's analysis I take a look at the loonie or USDCAD.
This market first came onto my radar after the price breached the 1.3600 handle, a level that had been held as resistance since November of last year.
After the price traded above the resistance, I witnessed a sharp rally in price towards the October 2023 highs of 1.3875.
Fundamentally this week we have releases from both countries but arguably the market will be focused on the US data.
The Federal Reserve is forecast to hold interest rates at 5.50% on Wednesday, but what is the market looking for?
The talk of cuts seems to be off the table considering the inflation rate remains sticky at 3.5% and a labor market that seems to be growing.
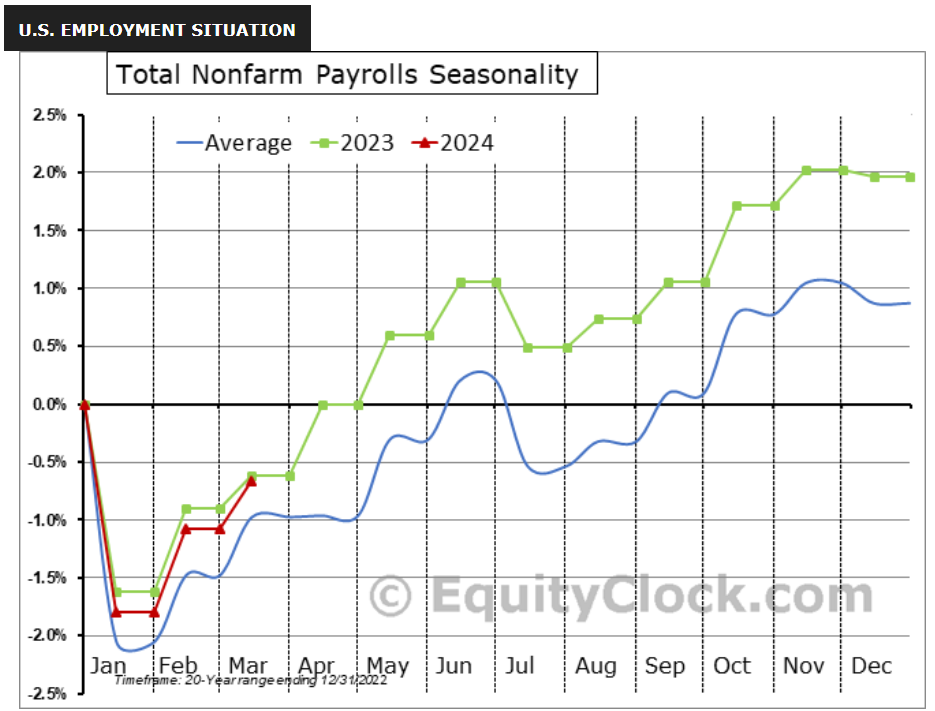
An interesting chart I found shows the seasonality of the Non-Farm Payrolls over the last 20 years with the overlay of 2024 numbers so far. The data seems to be following the seasonals very closely, which could suggest further job growth to come.
What the market is trying to price in now, is the risk of further hikes. If the Federal Reserve moves again, what does that mean for markets? USD strength and Stocks down?
This is why USDCAD appeals to me currently.
In Canada there have been talks of cuts from the central bank, perhaps to try and front run cuts from the Fed.
The unemployment rate in Canada rose to 6.1%, combining this with low GDP figures and a steady inflation rate below the 3% level, a move to cut is closer than many other central banks.
The only risk to CAD shorts is the rising Oil prices, but this seems to have retreated over the past three weeks.
Moving to the charts and the swing trading strategy, in order for our fundamental bias to be met, we need the technical outlook to match.
As of writing this, the USDCAD price on the Daily (D1) chart is in a secondary phase, meaning it is going against the current bullish trend.
This is the same for the H4 chart too, which I would like to see reverse before applying the trend strategy.
If the price can trade above the current H4 highs of 1.3700, we can look to apply the strategy using the 50 and 200 EMA's combined with the Stochastic Oscillator.
USDCAD
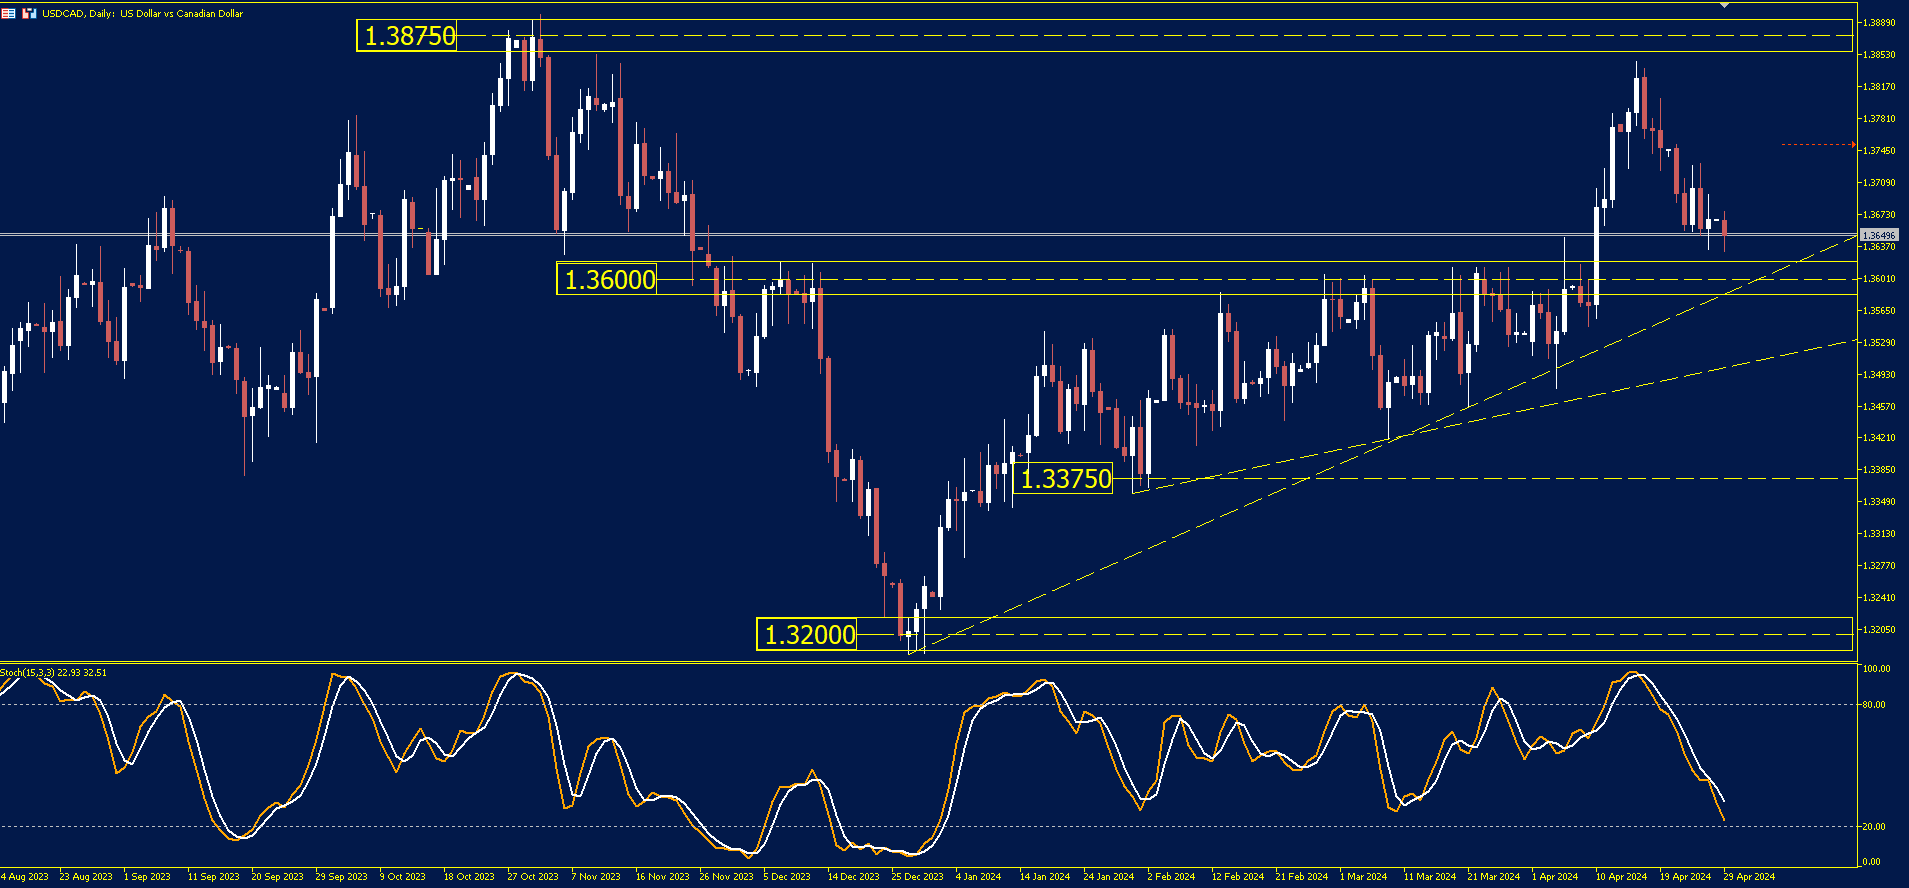
The price on the chart has traded through multiple technical levels and some observations included:
- The price of USDCAD could be a mover this week considering the data ahead. Price is currently trading towards the key 1.3600 level of support.
- If the H4 downward trend were to break we could see an opportunity for the price to trade higher.
Have you watched our latest video update? You can see it here.
Enjoy low spreads and quick trade executions with a live account. Our highly committed customer support team will assist you with your quick account setup for any future concerns. Start trading with Blueberry.
Disclaimer: All material published on our website is intended for informational purposes only and should not be considered personal advice or recommendation. As margin FX/CFDs are highly leveraged products, your gains and losses are magnified, and you could lose substantially more than your initial deposit. Investing in margin FX/CFDs does not give you any entitlements or rights to the underlying assets (e.g. the right to receive dividend payments). CFDs carry a high risk of investment loss.