The Simple Moving Average (SMA) cuts through forex market noise by averaging past closing prices. It smooths the chart, revealing the underlying trend. This helps traders identify potential opportunities by aligning their trades with the trend's direction and gauging support/resistance zones.
In this article, we will discuss the simple moving average in depth.
What is a moving average?
A Moving Average (MA) is a technical analysis tool that calculates the average of the forex prices in a specific time period. It removes short-term fluctuations in the price, making it easier to identify the general trend direction (upward, downward, or sideways).

How to calculate the Simple Moving Average (SMA)
There are different ways to calculate moving averages, but the most common is the simple moving average (SMA). It simply adds up the closing price for a chosen number of periods (days, weeks, months) and divides by that number.
The formula for the SMA is:
SMA (n) = Σ (Price_i) / n
SMA vs. Exponential Moving Average (EMA)
Both Simple Moving Averages (SMAs) and Exponential Moving Average (EMA) are technical analysis tools used to smooth price data and identify trends. However, they differ in how they weigh past closing prices.
Weighting of prices
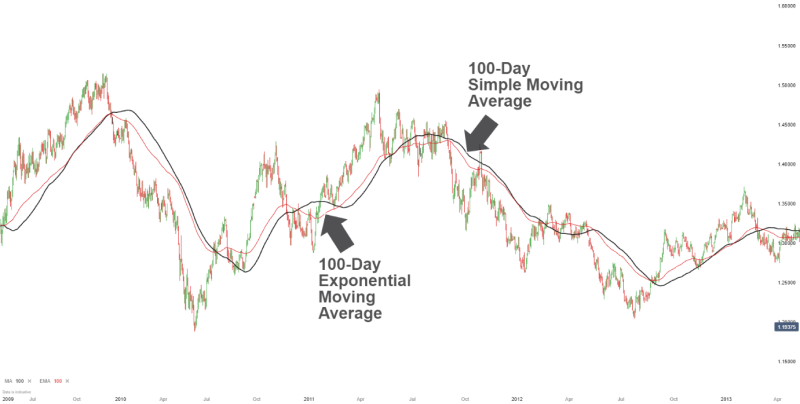
A simple moving average assigns equal weight to all closing prices within the chosen period (n). Each price point has the same influence on the average. Whereas, EMA are weighted moving averages that assign greater weight to more recent closing prices. It reacts more quickly to recent price changes compared to the SMA.
Impact on responsiveness
SMA responds slowly to price changes due to the equal weighting of all prices within the period. This helps in identifying long-term trends but may miss out on capturing short-term fluctuations. On the other hand, EMA responds faster to price changes due to the higher weight given to recent prices. This makes it more suitable for identifying short-term trends and reacting to recent market movements.
Visual representation
SMA is a smoother line on the chart, reflecting the equal weighting of prices and lagging behind average price movements. Whereas, EMA can be a more volatile line on the chart, reflecting its quicker reaction to recent price changes and potentially showing more volatility.

How to use the SMA in trading
1. Identifying trend direction
With the help of an SMA, traders can smooth out price data of any market noise to get to the actual market trend. A rising SMA signals an uptrend and vice versa.
2. Generating entry and exit signals
When a forex pair price crosses beyond the SMA, it suggests a strong uptrend and signals a long opportunity for traders. Whereas, when a forex pair price moves below the SMA, it suggests a strong downtrend and signals a short opportunity. Traders can exit their positions when the forex pair price crosses the SMA in the opposite direction of the current trend.
3. Spotting support and resistance levels
The SMA line also acts as the support line during a persisting uptrend and resistance line during a persisting downtrend. Traders can place entry/exit orders based on how close the forex pair price is to these levels. If the price is near the support level, traders can enter a long trade due to an expected bullish reversal and vice versa.
4. Confirming trend reversals
When the SMA changes direction and other indicators like a moving average convergence divergence indicator confirms the change in direction, it signals an uptrend reversal during a persisting bearish market and vice versa.
5. Smoothing price data
Since the SMA is the average price of all the prices in a particular time period, it smooths out price fluctuations by removing any unnecessary market noise. It highlights the broader market trend, helping traders make decisions.
6. Analyzing moving average crossovers
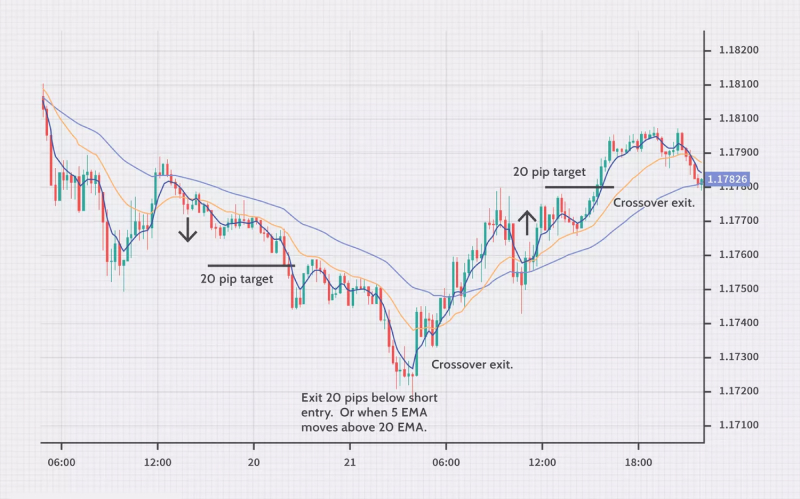
Crossovers between the SMA and other moving averages generate trading signals.
- A golden cross is when a short-term SMA crosses above a long-term SMA and suggests a bullish trend, signaling traders to place long orders
- A death cross is when a short-term SMA crosses below a long-term SMA and suggests a bearish trend, signaling traders to place short orders
7. Setting stop-loss and take-profit levels
Traders can place stop-loss orders right below the simple moving average when the prices are in an uptrend and right above the simple moving average when the prices are in a downtrend. Take-profit levels can also be placed based on the particular price targets that traders set relative to the SMA.
8. Evaluating market volatility
Market volatility in forex can be assessed by calculating the distance between the forex pair price and the simple moving average. A broad gap suggests high volatility in the market signaling traders to hold onto their trades, while a narrow gap suggests lower volatility. During lower volatility, traders can place long orders in an uptrend and short orders in a downtrend with a market continuation expectation.
Identifying trends with the SMA
Smoothing out the noise
The SMA smooths short-term price fluctuations by averaging prices over a specific timeframe. Daily market noises are filtered and traders gain a better picture about the underlying market trend. The smoothing effect reduces the chance of making decisions on erratic price spikes and drops, and focuses more on decisions based on averaged prices.
Upward or downward slope
The slope of the SMA helps assess the trend direction.
- An upward slope signals that prices are continuously rising and there is a continued upturned
- A downward slope signals that prices are continuously falling and there is a continued downtrend
When traders observe the angle of the simple moving average line, they are able to understand the strength of the trend and place market orders accordingly. Steeper slopes signal stronger trends whereas flatter slopes signal weaker trends.
Multiple timeframes
Traders can analyze SMA across multiple timeframes to get a broader context of the prevailing market trend. A short-term SMA suggests recent price movement insights whereas a long-term SMA provides information about the overall market. Comparing SMAs of different periods helps traders identify trend continuations and reversals.
Limitations of the SMA
- SMA is a lagging indicator. It reacts to past price movements rather than predicting the future. This means it might not capture the very beginning or end of a trend perfectly
- It smooths data, sometimes masking important short-term fluctuations that could signal turning points
- The chosen timeframe for the simple moving average can significantly impact the trend it suggests. A shorter simple moving average might be overly reactive to short-term noise, while a longer SMA might be too slow to capture recent trend shifts
Combining SMA with other technical indicators
The SMA excels at revealing the dominant trend by filtering out short-term noise. However, SMA's focus on smoothing data might cause traders to miss out on early trend reversals or short-term opportunities within a larger trend. Hence, traders must combine simple moving averages with other price action technical analysis and fundamental analysis.
Disclaimer: All material published on our website is intended for informational purposes only and should not be considered personal advice or recommendation. As margin FX/CFDs are highly leveraged products, your gains and losses are magnified, and you could lose substantially more than your initial deposit. Investing in margin FX/CFDs does not give you any entitlements or rights to the underlying assets (e.g. the right to receive dividend payments). CFDs carry a high risk of investment loss.


