


MT5 offers extensive flexibility for technical analysis, allowing traders to open up to 100 charts simultaneously. These charts are fully customizable. Traders can adjust the chart's appearance, display specific information, and easily add or remove indicators to suit their strategy.
Let's discuss everything about charting on MT5.
What are the charts in MetaTrader 5?
Charts are visual representations of financial instruments that display historical price movements.
They help analyze market trends, identify trading opportunities, and execute technical analysis. MT5 provides various timeframes for chart analysis ranging from very short intervals (like 1-minute, 30-minute charts, and more) to longer-term views (like monthly charts and more).
Types of charts in MetaTrader 5
Broken line chart
The broken line chart in MetaTrader 5 is one of the most basic chart types available. It is ideal for traders who want to visualize the overall trend of a market without being distracted by granular price movements.
This chart type plots only the closing prices of an asset over a specified period and connects these points with a continuous line. The broken line chart is particularly beneficial for understanding broad market trends, as it smooths out the day-to-day fluctuations that can sometimes distract traders.
The simplicity of this chart makes it easy to spot the direction of price movement, whether upward or downward, without the complexity of additional data points like the open, high, and low prices. While it may not offer as much detailed information as other chart types, it is useful for traders more interested in identifying general trends rather than precise price action.
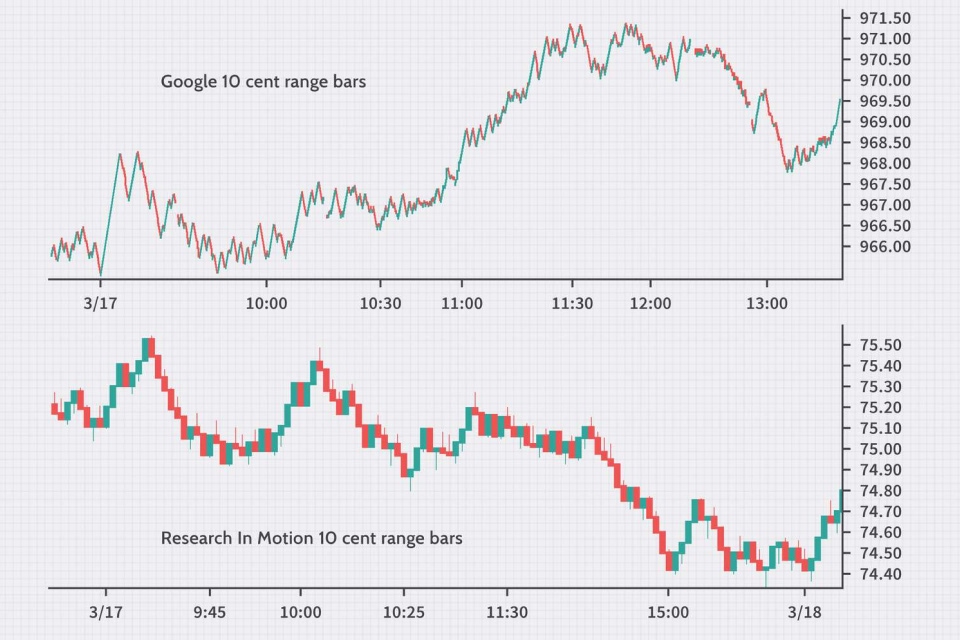
Sequence of bars (bar chart)
The sequence of bars, or bar chart, provides a more detailed view of price movement compared to the broken line chart. Each bar in the chart represents a time period, such as a minute, an hour, or a day, and contains information about the open, high, low, and close prices (OHLC).
The vertical line of the bar represents the high and low range for the period, while the horizontal ticks on the left and right indicate the open and close prices. This format is useful for traders who need to see more than just the closing price, as it shows how the price moved within the timeframe and how much volatility occurred.
The bar chart lets traders quickly assess price fluctuations and spot potential reversals or trends. Technical analysts, who rely on these movements to identify trading signals and decide on price action, favor it.
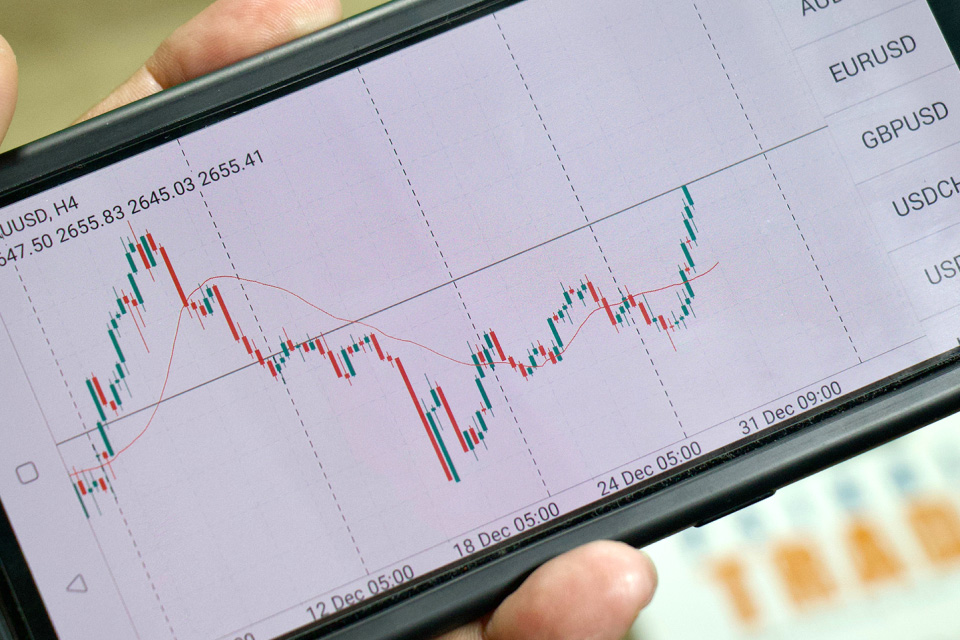
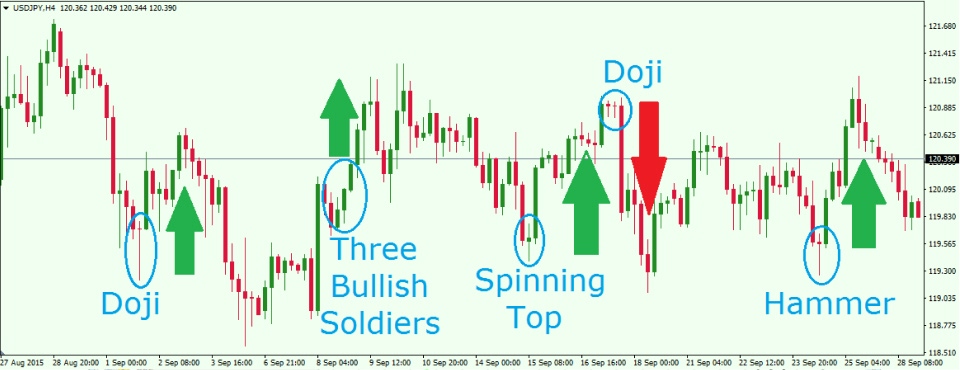
Japanese candlesticks
Japanese candlestick charts are among the most visually informative chart types in MetaTrader 5. Each candlestick represents a specific time period and consists of a body and two wicks (or shadows).
The body of the candlestick refers to the range between the opening and closing prices, while the wicks show the highest and lowest prices during that period. The candlestick's color helps one understand whether the price closed higher or lower than it opened – a light color (usually green or white) signifies a bullish move, and a dark color (red or black) indicates a bearish move.
Candlestick charts are highly valued for their ability to communicate market sentiment quickly. The shape and size of the candlesticks can reveal whether bulls or bears are in control of the market. In addition, various candlestick patterns, such as doji, engulfing, and hammer, can signal potential trend reversals or continuation. This makes candlestick charts essential for traders who base their strategies on price action and pattern recognition.
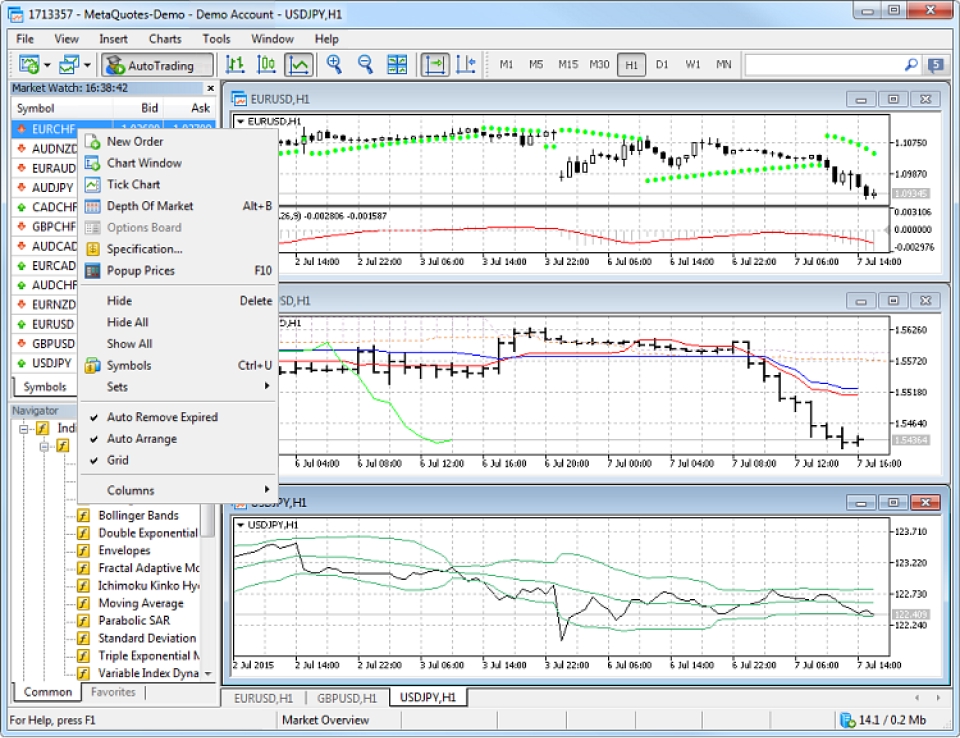
Creating a chart in MetaTrader 5 in 6 steps
1. Open, view, set timeframe, and scale
To open a chart in MT5, drag a financial instrument from the Market Watch window. If the instrument is dragged into an existing chart, the new symbol replaces the old one with the same settings.
- Holding Ctrl while dragging opens the symbol in a new window with the default template.
- To adjust the timeframe, simply click the desired period in the toolbar
- To scale the chart, use the zoom options or drag the scale slider to zoom in or out for better visibility of price movements.
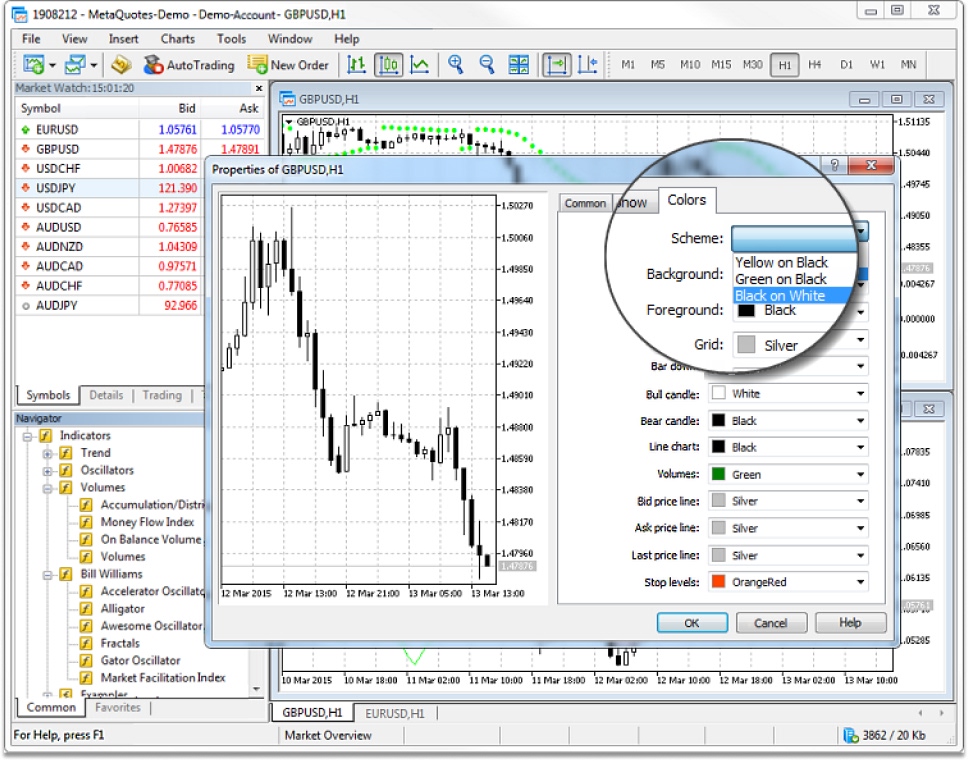
2. Changing the chart color
MT5 offers customizable chart colors. Right-click the chart, select Properties, and choose from the three available color schemes or manually adjust individual elements like background, grid, and bar colors. This allows traders to create a chart that suits their preferences for visual analysis.
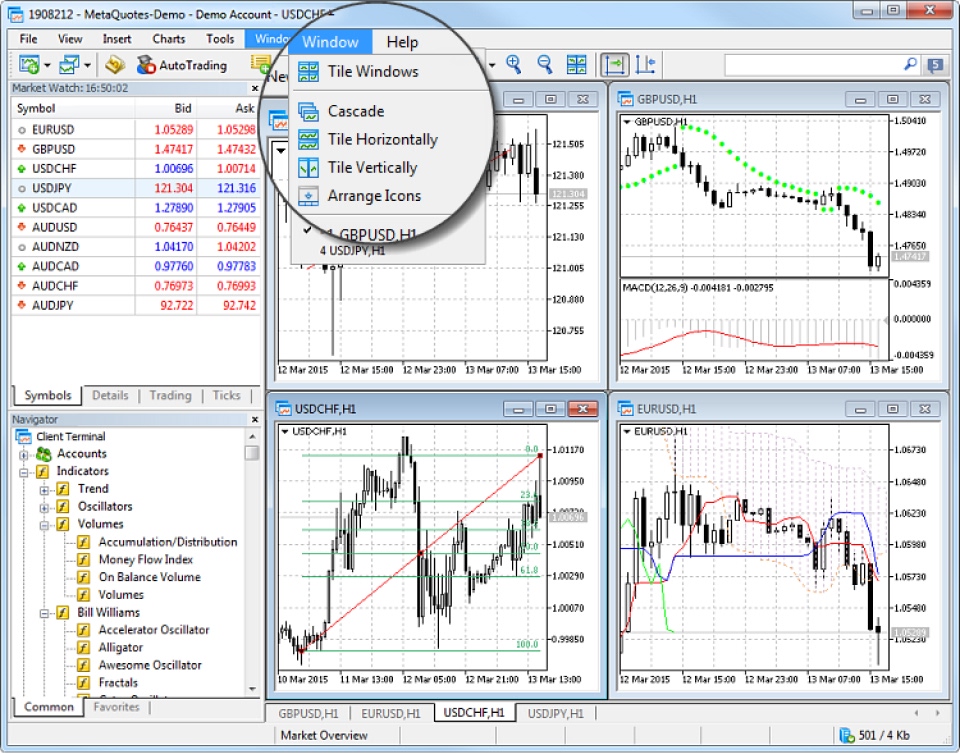
3. Arranging charts
MT5 enables users to manage multiple charts effectively. The Window menu lets users choose a chart layout, such as tiled or cascading. This feature helps traders organize their workspace and view different markets simultaneously.
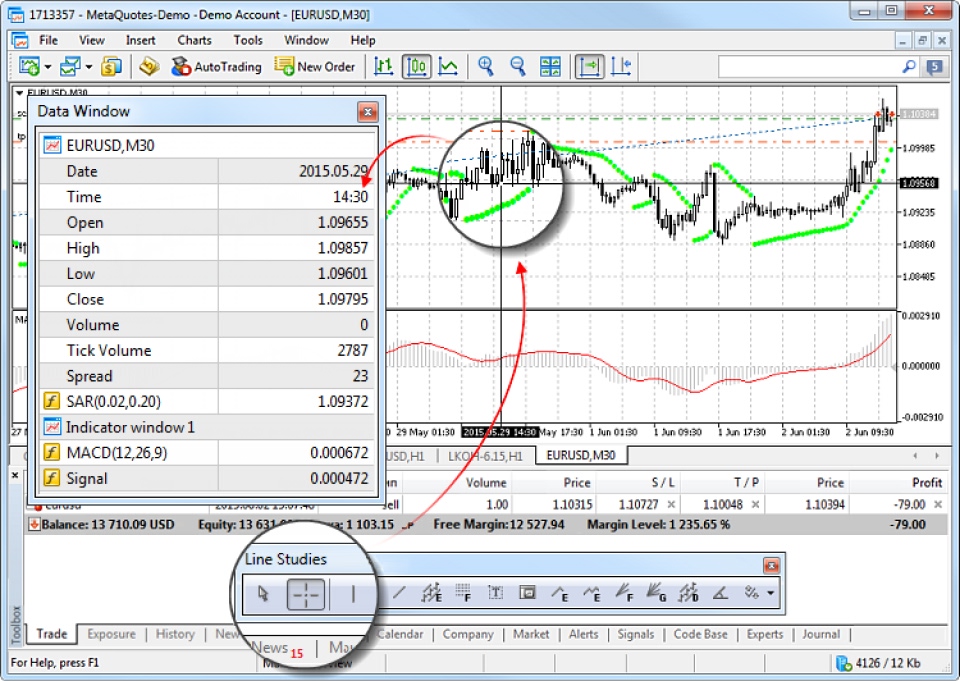
4. View precise values on the chart
To view exact values on the chart, use the Crosshair tool, which displays precise price and time coordinates. Additionally, the Data Window provides more details about the current chart point, such as bar parameters, volume, and indicator values, for a deeper analysis of market data.
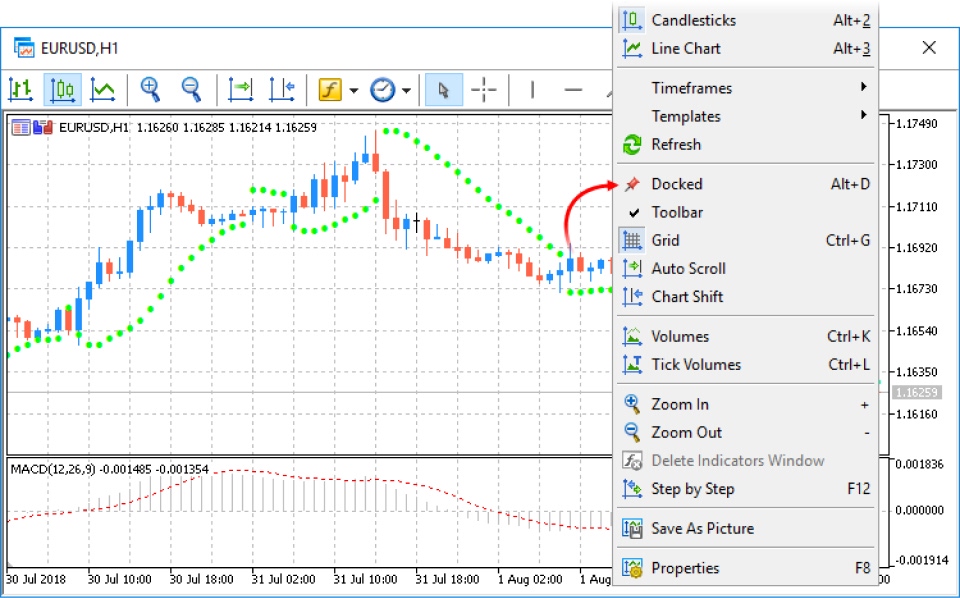
5. Work with charts on multiple monitors
MT5 allows traders to detach charts from the main platform window for use on multiple monitors. To detach a chart, right-click and uncheck the Docked option. This feature is ideal for monitoring multiple charts on separate screens, enhancing multitasking and efficiency.
6. Understand chart construction features
Charts in MT5 load historical data from the device's hard disk and download missing data from the server when needed. As the chart is opened, real-time price data is displayed and saved for future use. If no local data is available, the platform stores the last 512 bars of history, ensuring continuous market monitoring.
Navigating the pros and cons of forex charts on MT5
MT5 charts offer detailed market analysis, customizable visuals, and multiple timeframes, helping traders in decision-making. However, they can be overwhelming for beginners and may lead to overcomplication if not used strategically. Consistent practice is required for proper chart usage.
Disclaimer: All material published on our website is intended for informational purposes only and should not be considered personal advice or recommendation. As margin FX/CFDs are highly leveraged products, your gains and losses are magnified, and you could lose substantially more than your initial deposit. Investing in margin FX/CFDs does not give you any entitlements or rights to the underlying assets (e.g. the right to receive dividend payments). CFDs carry a high risk of investment loss.