


Umbrella patterns are recognized for their unique candlestick-like formations. It helps traders identify market reversals. By interpreting an umbrella pattern, traders are better able to predict forex price movements when a strong trend comes to an end.
In this comprehensive guide, we will learn everything about umbrella pattern trading, the strategies to use with it, and its significance in the forex market.
What is an umbrella pattern?
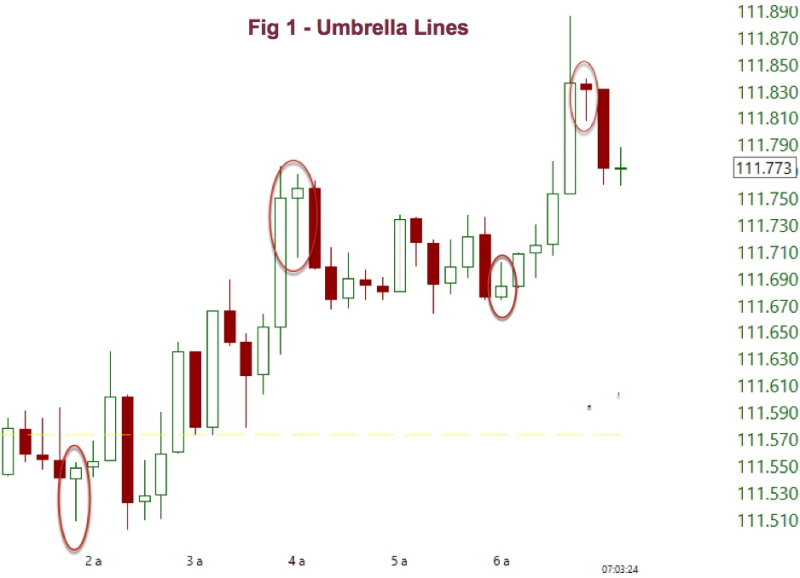
The umbrella pattern is a part of technical analysis characterized by a single candlestick with a short body and a long wick (shadow) extending downwards.
The body appears near the top of the trading range, signifying a struggle between long traders wanting to enter the market and short traders wishing to exit the market. The extended downward wick highlights a price rejection by buyers, hinting at a potential bullish reversal from an uptrend.
The umbrella pattern can also be inverted, with a short body near the bottom and a long upward wick. This inverted form suggests a potential reversal from a downtrend, as sellers cannot push prices further down. The inverted umbrella is a bearish reversal pattern.
Types of umbrella pattern
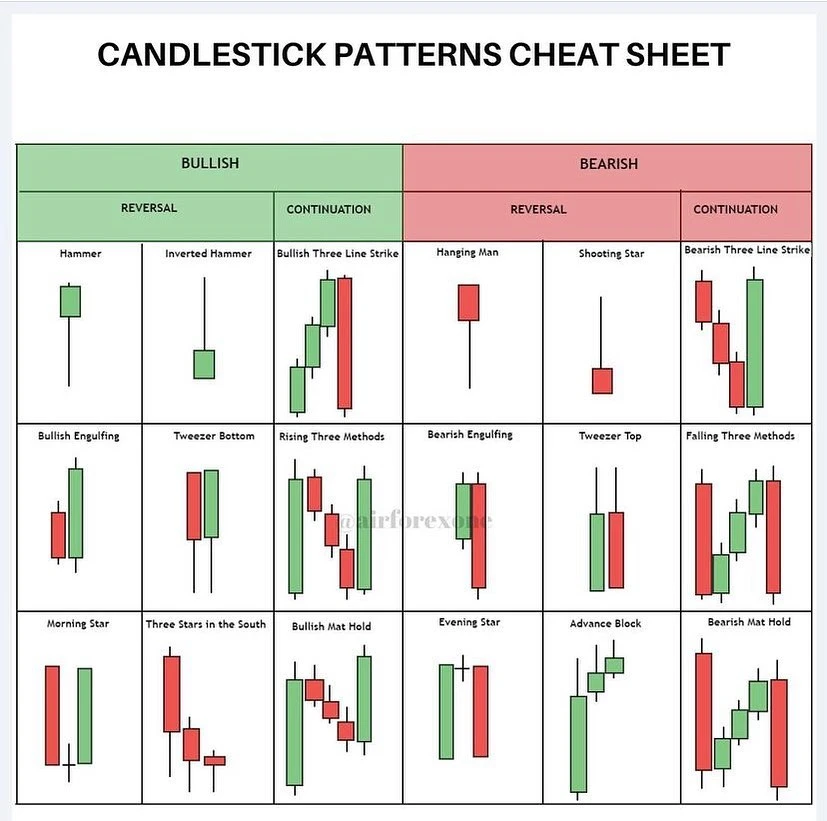
Hammer: This umbrella pattern features a short body positioned near the top of the trading range with a long downward wick. The short body reflects a tug-of-war between buyers and sellers, while the extended wick signifies buyers' rejection of lower prices, hinting at a possible bullish reversal.
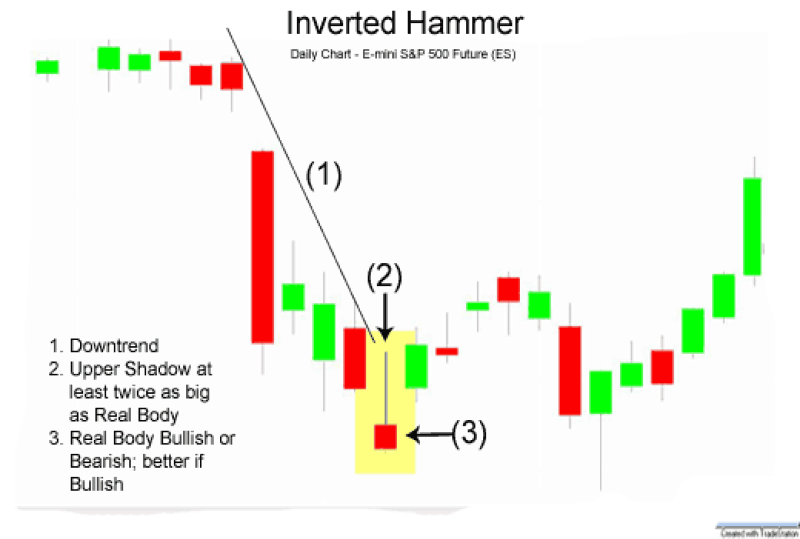
Inverted hammer: This is the mirror image of the hammer. It has a short body near the bottom of the trading range and a long upward wick. The short body suggests indecision, while the extended upward wick indicates sellers' inability to lower prices, potentially signaling a reversal from a downtrend.
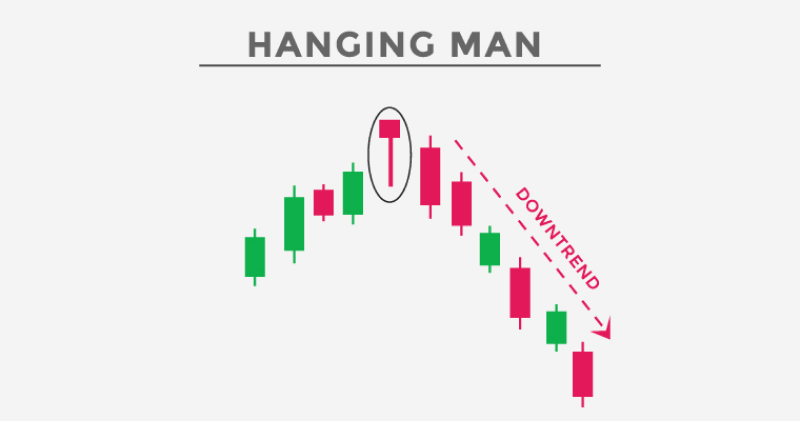
Hanging man: This pattern resembles a man hanging by a rope, with a small body near the top of the trading range, a short upward wick, and a long downward wick. The short upward wick suggests a minor purchase attempt, while the dominant downward wick highlights exit pressure, creating a potential bearish reversal signal.
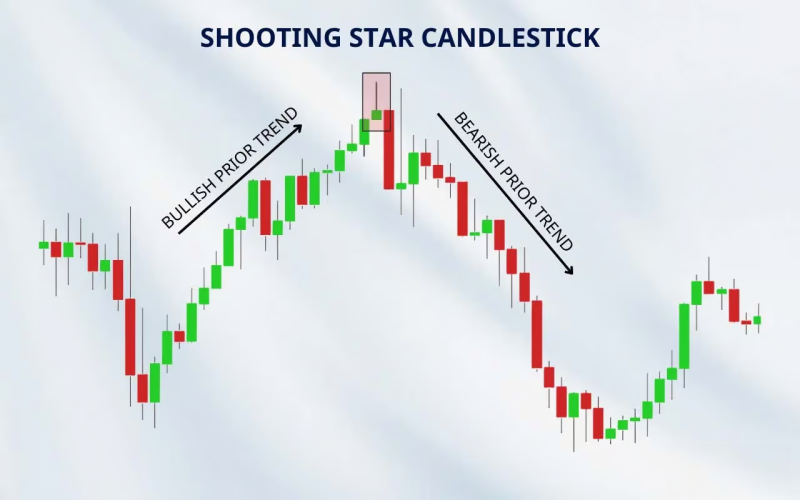
Shooting star: Similar to the hanging man, the shooting star has a small body near the top but with a negligible or very short upward wick and a long downward wick. The lack of a significant upward wick emphasizes the strong exit pressure after a price spike, potentially indicating a bearish reversal.
Identifying umbrella patterns
Charts
The following charts help in identifying umbrella patterns –
Candle-volume charts
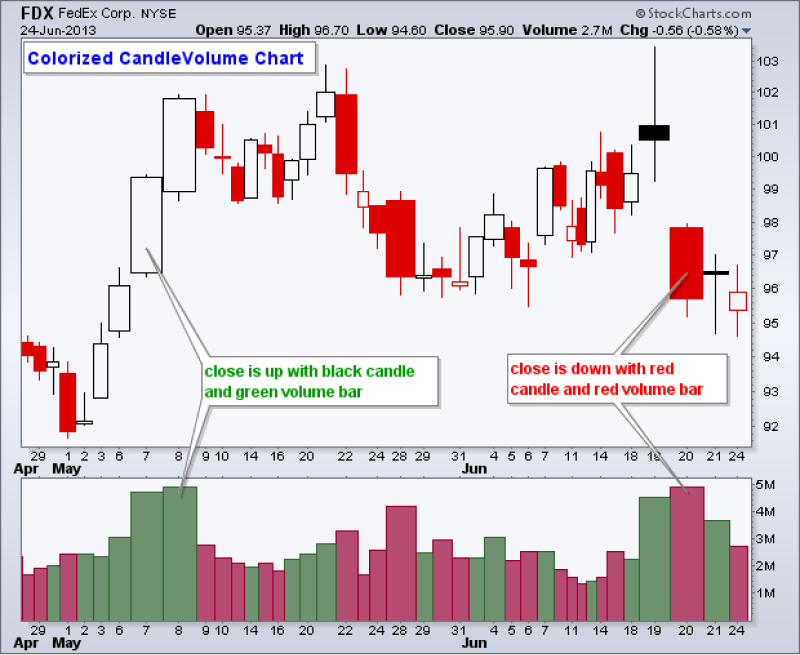
Candle-volume charts combine traditional candlestick charts, showcasing price movements through open, high, low, and close bars, with volume bars underneath. The candlestick pattern reveals the umbrella pattern's key characteristics (short body and long wick).
Additionally, the volume bars provide supporting information. High volume accompanying the long wick indicates a stronger rejection of the price by buyers/sellers, reinforcing the potential reversal signal.
Bar charts
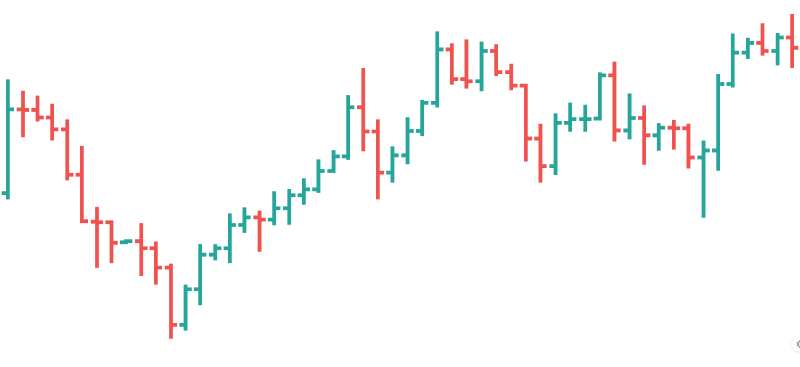
Bar charts represent price movements using vertical bars with a single line marking the open and close prices. To identify an umbrella (hammer) pattern on a bar chart, traders look for bars where the close is near the open price, resulting in a small body.
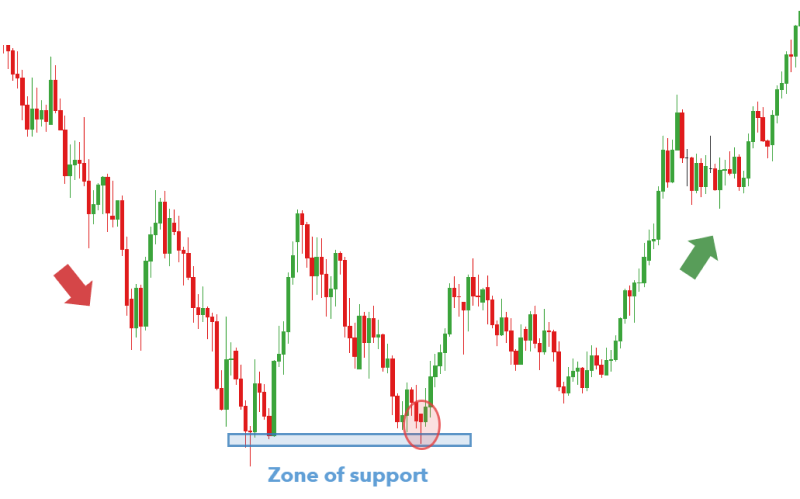
This pattern often appears after a downtrend and signals a potential reversal, suggesting buyers are entering the market with enough force to halt the downward movement. Traders should look for a small range between the open and close prices and a disproportionately long lower shadow.
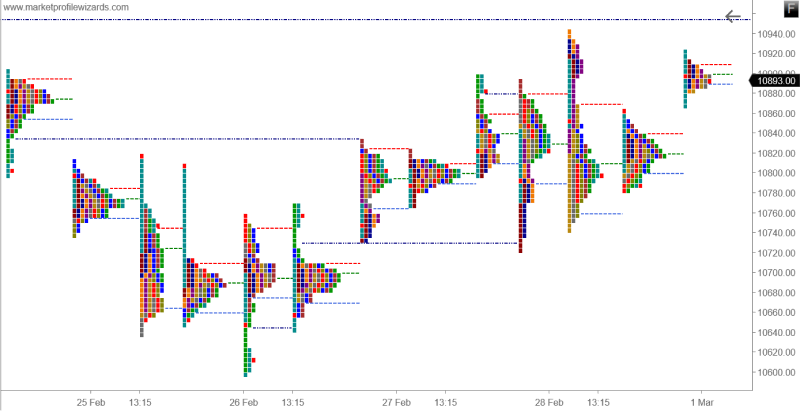
Market profile charts
Market profile charts depict the time spent at different price levels within a trading session. It uses horizontal bars to represent price levels and color-codes them based on buying and selling activity. A market profile chart consists of –
- Time Price Opportunities (TPOs): Each TPO represents a specific time period during which the price was traded
- Value Area: The range of prices where a significant amount of trading occurred, typically 70% of the total volume
- Point of Control (POC): The price level where the highest volume of trading occurred
To spot a hammer pattern, traders should first identify a downtrend, evidenced by a series of lower highs and lower lows in the price distribution.
On a specific trading day within this downtrend, a hammer is recognized by a significant concentration of Time Price Opportunities (TPOs) at lower price levels, indicating a sharp decline. This decline is followed by a recovery, where the closing price is near the opening price, forming a long lower shadow and a small body in the market profile.
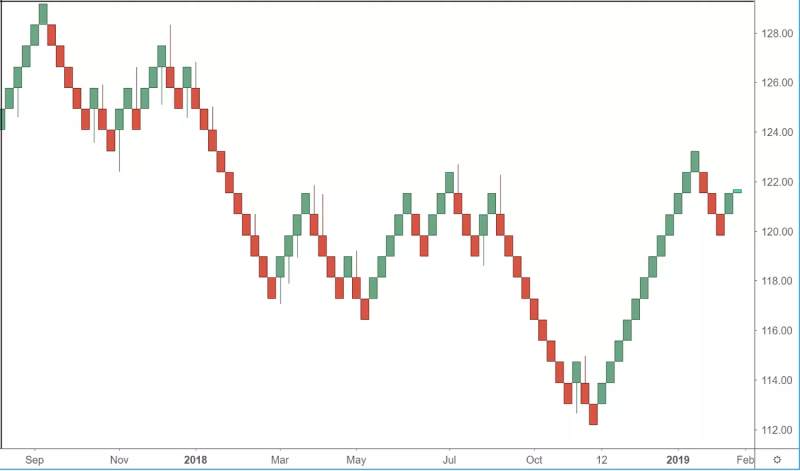
Renko charts
Renko charts use bricks to represent price movements based on a predetermined price range (box size). A new brick appears only if the price moves by the box size or more. Renko charts can help filter out minor price fluctuations. Since the umbrella pattern relies on a single candlestick with a long wick, it can be easier to identify on a Renko chart where noise is reduced.
To identify a hammer pattern using Renko charts, traders should first observe a downtrend marked by consecutive red bricks. The appearance of a single green brick after a series of red bricks signals a potential hammer pattern, suggesting the downtrend might be reversing. This green brick represents the small body of the hammer, while the price drop before its formation signifies the long lower shadow.
By showing areas of high volume and price congestion, they provide insights into the entry and exit pressure surrounding the reversal point highlighted by the umbrella pattern.
Indicators
The following indicators can be used with the umbrella pattern to confirm reversal signals –
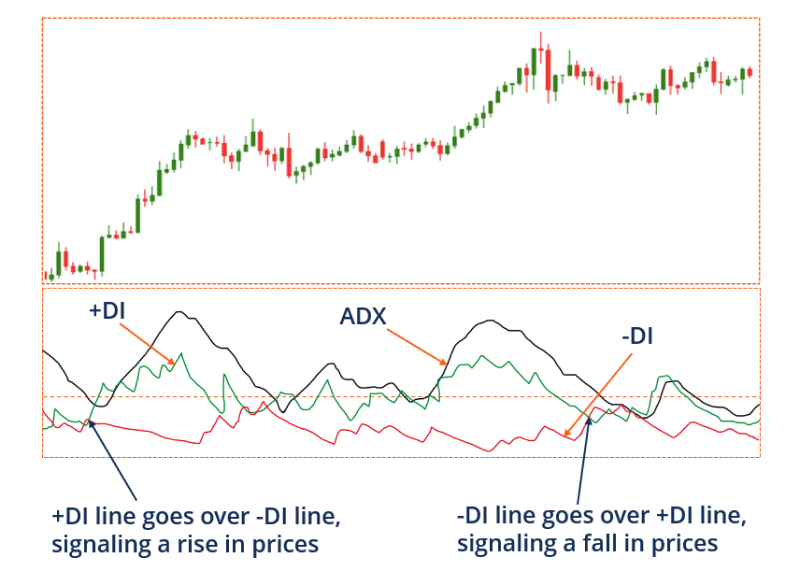
Directional movement index (DMI)
The DMI is a three-line indicator (ADX, +DI, -DI) that gauges the strength and direction of a trend. The Average Directional Index (ADX) line indicates trend strength, while the Positive Directional Indicator (+DI) and Negative Directional Indicator (-DI) lines show the strength of bulls and bears, respectively.
- A rising ADX line alongside a crossover of the +DI above the -DI line after a hammer formation can strengthen the bullish reversal signal of the umbrella pattern
- A rising ADX line with a crossover of the -DI above the +DI line following an inverted hammer indicates a bearish reversal signal
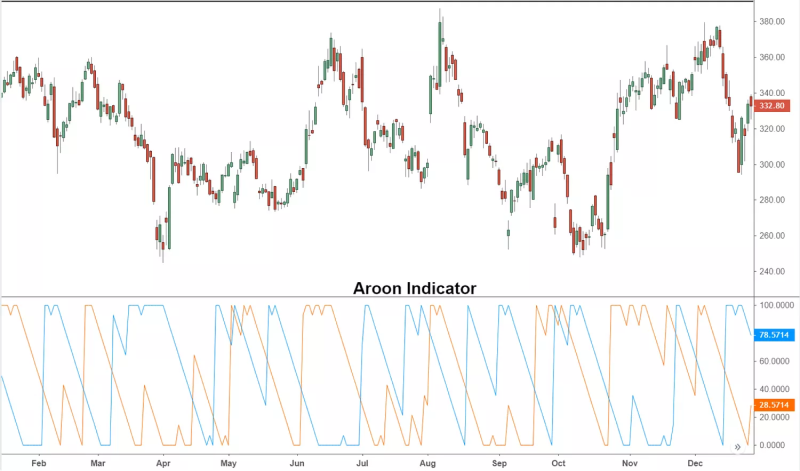
Aroon oscillator
The Aroon Oscillator displays two lines (Aroon Up, Aroon Down) that measure how many bars have passed since the most recent high (Aroon Up) and low (Aroon Down).
- A rising Aroon Up line after a hammer formation can support the bullish reversal signal by indicating a potential resumption of the uptrend
- A rising Aroon Down line following an inverted hammer adds weight to the bearish reversal signal by suggesting a stronger downtrend might be taking hold
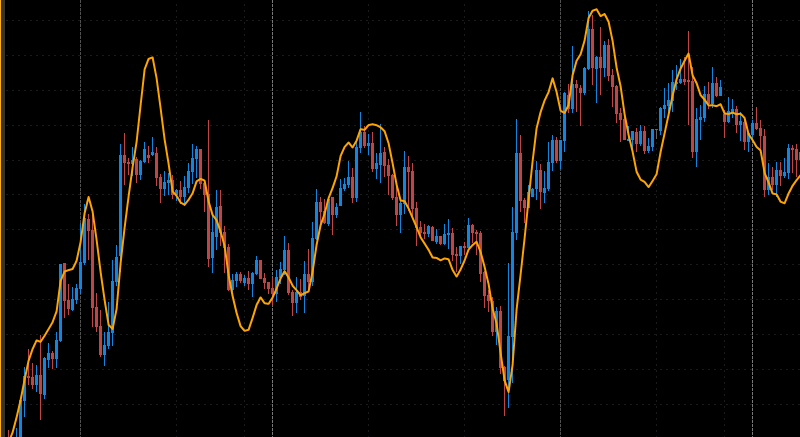
Time series forecast (TSF)
The TSF is an indicator that attempts to predict future price movements using a statistical regression model. TSF extrapolates the trend based on historical data and projects potential future price levels.
- If TSF confirms the hammer pattern by projecting higher future prices or a reversal in the downtrend, it adds confirmation to the bullish reversal signal
- If TSF confirms the hanging man pattern by projecting lower future prices or a reversal in the uptrend, it strengthens the bearish reversal signal
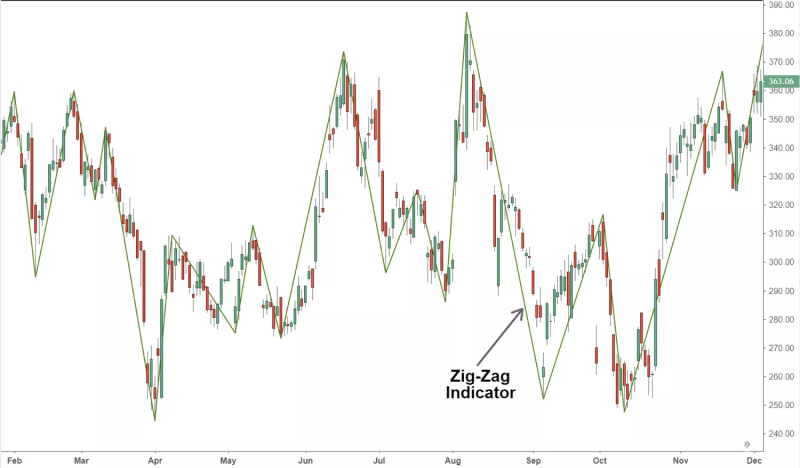
Zigzag indicator
The zigzag indicator simplifies price movements by connecting consecutive highs and lows that exceed a predefined minimum price change.
- Look for the zigzag indicator to confirm a reversal by plotting a low followed by a higher low (an upward swing) after the formation of the hammer pattern. This upward swing on the Zigzag indicator confirms the potential bullish reversal signaled by the hammer pattern
- Look for the zigzag indicator to confirm a reversal by plotting a high followed by a lower high (a downward swing) after the formation of the hanging man pattern. This downward swing on the zigzag indicator confirms the potential bearish reversal signaled by the hanging man pattern
Interpreting umbrella patterns
Traders can interpret bullish and bearish reversals with the umbrella pattern in the following way -
- For a bullish (bearish) reversal umbrella pattern, look for an uptrend (downtrend) preceding the potential reversal.
- The short body of the umbrella pattern should be located near the top of the trading range. This suggests a temporary pause in the downtrend (uptrend).
- A long downward wick will appear. It signifies exit (entry) pressure pushing prices lower (higher), hinting at a potential reversal to the downside (upside).
How do external factors impact the umbrella pattern?
- News and events: Unexpected news events, even seemingly unrelated to the specific currency pair being traded, can trigger knee-jerk reactions in the market. This can create noise and potentially lead to false breakouts or reversals, making it difficult to rely solely on the umbrella pattern for confirmation
- Technical support and resistance: Umbrella patterns often form near established support or resistance levels. However, the strength and validity of these support/resistance zones can be impacted by external factors. For example, a strong economic data release might trigger a break above a resistance level, even if an inverted hammer pattern suggested a potential reversal
- Market liquidity: Forex markets operate 24/5, but liquidity can vary depending on the time of day and the specific currency pair being traded. Lower liquidity conditions can lead to choppier price movements and potentially create false breakouts above/below the neckline of the umbrella pattern, making it difficult to confirm a genuine reversal
Trading strategies using umbrella patterns
Here are the top trading strategies one can use with the umbrella pattern to identify entry and exit price levels during market reversals –
Carry trade strategy
This strategy involves borrowing a low-yielding currency (exit) and investing in a high-yielding currency (entry) to gain from the interest rate differential.
A bullish hammer pattern on a high-yielding currency could signal a potential reversal and increased interest rate differential, potentially amplifying gains. However, be cautious, as unwinding carry trades (closing positions) can cause significant market fluctuations and disrupt the strategy.
- Enter by purchasing the high-yielding currency (after the hammer) and exit by shorting it (potentially to repay the loan) when the strategy dictates
- Place a stop-loss order below the low wick of the hammer pattern to limit potential losses if the reversal fails
Correlation strategy
This strategy exploits the price movements of correlated currency pairs. If two currencies tend to move in the same direction, a reversal signal from an umbrella pattern on one currency might suggest a potential reversal in the other.
Use the strategy with an umbrella pattern by identifying a currency pair with a high correlation. If a trader sees a hammer on the chart of the first currency, it might suggest a potential reversal and entry opportunity in the second correlated currency. Conversely, an inverted hammer on the first currency might indicate an exit opportunity in the second.
- For a long entry based on a hammer, consider placing it below the low wick of the hammer on the correlated currency's chart
MACD histogram strategy
The Moving Average Convergence Divergence (MACD) indicator is a tool for identifying trend direction and potential reversals. The MACD histogram strategy shows the difference between two moving averages.
Look for a hammer formation followed by a bullish crossover on the MACD histogram (when the MACD line crosses above the signal line). This confluence can strengthen the entry signal for a potential uptrend. Conversely, an inverted hammer followed by a bearish crossover on the MACD histogram (MACD line crossing below the signal line) can support a short entry.
- Enter the trade after the MACD crossover confirmation following the umbrella pattern
- Place a stop-loss order below the low wick of the hammer for a long entry or above the high wick of the inverted hammer for a short entry
Spot trend reversals with the umbrella pattern
While helpful in spotting market reversals, the umbrella pattern can sometimes give false signals due to external factors. For confirmation, it is always better to combine the pattern with indicators like RSI and MACD. Forex traders must always prioritize risk management to make informed and responsible decisions.
Disclaimer: All material published on our website is intended for informational purposes only and should not be considered personal advice or recommendation. As margin FX/CFDs are highly leveraged products, your gains and losses are magnified, and you could lose substantially more than your initial deposit. Investing in margin FX/CFDs does not give you any entitlements or rights to the underlying assets (e.g. the right to receive dividend payments). CFDs carry a high risk of investment loss.