The Dragonfly Doji candlestick pattern can provide traders with potential bullish reversal signals, offering valuable insights into market sentiment and entry points. Understanding and utilizing this pattern enhances traders' ability to identify better opportunities and manage risk effectively.
In this article, we go in-depth about the Dragonfly Doji candlestick pattern.
What is Dragonfly Doji candlestick?
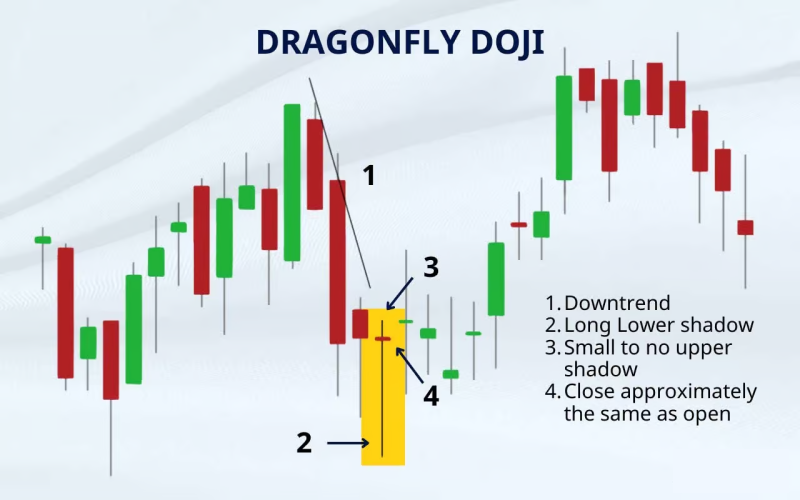
The Dragonfly Doji candlestick pattern is characterized by a small body with little to no upper shadow and a long lower shadow. The small body indicates that the opening and closing prices are at or near the high of the trading session, suggesting a balance between the forex demand and supply.
On the other hand, the long lower shadow indicates that the traders who wanted to short a trade managed to push the price significantly lower during the session, but traders wanting to place a long order ultimately stepped in and pushed the price back up by the close. This pattern resembles the shape of a dragonfly, with a small body and a long lower tail, hence the name Dragonfly Doji. It suggests indecision in the market, potentially signaling a reversal if it appears after a downtrend.
How does the Dragonfly Doji candlestick work?
Traders interpret the Dragonfly Doji as a potential reversal signal, especially when it appears after a downtrend. The long lower shadow indicates that short traders pushed the price lower during the session, but long traders managed to push the price back up by the close. This reversal potential is strengthened if the Dragonfly Doji forms near a significant support level or in conjunction with other technical indicators suggesting oversold conditions. It happens because it indicates that long traders are stepping in to support the price, potentially signaling a reversal of the prevailing downtrend.
Traders often look for follow-through purchasing pressure in subsequent sessions to confirm the reversal signal. If prices continue rising after the Dragonfly Doji formation, the bullish reversal signal strengthens. However, traders should exercise caution and consider other factors such as volume, trend strength, and support/resistance levels to validate the signal provided by the Dragonfly Doji pattern.
How to identify a Dragonfly Doji candlestick in price charts?
1- Look for a small body: A Dragonfly Doji has a small body, indicating that the opening and closing prices are close together.
2- Check for no or very small upper shadow: A key characteristic of a Dragonfly Doji is the absence of very small upper shadow. The upper shadow should ideally be nonexistent or significantly shorter than the lower shadow.
3- Observe a long lower shadow: The most distinctive feature of a Dragonfly Doji is its long lower shadow, which extends below the candlestick's body. This shadow represents the low price reached during the trading session.
4- Confirm context: Consider the context in which the Dragonfly Doji appears. It may signal a potential bullish reversal if it forms after a prolonged downtrend. Additionally, check for confirmation from other technical indicators or patterns to validate the signal.
Top forex trading strategies to use with the Dragonfly Doji candlestick
Bullish reversal
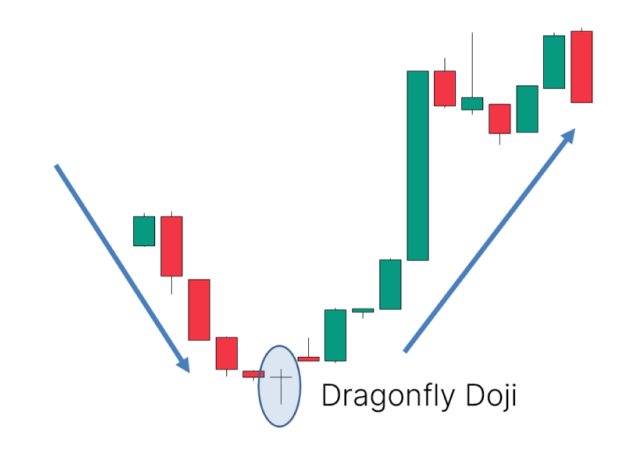
The bullish reversal strategy involves identifying potential shifts from a downtrend to an uptrend. Traders employing this strategy look for signals indicating that exit pressure may wane, leading to a potential transition in market sentiment toward entry pressure.
When combining this strategy with the Dragonfly Doji pattern, traders may wait for the pattern to form after a prolonged downtrend. The appearance of the Dragonfly Doji signals potential exhaustion among traders who are shorting and suggests that the ones placing long orders may be stepping in, potentially heralding a bullish reversal. This combination can provide traders with a clear signal to enter long positions, anticipating a reversal in price direction.
Moving average crossovers
Moving average crossovers is a trend-following strategy traders use to identify potential shifts in market direction. This strategy involves moving averages of different time periods, with crossovers occurring when shorter-term moving averages cross above longer-term ones, signaling a potential change in trend direction.
When combining this strategy with the Dragonfly Doji pattern, traders may use the pattern to confirm a bullish reversal. For example, after a bullish crossover of moving averages, the appearance of a Dragonfly Doji pattern can confirm a potential shift towards an uptrend, strengthening the bullish signal.
Trend continuation
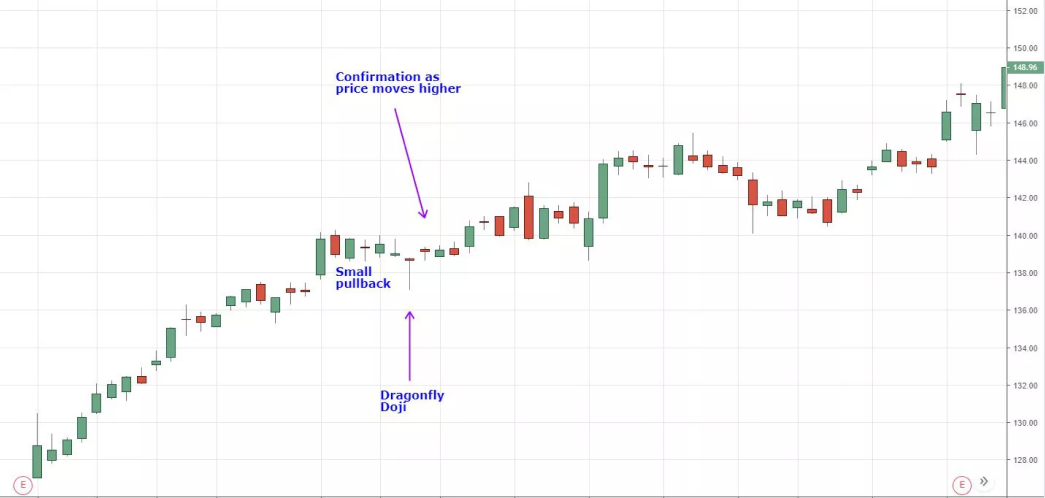
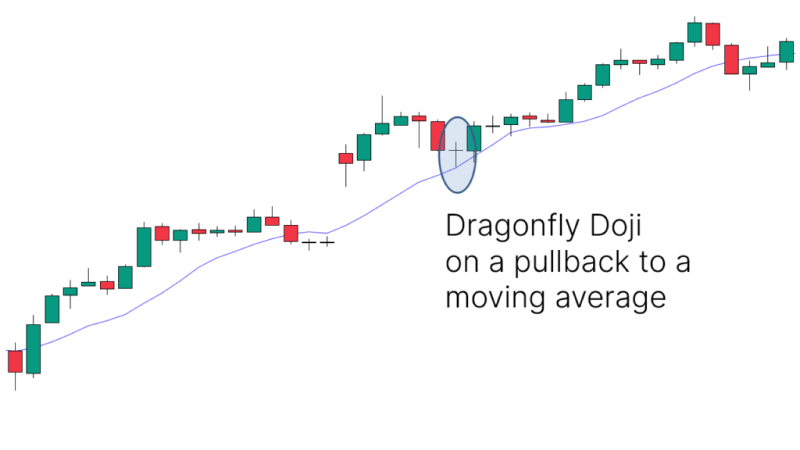
Trend continuation strategies focus on capitalizing on existing trends rather than reversals. Traders employing this strategy aim to ride the momentum of established trends, looking for signals indicating that the current trend is likely to continue after a brief pause or consolidation.
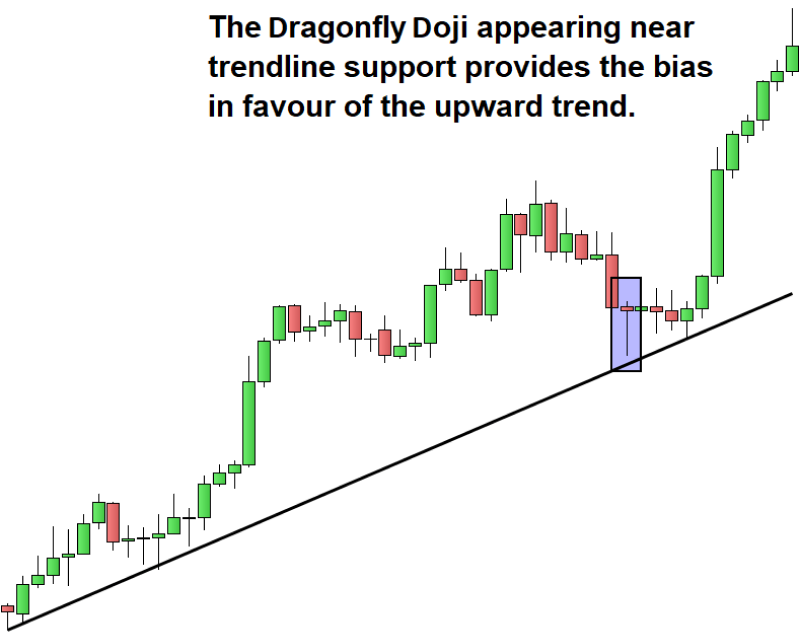
When combining this strategy with the Dragonfly Doji pattern, traders may look for the pattern to form within an established uptrend. The appearance of the Dragonfly Doji suggests a temporary pause in the upward momentum, but the overall trend remains intact. Traders can use this as an opportunity to enter long positions, anticipating the continuation of the uptrend following the brief consolidation period indicated by the pattern.
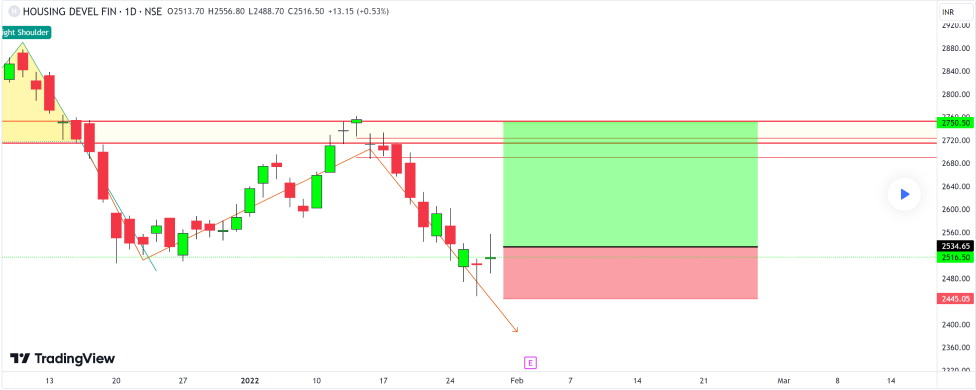
Support and resistance
Support and resistance are key price levels where trading pressure is expected to be strong. Traders use these levels to identify potential entry and exit points and gauge the strength of price movements.
When combining this strategy with the Dragonfly Doji pattern, traders may look for the pattern to form near-significant support levels in a downtrend. The presence of a strong support level, combined with the appearance of the Dragonfly Doji, can strengthen the bullish reversal signal, providing traders with a clear indication to enter long positions.
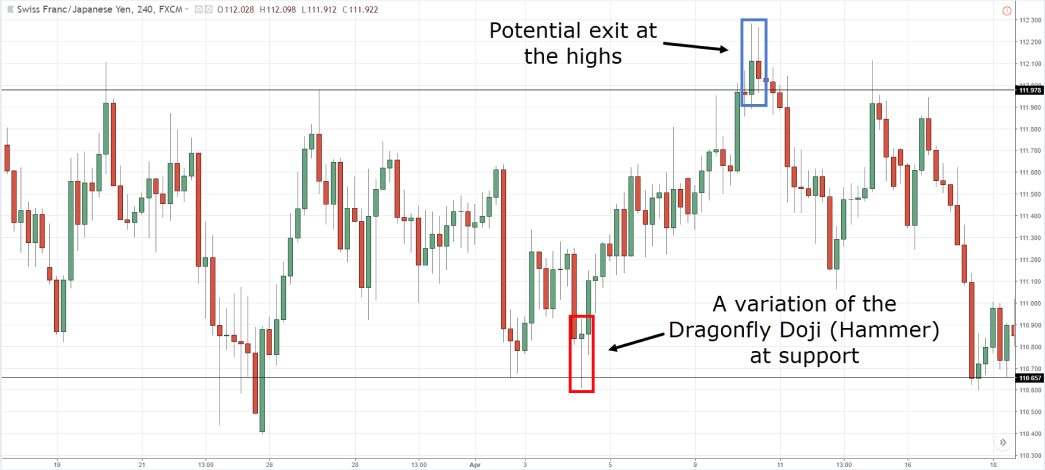
Scalping
Scalping is a short-term trading strategy where traders aim to gain from small price movements. Traders typically enter and exit positions quickly, often within minutes or even seconds, to capitalize on short-term fluctuations in price. When combining this strategy with the Dragonfly Doji pattern, traders may look for the pattern to form on lower time frames, such as the one-minute or five-minute charts.
The appearance of the Dragonfly Doji on these lower time frames can signal a brief pause or reversal in price direction, providing scalpers with an opportunity to enter quick trades in the direction of the expected reversal. This combination allows scalpers to capitalize on short-term price movements while leveraging the predictive power of the Dragonfly Doji pattern.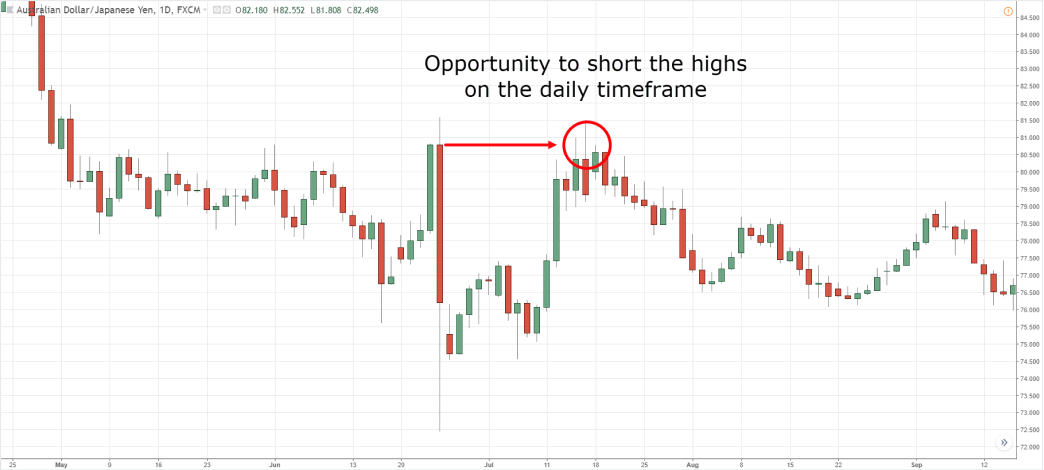
Volume analysis combination
Volume analysis involves analyzing trading volume to gauge the strength and validity of price movements. High trading volume can confirm the validity of price movements, while low volume may indicate weak or false signals.
When combining this strategy with the Dragonfly Doji pattern, traders may look for the pattern to form on higher-than-average trading volume. The appearance of the Dragonfly Doji on high volume can strengthen the reliability of the bullish reversal signal, providing traders with added confidence in the potential shift in market sentiment indicated by the pattern.
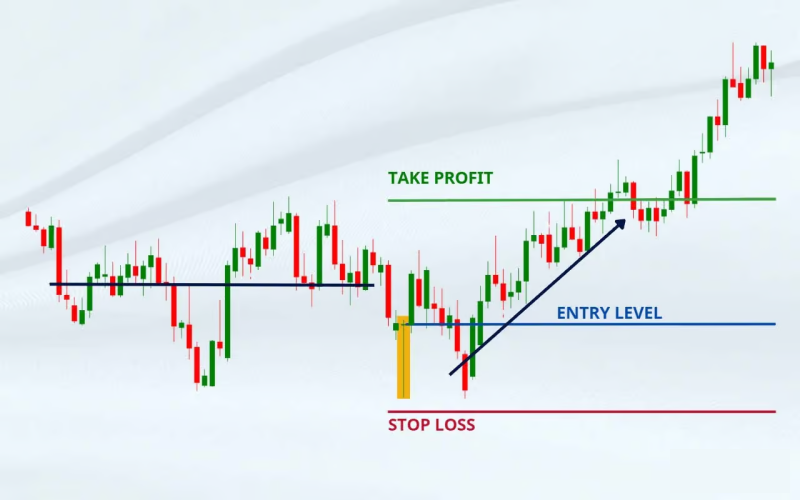
Breakout strategy
Breakout strategies involve trading breakouts of key support or resistance levels. Traders look for price movements that break out of established trading ranges, indicating potential opportunities for strong trends and gaining trades.
When combining this strategy with the Dragonfly Doji pattern, traders may look for the pattern to form near key support levels. The appearance of the Dragonfly Doji at support levels can signal potential purchasing pressure and a breakout opportunity. Traders can use this as a confirmation signal to enter long positions, anticipating a breakout in the direction indicated by the pattern.
Confirming with oscillators
Oscillators are technical indicators that measure momentum and overbought or oversold conditions in the market. Traders use oscillators to confirm signals from other technical analysis tools and to identify potential trend reversals.
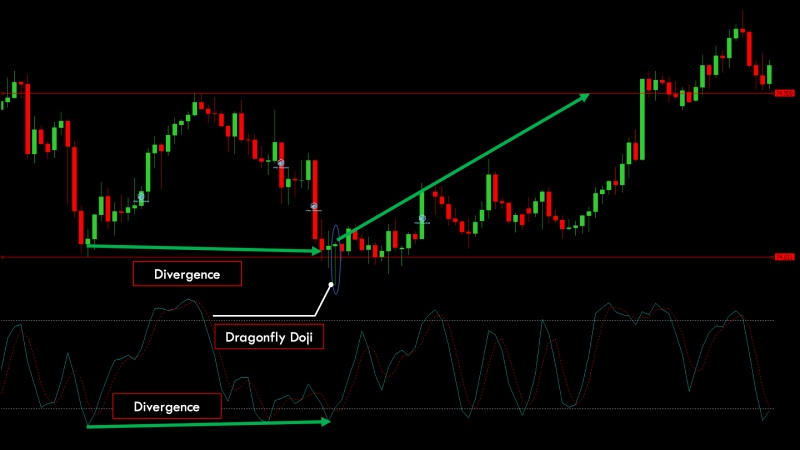
When combining this strategy with the Dragonfly Doji pattern, traders may use oscillators such as the Relative Strength Index (RSI) or the Stochastic Oscillator to confirm oversold conditions when the Dragonfly Doji forms. Oversold conditions on these indicators can strengthen the bullish reversal signal provided by the pattern, providing traders with added confirmation of the potential shift in market sentiment.
How to trade with the Dragonfly Doji Candlestick?
Identify dragonfly Doji pattern
Look for a candlestick with a small body, little to no upper shadow, and a long lower shadow, resembling the shape of a dragonfly.
Confirm market context
Assess the market context by considering prevailing trends, support and resistance levels, and volume. Dragonfly Doji patterns appear most significant after a downtrend, near key support levels, or on high volume.
Wait for confirmation
Wait for confirmation signals before entering a trade. Look for additional bullish signals, such as bullish candlestick patterns, bullish divergence on oscillators, or breakouts above resistance levels to confirm the potential reversal indicated by the Dragonfly Doji.
For example,
- After spotting a Dragonfly Doji, traders await confirmation through a bullish engulfing pattern, where a large bullish candle fully engulfs the prior small bearish one, affirming bullish momentum.
OR
- Upon seeing a Dragonfly Doji near support, traders can confirm the market momentum by observing a breakout above resistance, validating the reversal, and signaling entry into long positions.
Set entry and exit points
Determine the entry point above the high of the Dragonfly Doji candlestick and set a stop-loss order below the low of the pattern to manage risk. Consider setting a target price based on the distance from entry to the nearest resistance level or using a trailing stop to capture potential gains.
Determine position size
When trading with the Dragonfly Doji pattern, adjust the position size to match the trade's risk. Ensure potential rewards justify the risk signaled by the pattern, aligning position size with risk tolerance and account size to balance potential gains and acceptable risk levels before entering a trade.
Advantages and disadvantages of using Dragonfly Doji candlestick
Advantages
- Reversal signal: Dragonfly Doji often signals potential reversals in price direction, giving traders an early indication of a possible trend change.
- Simple to recognize: The distinctive appearance of the Dragonfly Doji, with a long lower shadow and little to no upper shadow, makes it easy for traders to identify on price charts.
- Low-risk entries: Traders can use Dragonfly Doji patterns to enter trades with relatively low risk, as stop-loss orders can be placed just below the low of the candlestick.
- Confirmation with volume: When accompanied by high trading volume, Dragonfly Doji patterns may be more reliable as reversal signals, increasing their predictive power.
Disadvantages
- False signals: Dragonfly Doji patterns can sometimes produce false signals, leading traders to enter trades prematurely or incorrectly if they rely solely on this pattern without considering other factors.
- Context dependence: The effectiveness of Dragonfly Doji patterns depends on the broader context of the market and other technical indicators. Traders need to consider factors such as volume, trend strength, and support/resistance levels to validate the signal provided by the candlestick pattern.
- Subjectivity: Interpretation of Dragonfly Doji patterns can be subjective, as traders may disagree on whether a particular candlestick qualifies as a true Dragonfly Doji.
- Limited application: While Dragonfly Doji patterns can be useful for identifying potential reversals, they may not provide clear signals in all market conditions or timeframes, limiting their applicability in certain trading scenarios, such as during low volatilities.
Leverage forex opportunities with Dragonfly Doji signals
The Dragonfly Doji candlestick pattern helps traders properly time their entry and exit decisions. However, it carries risks of false signals and reliance on confirmation, necessitating cautious application and thorough risk management in forex trading strategies.
Disclaimer: All material published on our website is intended for informational purposes only and should not be considered personal advice or recommendation. As margin FX/CFDs are highly leveraged products, your gains and losses are magnified, and you could lose substantially more than your initial deposit. Investing in margin FX/CFDs does not give you any entitlements or rights to the underlying assets (e.g. the right to receive dividend payments). CFDs carry a high risk of investment loss.


