


Technical analysis helps in warding off the inefficiencies in the crypto market by gauging market sentiment and identifying trends. It equips traders with advanced tools to identify trends, assess risk, and spot entry/exit points in the market.
In this article, we will discuss how to use technical analysis for trading crypto.
Role of technical analysis in crypto trading
Technical analysis in crypto helps traders understand bullish and bearish market trends to trade the cryptocurrencies accordingly. Once an analysis is conducted, traders get a deeper understanding of not only the market trends but also the support and resistance level, strength/weakness of a cryptocurrency’s price movement, entry/exit points, and stop-loss levels.
Top technical indicators to use for crypto trading
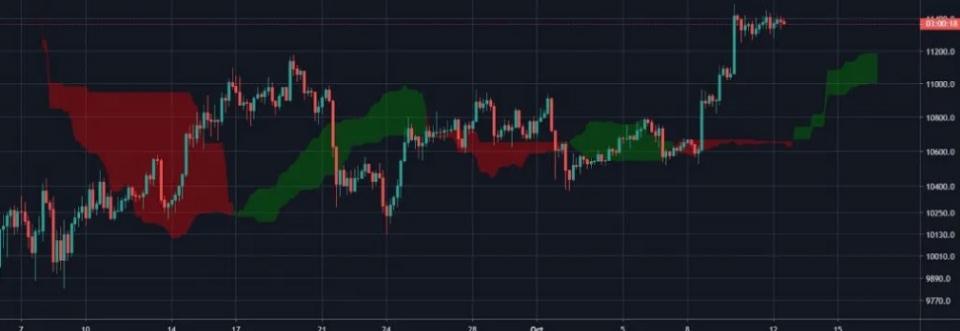
Ichimoku Cloud
Ichimoku Cloud is a multi-line indicator. It combines moving averages and price action to assess trend direction, potential support/resistance, and identify entry/exit opportunities through the interaction of multiple lines.
To use the Ichimoku Cloud in crypto, look for a bullish signal when the price is above the cloud and the cloud itself is rising. Conversely, a bearish signal is suggested when the price falls below the cloud with a downward-sloping cloud.
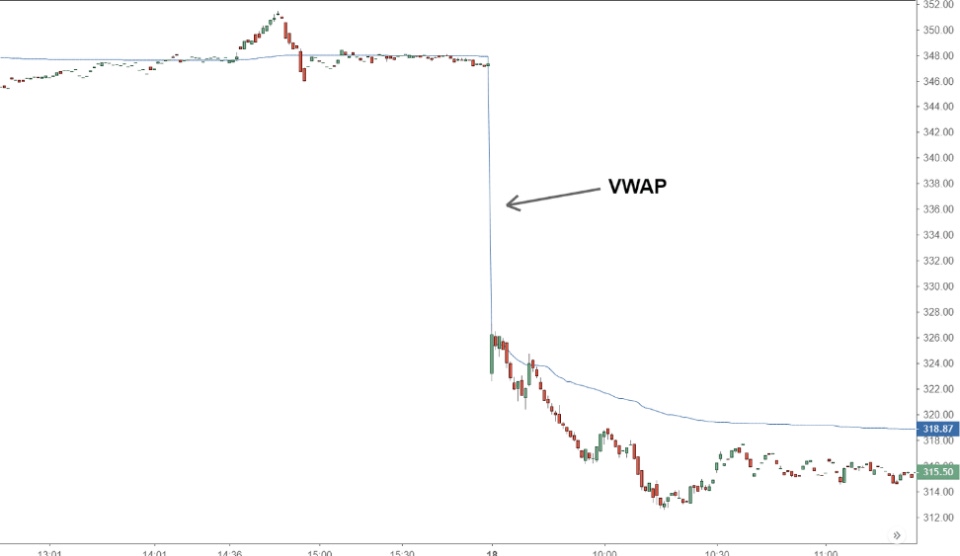
Volume Weighted Average Price (VWAP)
VWAP is an indicator that takes both price and volume into account to calculate the average price at which a security has traded throughout a specific period. It helps identify areas of strong entry or exit pressure based on volume activity at specific price levels.
In crypto trading, a price trading above the VWAP suggests long pressure, while a price trading below the VWAP suggests short pressure. Breakouts above or below the VWAP can signal potential trend continuations.
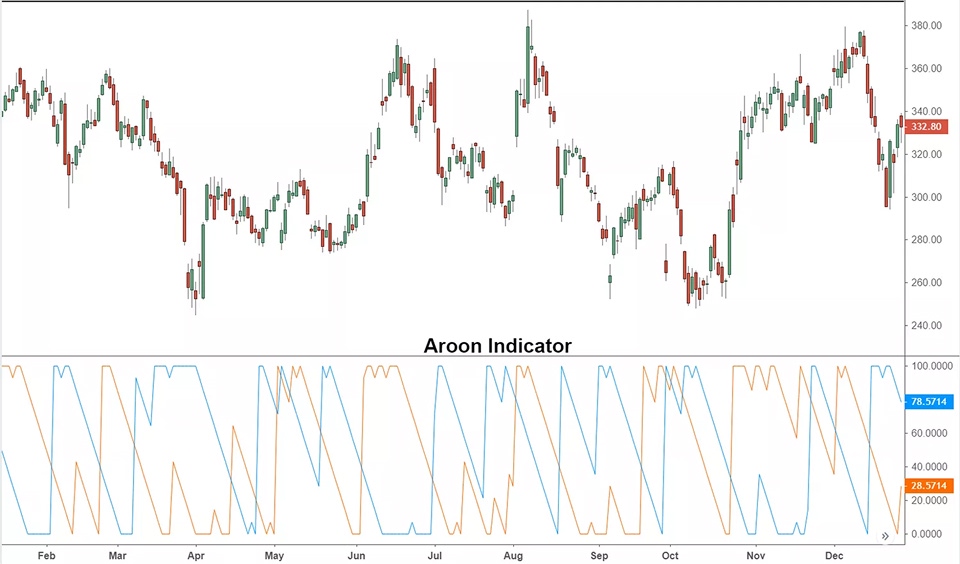
Aroon indicator
The Aroon indicator is made of two lines (Aroon Up and Aroon Down) that measure the time since the last highest high (up) and the last lowest low (down), aiming to identify the strength of a trend.
The Aroon indicator can help assess the strength of an ongoing trend in the crypto market. High Aroon up values indicate a strong uptrend, while high Aroon down values indicate a strong downtrend. Traders should look for a sustained rise in the Aroon up line to confirm an uptrend and a sustained rise in the Aroon down line to confirm a downtrend.
Top technical analysis strategies for crypto trading
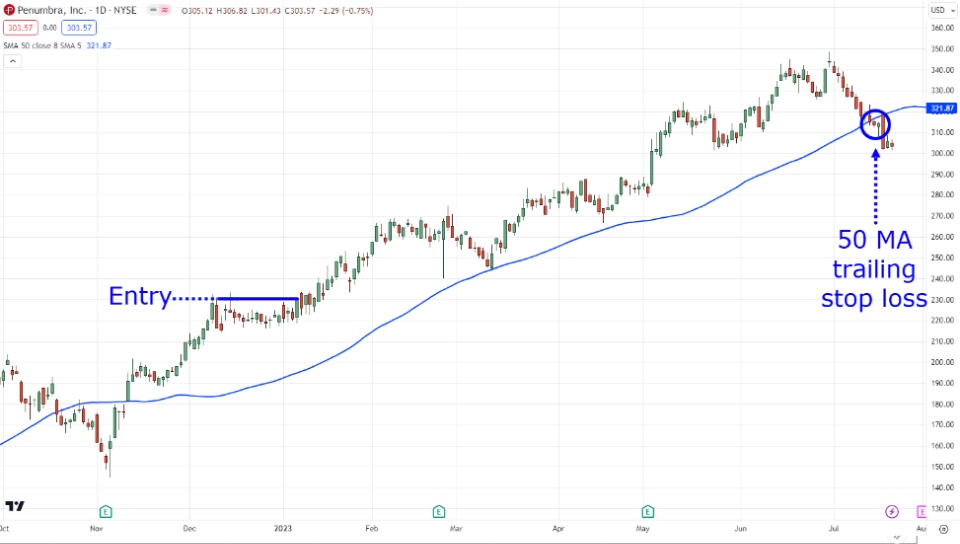
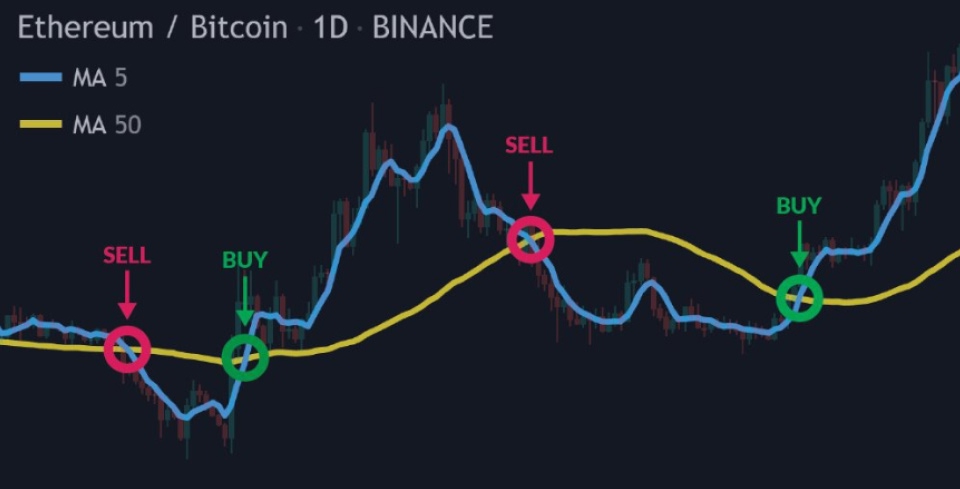
Trend following
Due to crypto market volatility, employ adaptive moving averages that adjust their window length based on recent volatility to trade with a trend following strategy. This ensures the indicator remains responsive to price movements without generating excessive signals in highly volatile periods. Capitalize on established trends by identifying them early and riding the wave until momentum weakens.
Algorithmic trading
Algorithmic trading helps address the challenge of the volatile crypto market that requires rapid decision-making. It offers an automated approach to capitalize on opportunities and execute trades based on predefined rules.
This approach leverages computer programs, designed with a specific trading strategy in mind, to automate the execution of trades based on predefined rules and parameters. When the predetermined conditions, such as specific technical indicators reaching designated levels, are met, the algorithm executes trades autonomously.
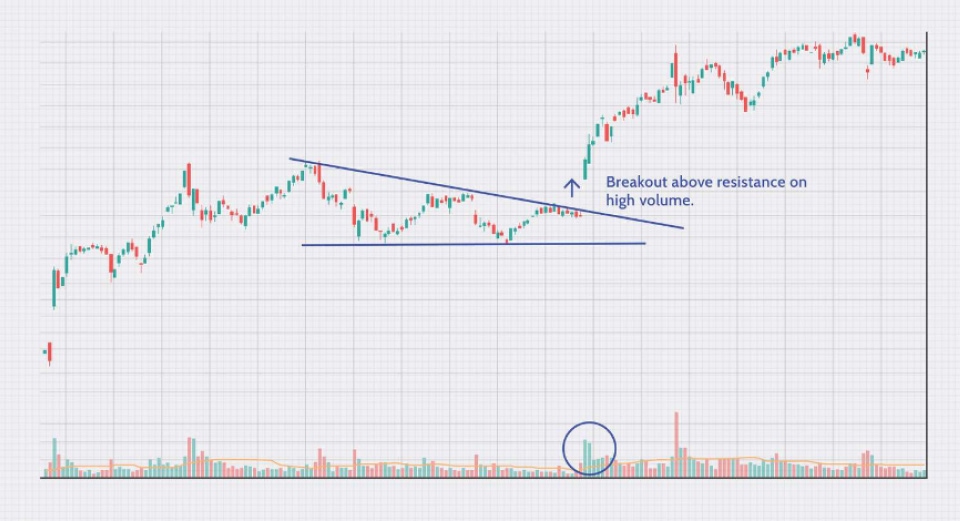
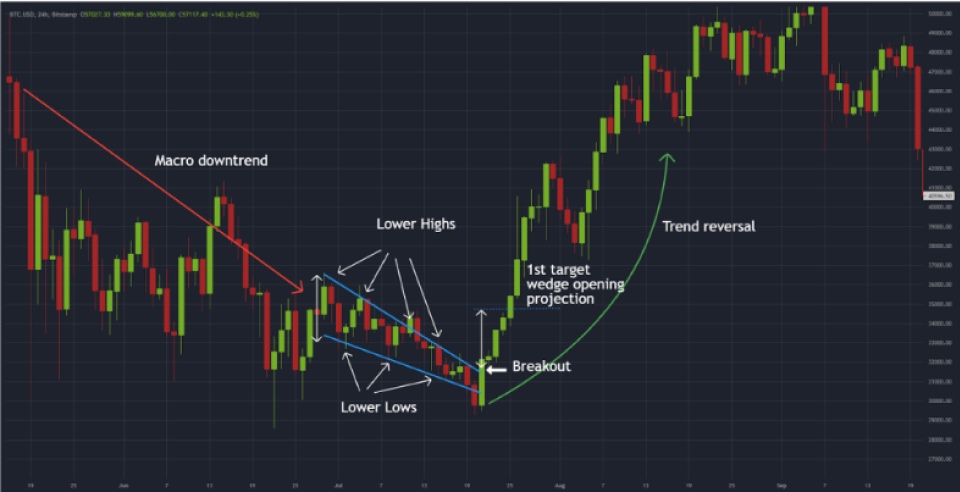
Breakout trading
Breakout trading strategies in the cryptocurrency market capitalize on significant price movements that breach established support or resistance levels. Bollinger Bands can be used to identify these potential breakout zones.
The volatility of the cryptocurrency market can sometimes lead to false breakouts, where the price appears to break out but quickly reverses. To enhance the reliability of breakouts identified using Bollinger Bands, volume analysis is incorporated. A surge in trading volume coinciding with a breakout strengthens the breakout's legitimacy. Higher volume suggests increased market participation, potentially signifying a genuine breakout and a trend shift.
Step wise guide to using technical analysis for crypto trading
1. Move beyond basic indicators
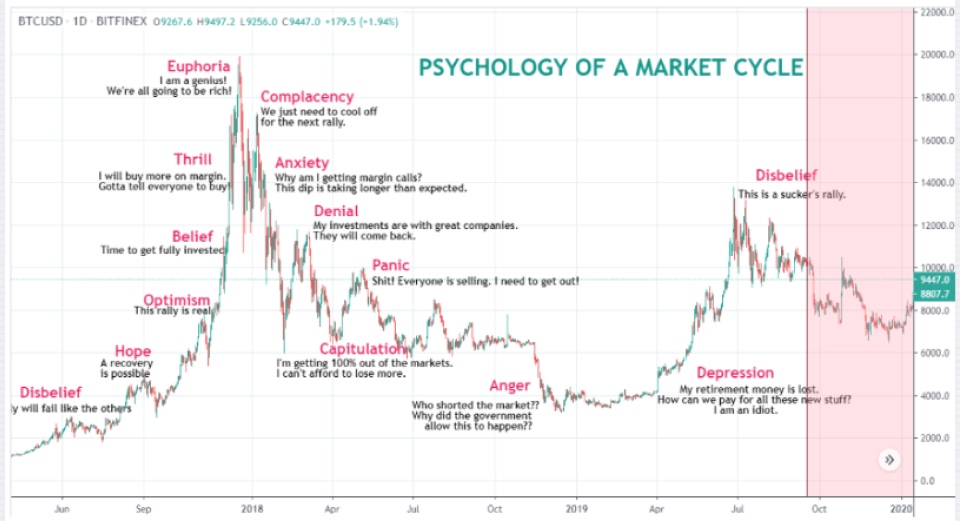
While basic indicators like moving averages and the Relative Strength Index (RSI) provide a foundational understanding, traders must move beyond these rudimentary tools when trading the crypto market due to its volatile market cycle.
Indicators such as Chaikin Money Flow, ATR, and more can be applied to understand market behavior.
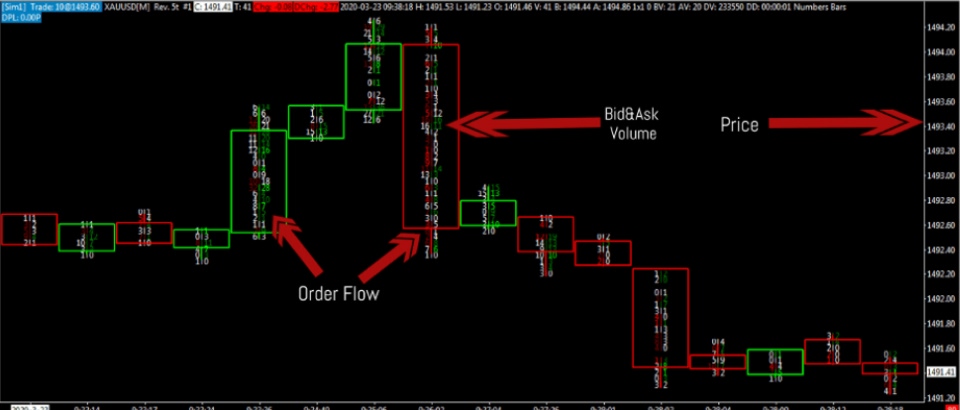
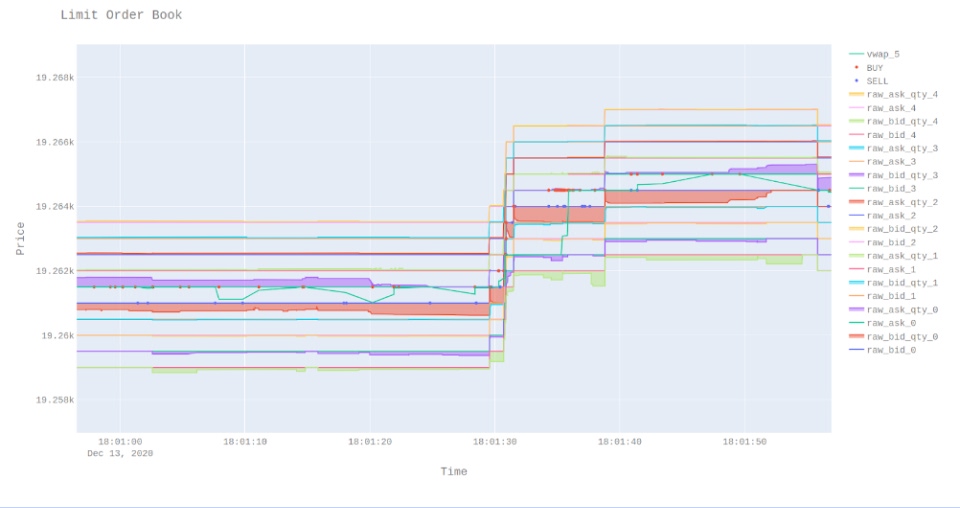
2. Conduct an order flow analysis
Then, traders should conduct an order flow analysis, which is a trading technique that dives deeper than just looking at price charts. It involves analyzing the actual orders.
By understanding this flow of orders, traders can anticipate where the price might move next. Deciphering this order book data allows for the identification of hidden trading pressure, potentially foreshadowing significant price fluctuations.
3. Understand crypto market's microstructure
The cryptocurrency market operates with a unique structure distinct from traditional financial markets.
Crypto market’s microstructure refers to the framework of rules, systems, and participants that influence how cryptocurrency trades are executed. Traders must understand the crypto market’s microstructure to interpret price action based on exchange liquidity, order book depth, and trading fees.
4. Apply advanced chart pattern recognition
While basic chart patterns are essential, traders should identify advanced chart patterns like Head and Shoulders or Gartley patterns after understanding the market’s microstructure.
These patterns signal potential trend reversals or continuations, enabling traders to anticipate future market movements and adjust their strategies accordingly.
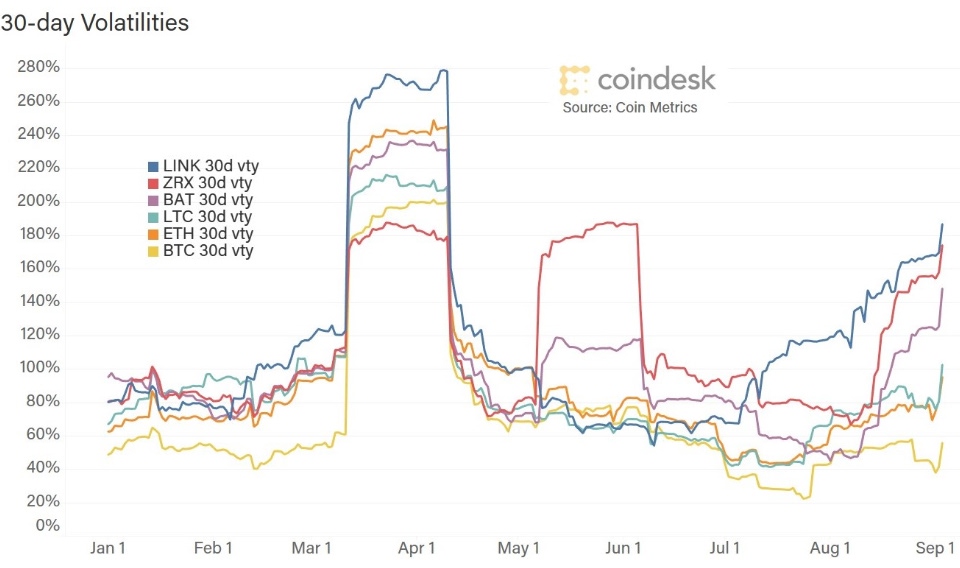
5. Apply a volatility measure
The crypto market is volatile and hence it is necessary for traders to use other technical indicators with a volatility measure such as ATR or Bollinger Bands to gauge market volatility.
These provide traders with a quantitative framework for assessing entry and exit points accordingly.
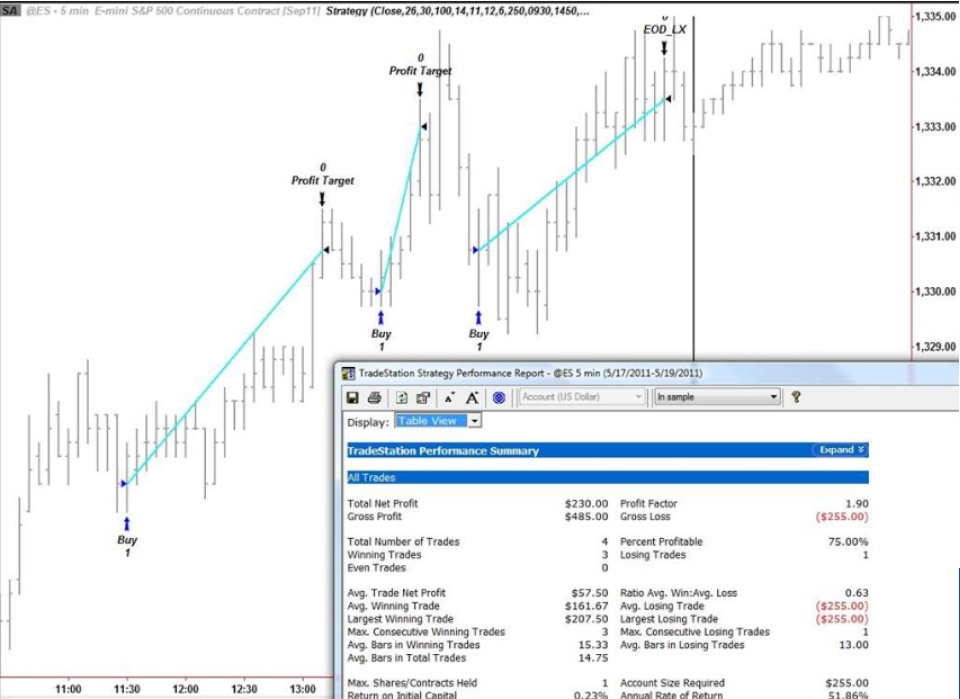
6. Automate the trading orders using trading bots
Traders can also use trading bots which automate the execution of trades based on predefined technical indicators.
This automation offers advantages in terms of speed and emotionless trading, potentially leading to more disciplined crypto trading.
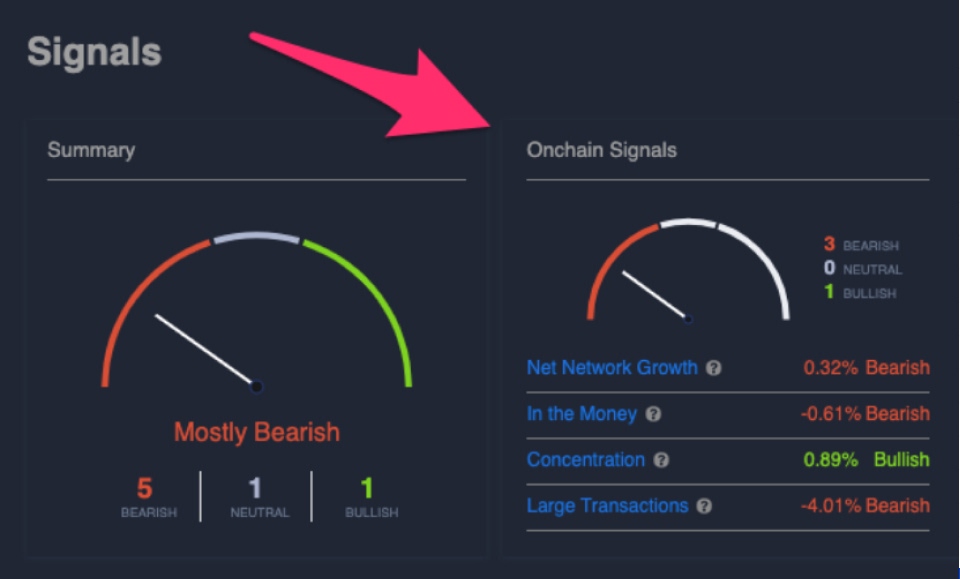
7. Integrate on-chain analysis metrics
On-chain analysis, also known as blockchain analysis, is inspecting the inner workings of a cryptocurrency by examining data directly recorded on its blockchain.
Traders can integrate on-chain analysis metrics to their technical analysis, to get information on metrics like active addresses or transaction volume, which potentially gauges network activity and infer potential price movements.
8. Backtest the technical analysis
Finally, traders should backtest strategies on historical data to assess their effectiveness and identify areas for improvement in the crypto market.
Navigating crypto market risks via technical analysis
The crypto market’s wild price swings demand advanced tools and analysis. By employing advanced indicators, traders can navigate through the crypto market’s price volatility. However, technical indicators can suggest false signals and hence, traders must ensure to use a combination of technical indicators while conducting a technical analysis for more accurate decisions.
Disclaimer: All material published on our website is intended for informational purposes only and should not be considered personal advice or recommendation. As margin FX/CFDs are highly leveraged products, your gains and losses are magnified, and you could lose substantially more than your initial deposit. Investing in margin FX/CFDs does not give you any entitlements or rights to the underlying assets (e.g. the right to receive dividend payments). CFDs carry a high risk of investment loss.