


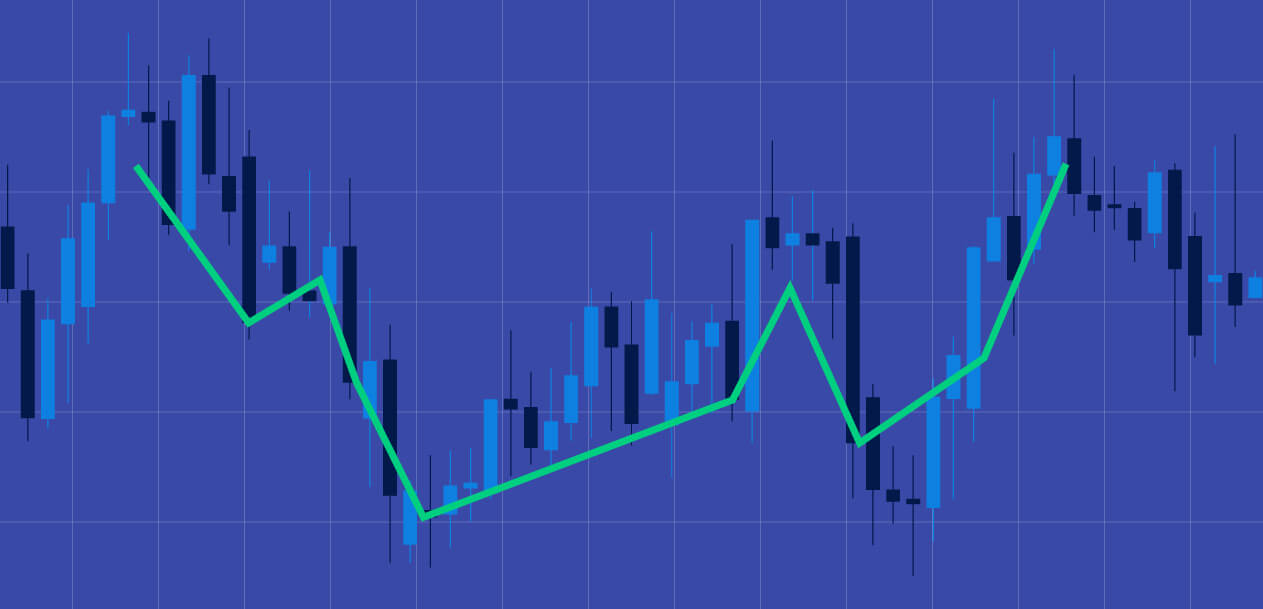
Double (or dual) candlestick patterns are specific movements in the price of a commodity. Each candlestick represents a day’s worth of changes with a commodity. Given that the Forex market tends to swing from time to time during the week, double candlestick patterns are a convenient way to track what kind of trades are happening around it.
Why should I care about this?
One reason: volatility.
Volatile assets tend to move around a lot, and it is in those movements where you can find the most opportunities for profit. Whether you’re buying or selling a currency or commodity, more volatility will almost always equal to more chances for profit, immediate or otherwise. Other reasons (but are not limited to) why you should care about double candlesticks include:
- Allowing adjustments for trading strategies;
- Integrating the changes with your technical analysis charts;
- Monitoring price pips that can affect other commodities;
- Deciding on hedging against or for bullish/bearish markets; and
- Optimizing your next-day trades.
Above all else, double candlestick patterns give Forex traders an important advantage: information. The more information you have, the easier it is to figure out the best time to trade for you.
Types of Double Candlestick patterns
Once you’ve gotten into the habit of analysing candlestick charts, you’ll see a few patterns that crop up regularly throughout the weekly or monthly trading cycle of your asset. Here are the ones that you should be paying attention to:
Engulfing patterns
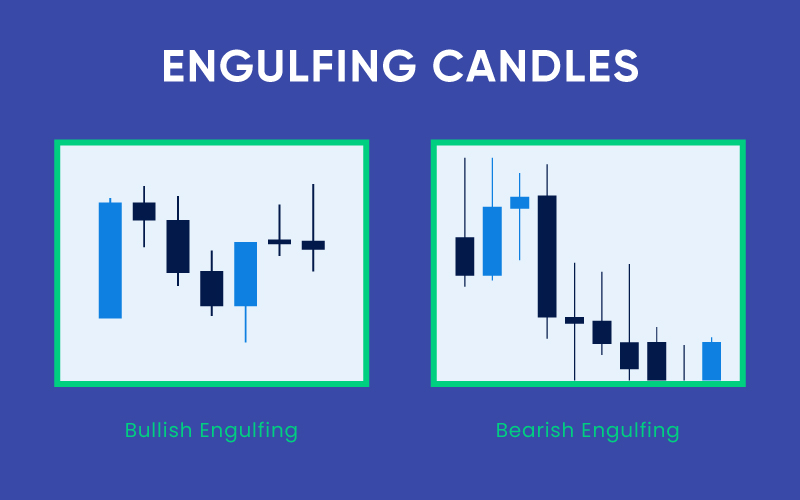
Engulfing patterns is when one candle is engulfed by the succeeding candle (typically it has a larger body and wick) in an upwards or downwards direction. This indicates a major reversal in price, which can be a great opportunity for immediate trades. Engulfing patterns usually indicate on-going price reversals, which gives Forex traders limited, but still considerable, time to act.
Harami patterns
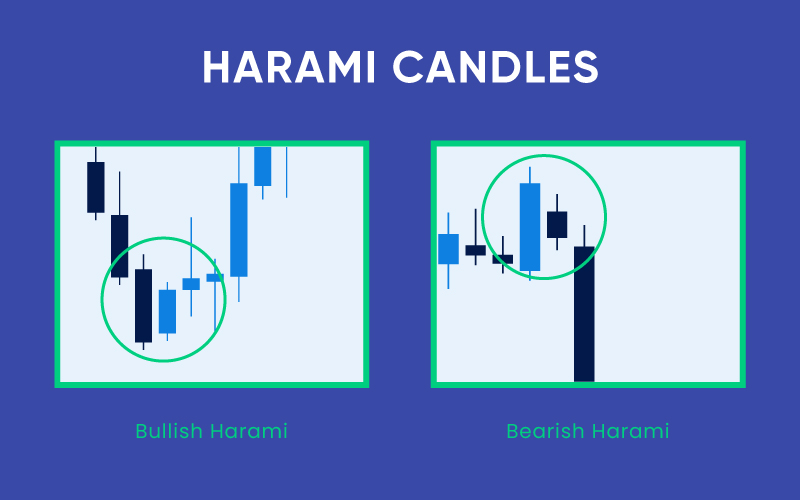
Harami patterns typically indicate a small bubble of sorts that can result in a major price reversal, though the effects aren’t as drastic or immediate as Engulfing candlesticks. These patterns are often read through more than two days, but keen-eyed traders will see the characteristic signs of a Harami pattern and strategise their trades accordingly. These indicate slow but considerable changes to the pricing of a commodity, which can suit certain trading strategies.
Tweezer patterns
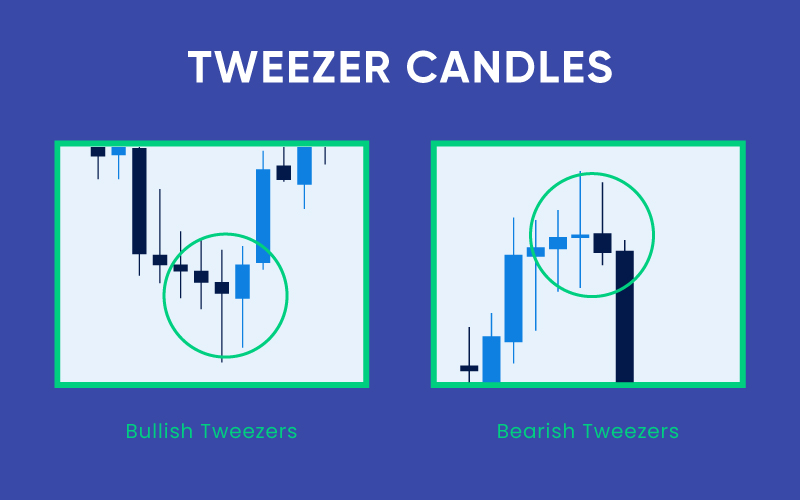
Tweezer patterns are named so because they look almost the same on a candlestick chart, but the second candle being the reverse movement of the first one. This indicates a major price change and is usually seen when a particularly significant economic shift happens to the currency or commodity in question. While Tweezer patterns can come too little too late for certain traders to take advantage of, it is still an excellent bit of data that can help you make smarter trades.
Hammer patterns
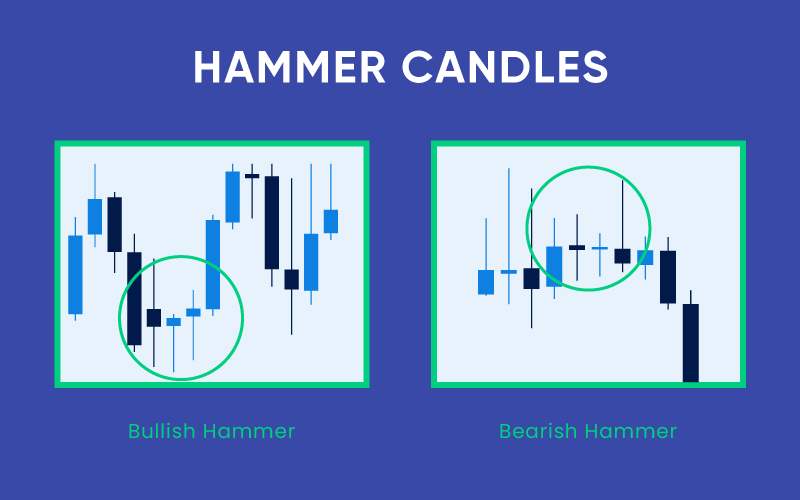
Finally, Hammer patterns are some of the rarest candlesticks you’ll see in forex trading – and you’d be missing out on quite a bit if you don’t pay attention to it. It usually signals a high discrepancy between the opening/closing price of a currency or commodity and its intraday high and low, which signals there is active demand that the market was not able to fulfil that day. While this signals a great opportunity to buy/sell the commodity, you should be careful to not get too carried away with these patterns.
Things to note if using Double Candlestick patterns
One thing to note about using Double Candlestick patterns is that while it is a great indicator of how the price of a currency or commodity may change, it doesn’t always mean that it will change in your favor. Certain trading strategies may call for you to hold out your open positions a little longer if the occasion demands it. This can be the case with Commodities during times of high demand. Since the longer you hold out, the bigger the value of your asset will be. Its technical approach also limits it to Forex trading.
Traders who use fundamental analysis as the primary factor behind their trading strategies may feel limited with the immediate short-term insight that Double Candlestick patterns have. And so, they may choose to ignore major shifts in favor of a long-term profit strategy.
Disclaimer: All material published on our website is intended for informational purposes only and should not be considered personal advice or recommendation. As margin FX/CFDs are highly leveraged products, your gains and losses are magnified, and you could lose substantially more than your initial deposit. Investing in margin FX/CFDs does not give you any entitlements or rights to the underlying assets (e.g. the right to receive dividend payments). CFDs carry a high risk of investment loss.