


📈💼 Get ready for the Forex Week Ahead! Key economic data and events on the horizon, including CPI releases, FOMC meeting minutes, and PMI data. Stay informed, stay agile, and navigate the markets with confidence! #Forex #MarketInsights #TradingStrategies
Watch the video to learn more...
Forex Week Ahead Analysis
The spotlight is on the Canadian dollar as we await the release of the Consumer Price Index (CPI) month-on-month (m/m) data. Projections suggest a potential increase from -0.3% to 0.4%. This data release could provide valuable insights into Canada's inflationary trends, potentially influencing the monetary policy decisions of the Bank of Canada.
Market participants will be closely analyzing the Federal Open Market Committee (FOMC) meeting minutes for any indications regarding discussions about potential rate cuts in the second quarter. The outcome of these discussions could have significant implications for the US dollar and overall market sentiment.
Thursday will be a pivotal day with the release of Manufacturing and Services Purchasing Managers' Index (PMI) data from key economies including Europe, the UK, and the US. These indicators offer crucial insights into the health of the manufacturing and services sectors, which are integral components of economic activity. Any surprises in the data could trigger volatility in the forex market.
USD Index
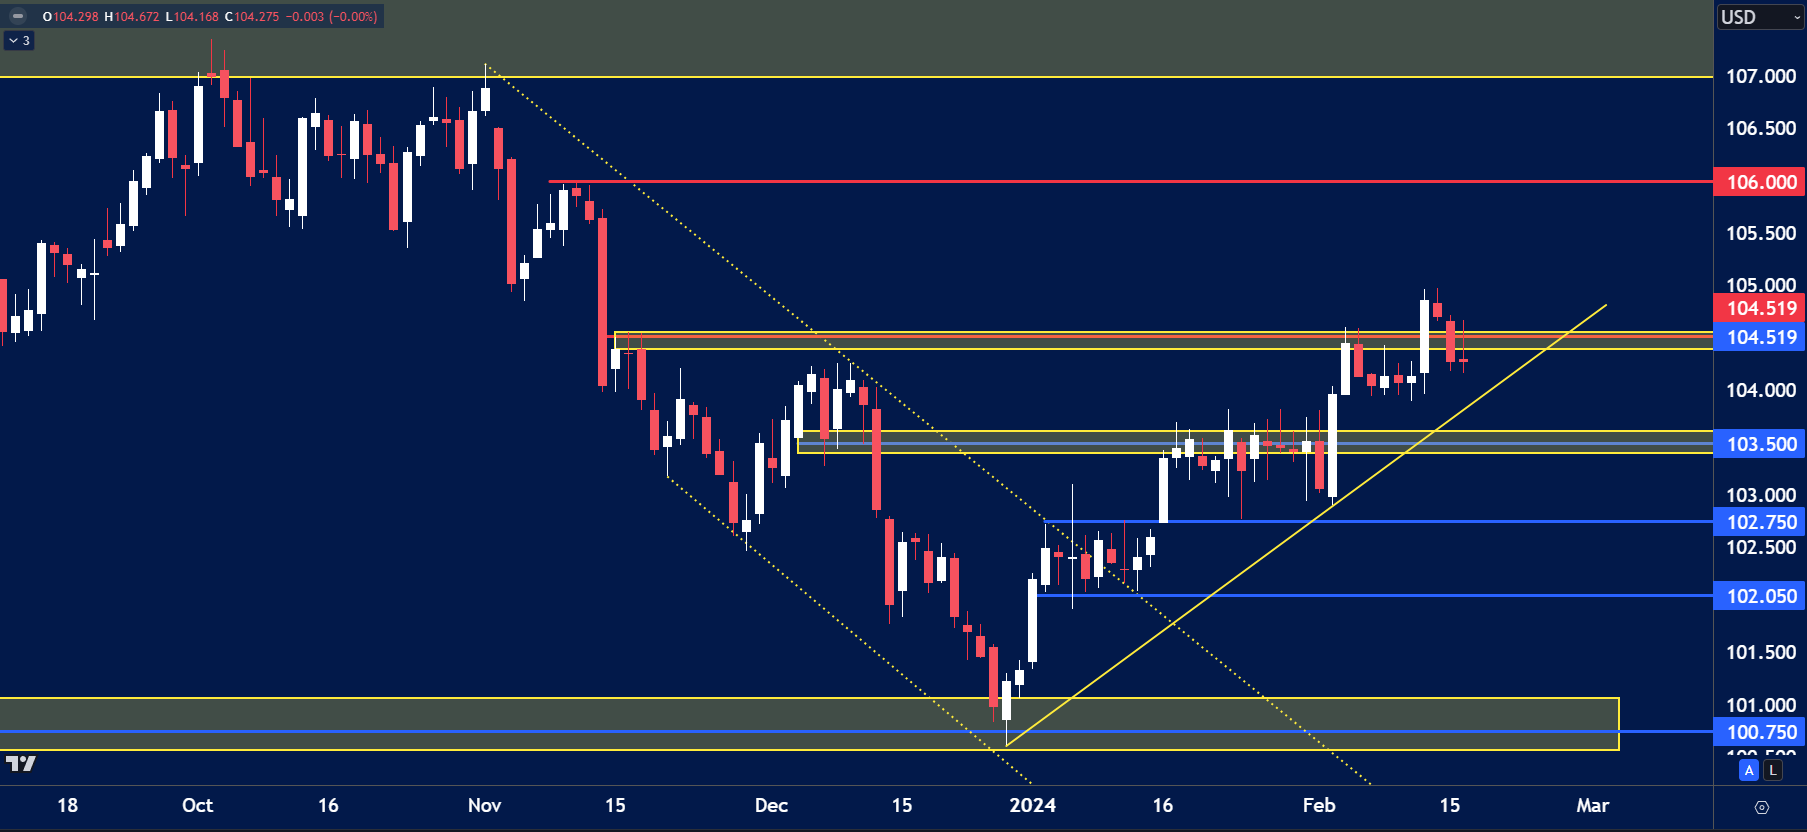
The price on the chart has traded through multiple technical levels and some observations included:
- The USD Index fell back below the key resistance of 104.50 despite breaking this level earlier in the week after stronger CPI data.
- If price fails to trade back above this level, it could trade lower towards 104.00.
- On the other hand a break higher could see price trade towards 106.00.
USD/JPY
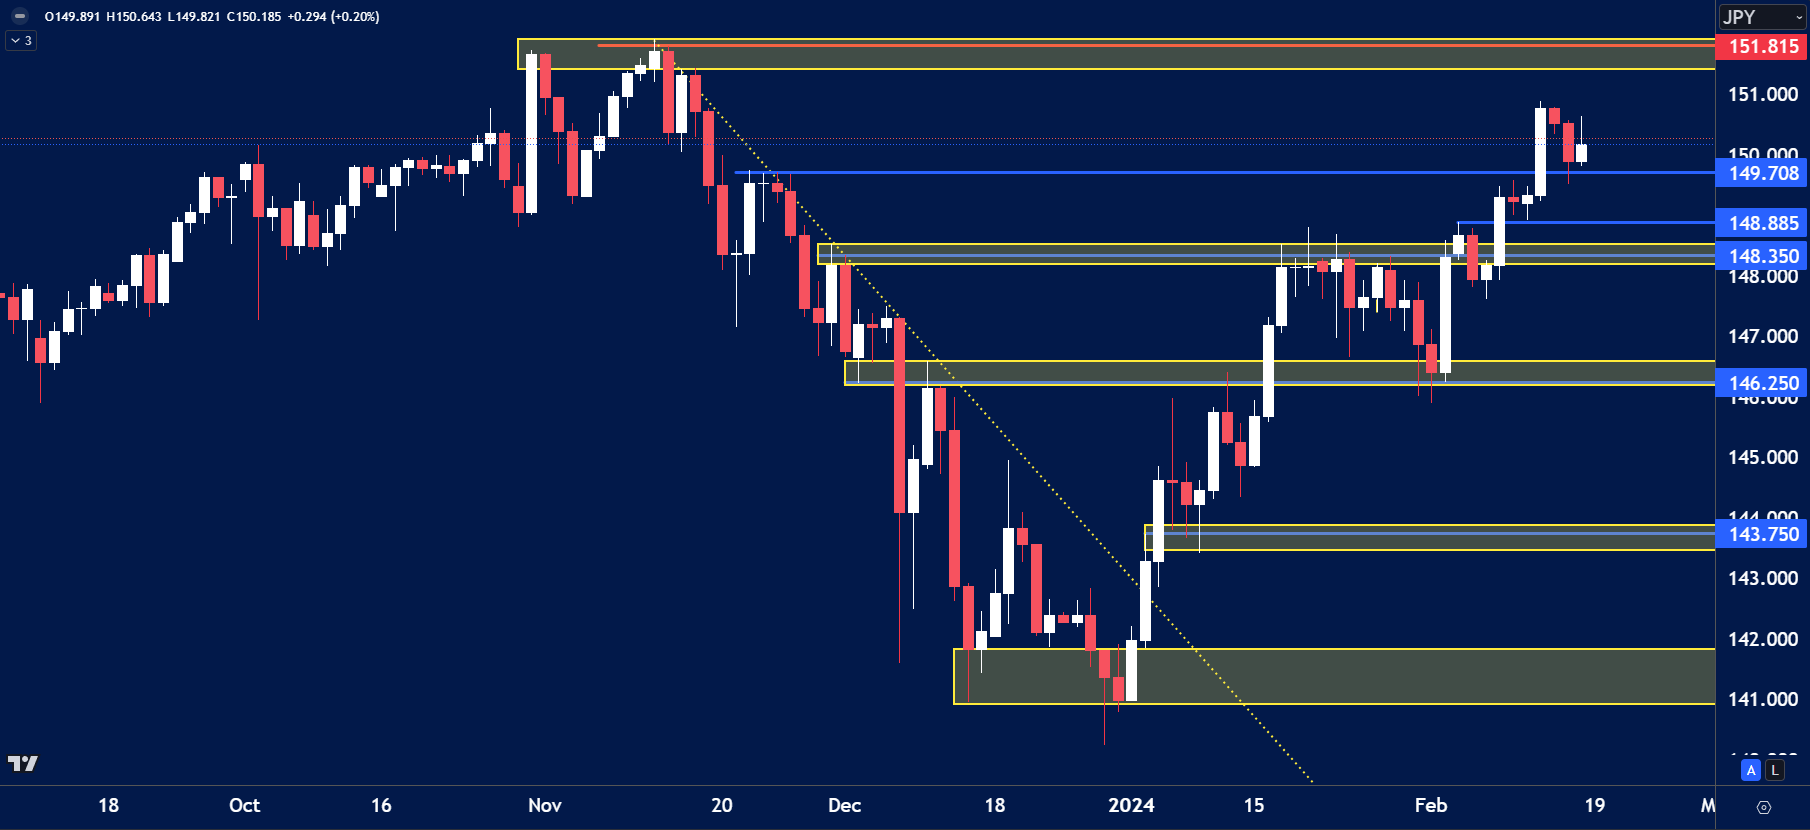
The price on the chart has traded through multiple technical levels and some observations included:
- USDJPY continued to trade higher last week trading through daily highs of 149.70.
- This could see prices continue to trade higher towards the November highs of 151.80.
NZD/USD
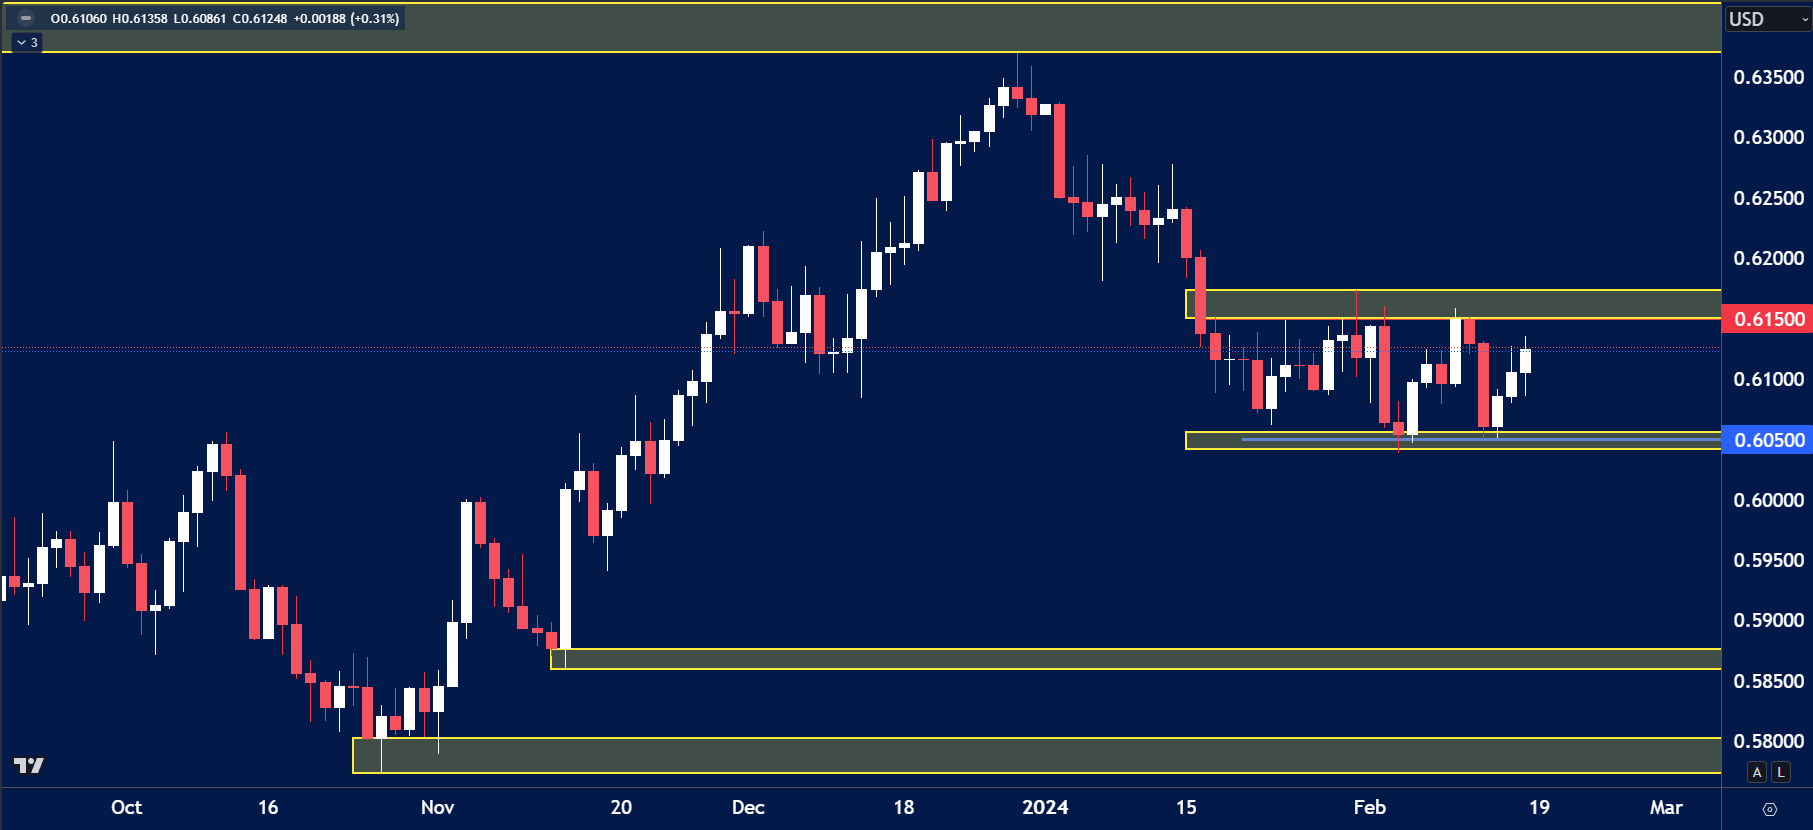
The price on the chart has traded through multiple technical levels and some observations included:
- The daily chart shows price trading within a range between 0.6150 highs and 0.6050 lows.
- Price is approaching range highs where we could either see a bearish rejection or a break depending on USD strength or weakness.
SILVER (XAG/USD)
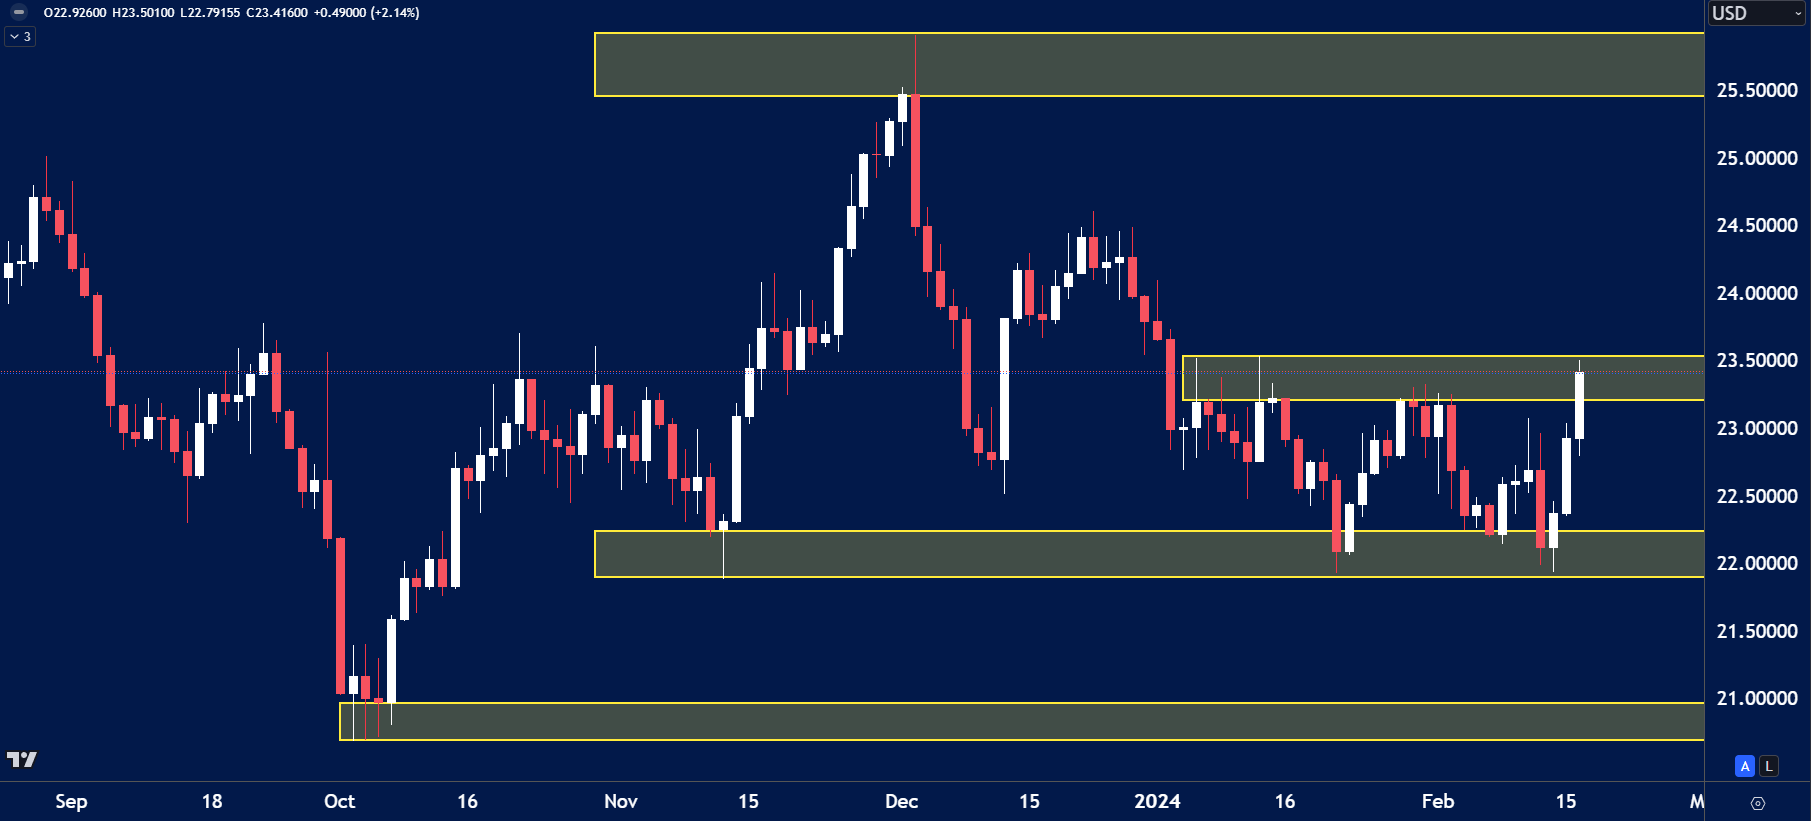
The price on the chart has traded through multiple technical levels and some observations included:
- The price of Silver rebounded from the $22.00 lows as expected.
- Price is now looking to break highs of the $23.50 resistance.
Have you watched our latest video update? You can see it here.
Enjoy low spreads and quick trade executions with a live account. Our highly committed customer support team will assist you with your quick account setup for any future concerns. Start trading with Blueberry.
Disclaimer: All material published on our website is intended for informational purposes only and should not be considered personal advice or recommendation. As margin FX/CFDs are highly leveraged products, your gains and losses are magnified, and you could lose substantially more than your initial deposit. Investing in margin FX/CFDs does not give you any entitlements or rights to the underlying assets (e.g. the right to receive dividend payments). CFDs carry a high risk of investment loss.