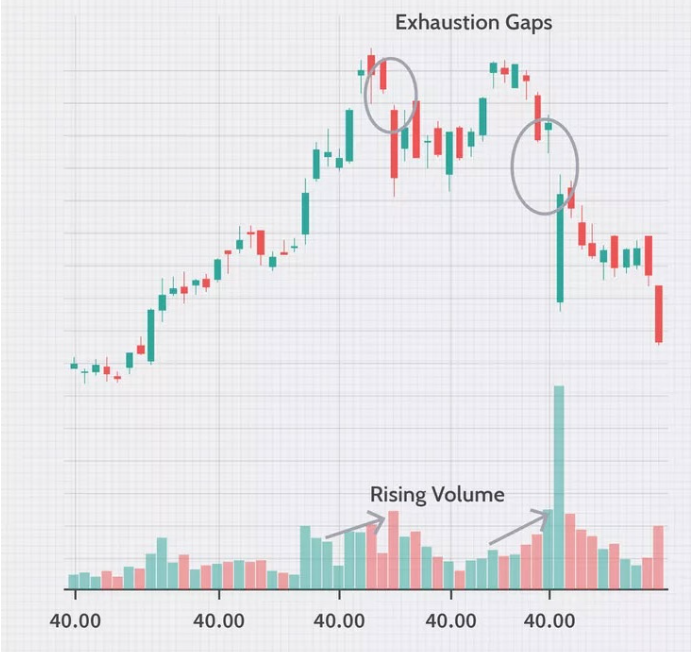
Exhaustion gaps can signal a potential reversal after a strong move in trading. Recognizing them allows traders to adjust positions or exit trades to avoid losses and potentially capitalize on a trend change.
This article will teach us how to trade the final push with exhaustion gaps.
What is an exhaustion gap?

An exhaustion gap is a price break that appears on a forex chart, usually once the market has gained a particular trend momentum (up or down). It is considered a technical signal that the trend may be losing momentum and nearing a potential reversal.
Bearish exhaustion gap occurs when extreme volume starts developing at the end of a strong upward trend
Bullish exhaustion gap pattern occurs at the end of a bearish trend when there is low volume
Here's a breakdown of what exhaustion gap represents and its key characteristics:
- Price gap: A gap on the price chart means there were no trades at prices between the closing price of the previous day and the opening price of the current day
- Trend direction: Exhaustion gaps occur after a period of strong price movement, either an uptrend or downtrend
- Loss of momentum: The gap is interpreted as a sign that the long or short pressure that was driving the trend may be turning weak
- Potential trend reversals: While not a confirmed prediction, exhaustion gap trading often suggests a possible change in trend direction
Identifying an exhaustion gap
Analyze the overall trend
Begin by establishing the prevailing trend direction on the price chart. Exhaustion gaps typically occur after a period of significant price movement. Understanding the established trend allows for a more informed interpretation of the gap's potential significance.
Identify a significant gap
A key characteristic of an exhaustion gap is the presence of a clear gap on the price chart. The magnitude of the gap can be relevant, with larger gaps potentially indicating a stronger signal.
Confirm with high trading volume
The presence of high trading volume accompanying an exhaustion gap strengthens the potential for a trend reversal. A surge in volume suggests a significant increase in long or short pressure, which may be nearing exhaustion after the preceding strong price move. High volume during the gap formation period strengthens the notion that the previous trend's momentum might be waning.
Look for reversal candlestick patterns
Reversal candlestick patterns around the exhaustion gap can lead to a possibility of a trend change. These patterns, such as bearish engulfing patterns following an uptrend, depict a potential reversal. The formation of such patterns with the exhaustion gap patterns provides a stronger chance of a trend reversal.
Consider recent news or events
Sudden news events or policy announcements can, on occasion, trigger the formation of exhaustion gaps. Understanding the broader market context surrounding the gap's emergence is crucial. If the gap coincides with significant external events, it helps to assess whether the gap reflects a genuine exhaustion of the trend or simply a reaction to external factors.
Monitor subsequent price action
The price action following the formation of an exhaustion gap is a critical observation point. If the price immediately reverses course or the established trend persists for a while longer, traders should closely monitor the price behavior after the gap occurs to determine if the gap is confirmed by a reversal or if it proves to be a false signal.
Identify diverging momentum indicators
In some instances, a divergence between price action and technical indicators, such as moving averages, can emerge. Suppose the price makes a new high after the gap but the moving average fails to follow suit. In that case, it suggests a weakening of momentum, potentially supporting the exhaustion gap theory.
Assess market sentiment
The overall market sentiment prevailing at the time of the exhaustion gap's formation can provide valuable context. A gap appearing in a market already exhibiting signs of weakness might be a more compelling reversal signal than one occurring in a bullish trend. Assessing the broader market sentiment allows for a broader interpretation of the exhaustion gap's potential significance.
How to trade with an exhaustion gap
1. Confirm the exhaustion gap
The first step is to definitively identify an exhaustion gap on the price chart. This involves verifying a clear gap between the previous day's closing price and the current day's opening price, accompanied by no trading activity within that gap.
2. Analyze the gap's position
Examine the gap's location within the prevailing trend. Exhaustion gaps are more likely to be significant after a strong uptrend or downtrend, suggesting potential exhaustion of trading pressure.
3. Identify reversal signals
Look for the presence of reversal candlestick patterns, such as bearish engulfing patterns after an uptrend or bullish engulfing patterns after a downtrend, which visually suggest a potential shift in dominance between traders.
4. Use technical indicators
Complement the analysis with technical indicators like the RSI or Stochastic Oscillator. If these indicators are nearing overbought (uptrend) or oversold (downtrend) territory near the gap, it strengthens the case for a potential reversal.
5. Set entry points
Based on the technical analysis and risk tolerance, determine potential entry points for a trade that aligns with the anticipated reversal direction (short for downtrend continuation or long for uptrend reversal).
6. Implement stop-loss orders
Always place stop-loss orders to manage risk and limit potential losses if the price action contradicts expectations.
7. Set gain targets
Establish realistic gain targets based on the technical analysis and risk management strategy. Consider factors like historical price movements and potential resistance/support levels.
8. Monitor trade progress
Continuously monitor the trade's progress and be prepared to adjust strategy as needed. Observe how the price reacts to the exhaustion gap and surrounding technical indicators.
9. Adjust or exit the trade
If the price confirms the reversal signal, the trade might be accurate. However, if the price action contradicts expectations or reaches the trader's gain targets, be prepared to adjust the position size or exit the trade entirely.
The runaway or breakaway gap: what's the difference?

Formation
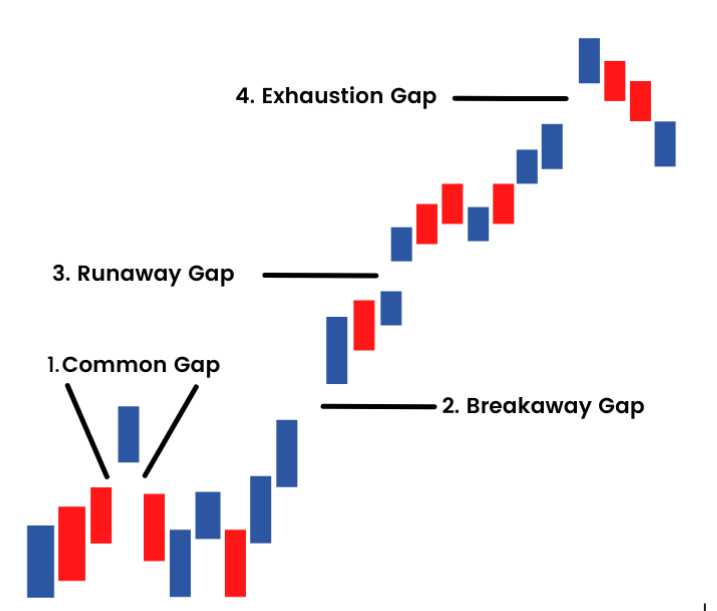
A breakaway gap occurs when the price breaks through a well-defined support or resistance level on the chart, leaving a gap between the previous trading range and the new price level. This signifies a surge in entry or exit pressure that overcomes the previous price barrier.
On the other hand, a runaway gap appears within an established trend, either an uptrend or a downtrend. The price gaps away from the recent trading range, continuing the prevailing trend with increased momentum.
Trend context
Breakaway gaps occur at the beginning of a new trend, either upwards (upward trend breakout) or downwards (downtrend breakout). They suggest a potential trend acceleration as the price decisively moves beyond a key level.
Whereas, runaway gaps typically occur during a strong uptrend or downtrend. They suggest that the trend is gaining additional strength and momentum, with bulls or bears firmly in control.
Confirmation
Confirmation for breakaway gaps often comes from the high trading volume accompanying the gap formation. This signifies increased market participation supporting the breakout. Whereas, confirmation for runaway gaps can come from various factors, including sustained high trading volume, continuation of the trend after the gap, and potentially reaching new highs/lows for the trend.
Demystifying opportunities and challenges of exhaustion gaps
Exhaustion gaps can signal a potential shift in momentum, allowing traders to exit positions aligned with the losing trend or identify entry points for the anticipated reversal. However, they are not foolproof indicators. The trend may continue after the gap, leading to losses if a trade is based solely on the gap. Hence, traders should combine them with other technical indicators and fundamental analysis for a more comprehensive trading picture.
Disclaimer: All material published on our website is intended for informational purposes only and should not be considered personal advice or recommendation. As margin FX/CFDs are highly leveraged products, your gains and losses are magnified, and you could lose substantially more than your initial deposit. Investing in margin FX/CFDs does not give you any entitlements or rights to the underlying assets (e.g. the right to receive dividend payments). CFDs carry a high risk of investment loss.


