


Advanced MT5 indicators provide deeper insights into market dynamics by offering expert-level analytical capabilities, such as multi-timeframe analysis and advanced chart patterns. They uncover hidden trading patterns and trends, giving traders a competitive edge.
This blog will discuss the top advanced technical analysis strategies with MT5 indicators.
How to conduct technical analysis with MT5 indicators
Conducting technical analysis with MT5 indicators involves using built-in tools to assess market trends. Traders can access various indicators on MT5, such as moving averages, MACD, RSI, and Bollinger Bands, by selecting the Insert menu and navigating to Indicators. These indicators help visualize price movements, identify the direction of the trend, and spot potential entry and exit price levels.
To add an indicator, click on a chart, choose Indicators, and customize the settings to fit your analysis. MT5 allows multiple indicators on a single chart, enabling more comprehensive analysis. The platform's customizable properties let traders fine-tune the display of indicators, including color and line style, to enhance clarity.
Additionally, MT5 supports custom indicators, allowing advanced users to upload or program their own tools for personalized strategies.
*This is an example only to enhance a consumer's understanding of the strategy being described above and is not to be taken as Blueberry providing personal advice.
Top advanced indicators available on MT5
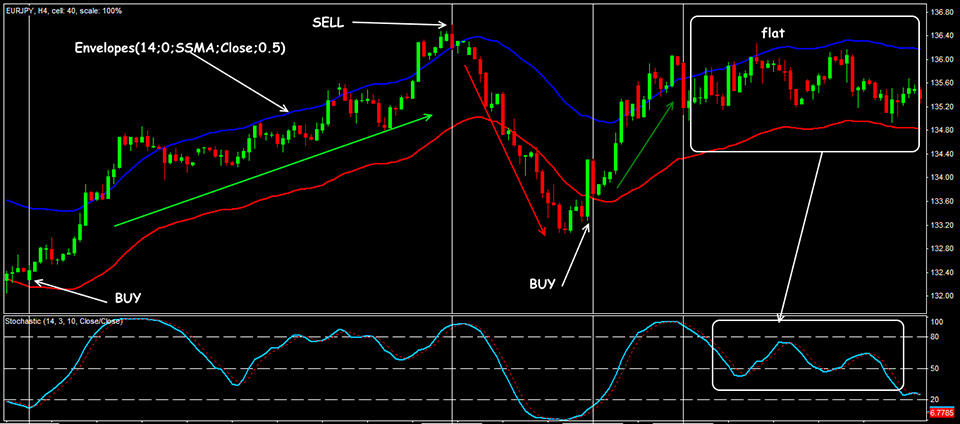
Envelope
The Envelope indicator plots two moving average lines around the price chart at a set distance, creating an upper and lower band. These bands help traders identify overbought or oversold conditions, signaling potential reversal points when the price touches or breaches these lines.
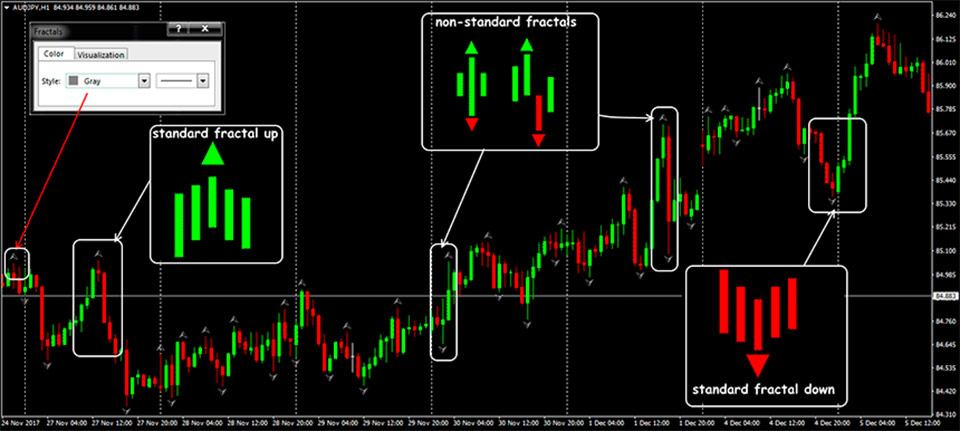
Fractals
Fractals are reversal patterns consisting of five bars, where the middle bar is the highest or lowest point. MT5 marks these patterns on the chart, helping traders spot potential turning points in the market. They are often used in conjunction with other indicators to confirm trend changes.
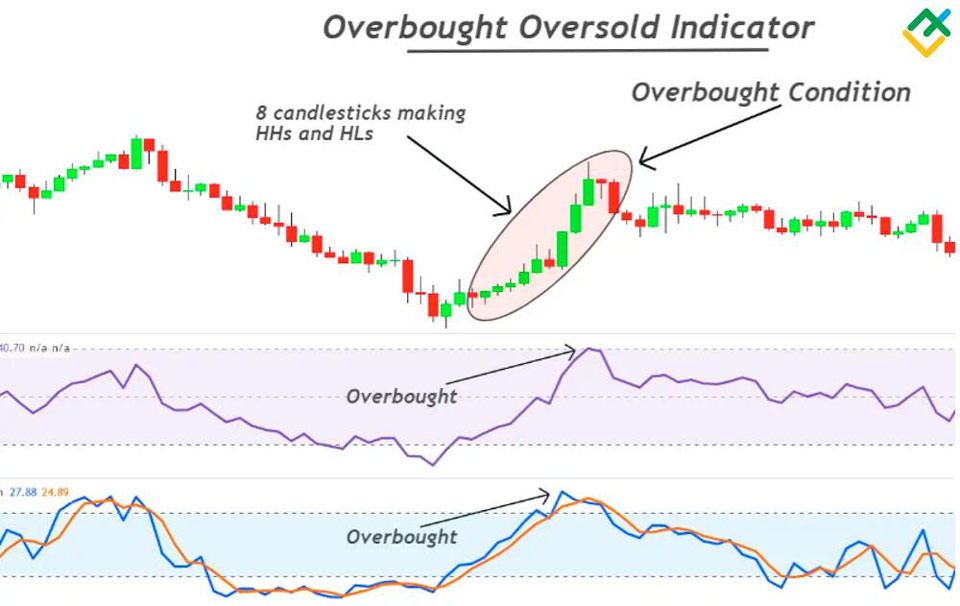
DeMarker indicator
The DeMarker indicator helps identify potential price exhaustion points, signaling when an asset is overbought or oversold. Values above 0.7 indicate an overbought condition, while values below 0.3 suggest oversold levels, aiding in timing entry and exit points.
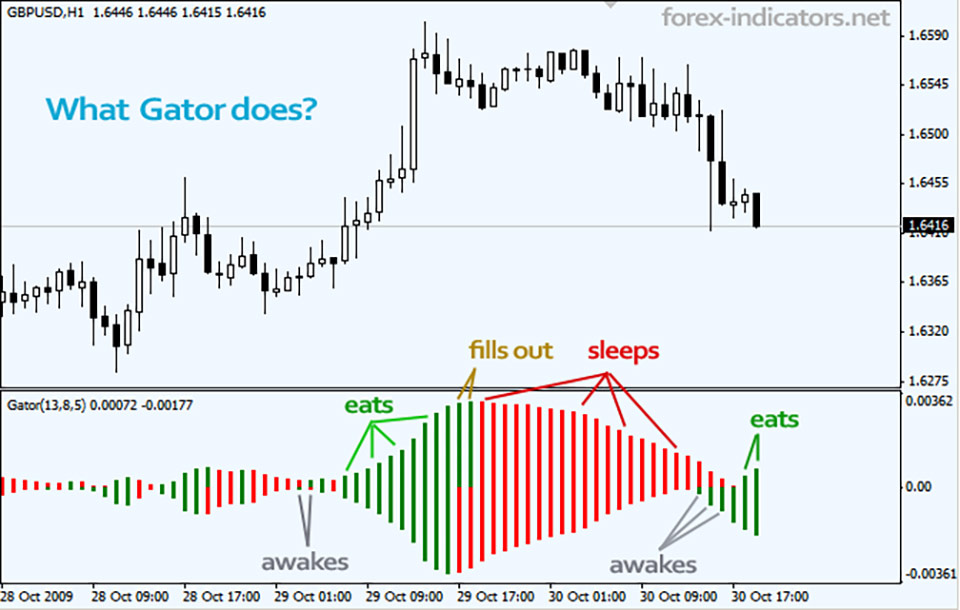
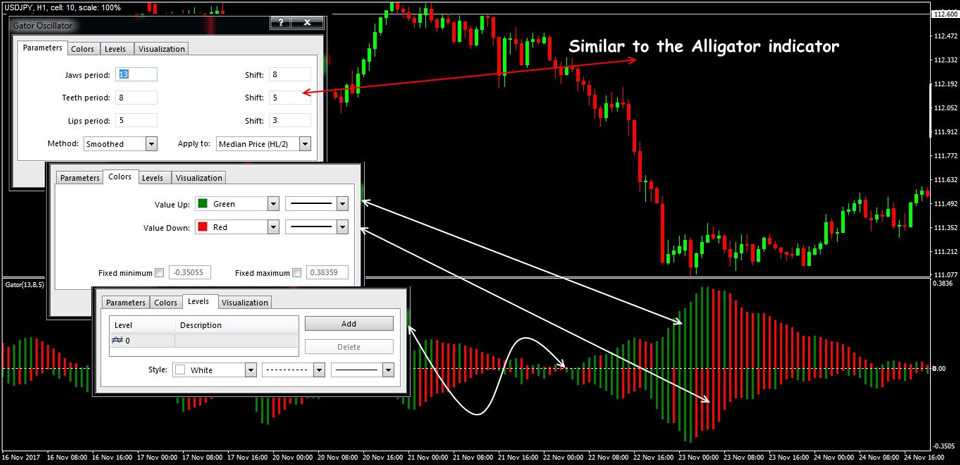
Gator oscillator
The Gator oscillator complements the Alligator indicator and it helps visualize the convergence and divergence of its three moving averages. It consists of positive and negative bars that indicate the trend's awakening or sleeping state, enabling traders to identify when a trend is weakening or strengthening.
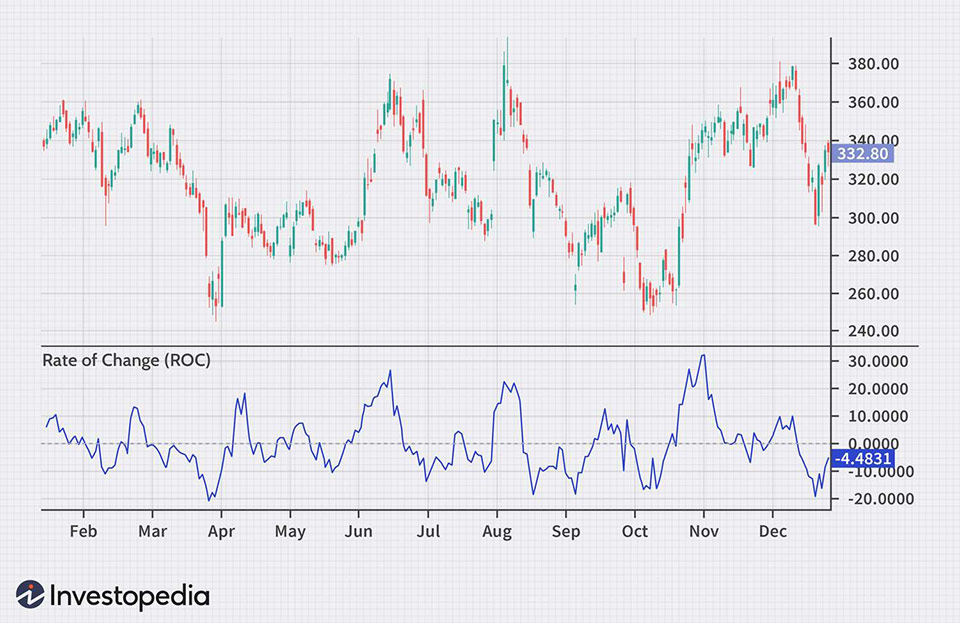
Rate of Change (ROC)
The ROC indicator measures the percentage price change between the current and the previous period. Positive values signal upward momentum, while negative values indicate downward momentum. ROC helps traders understand the strength of trends and identify possible reversals.
Detrended Price Oscillator (DPO)
The DPO removes long-term trends from the price to highlight shorter-term cycles. This makes it easier for traders to identify price patterns and potential turning points without the influence of overall market direction.
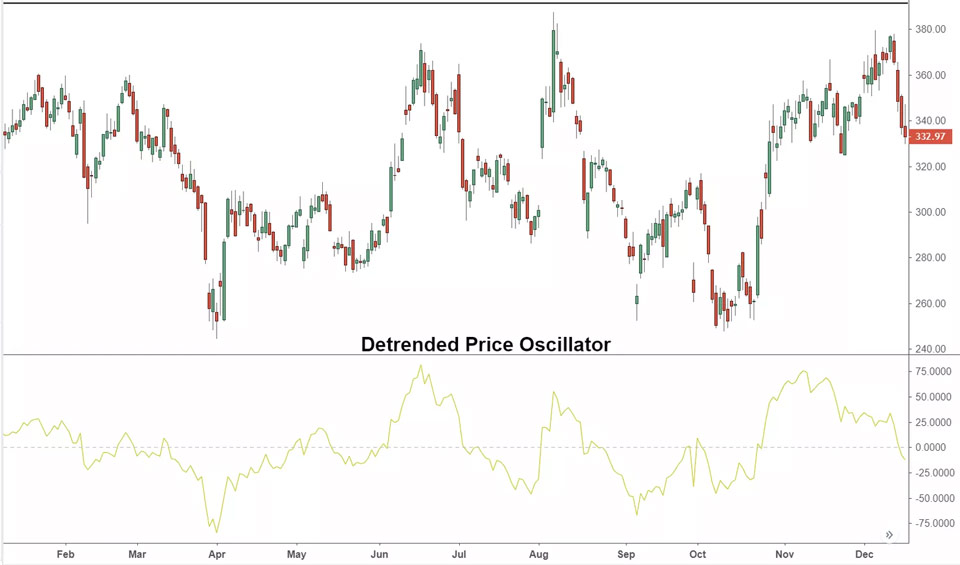
image source
Chaikin oscillator
The Chaikin oscillator is derived from the A/D (accumulation/distribution) line and measures the momentum of the accumulation/distribution. Positive values indicate entry pressure, while negative values signal exit pressure. It helps traders spot divergences between price and momentum for potential trend reversals.
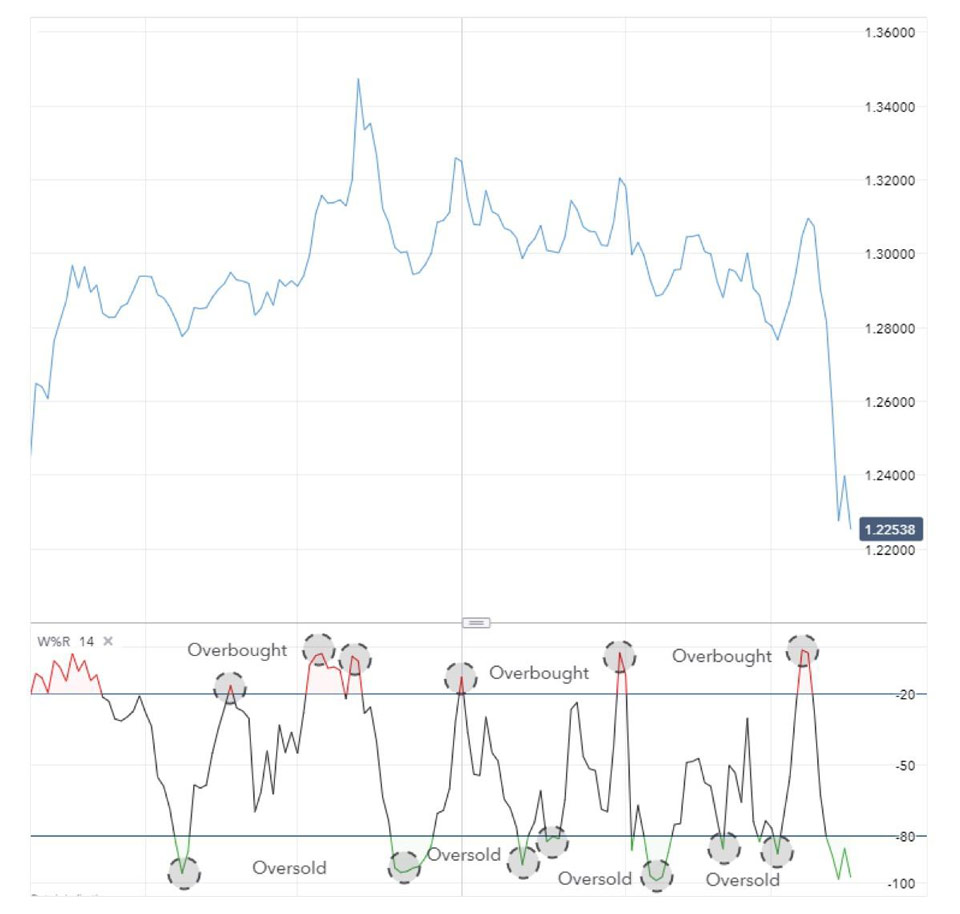
Williams %R is a momentum indicator that shows the current closing price with respect to the high-low range over a specific period. It ranges from 0 to -100, with readings above -20 indicating overbought conditions and below -80 signaling oversold levels. This helps traders time entry and exit points.
Top strategies for combining MT5 indicators
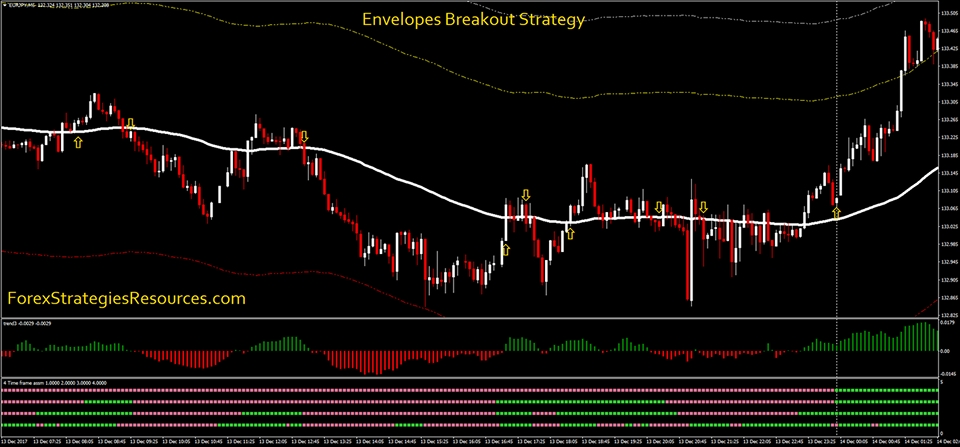
Envelope breakout and fractals confirmation strategy
This strategy uses envelopes to detect potential price breakouts and fractals for confirmation. Traders plot Envelopes to create dynamic support and resistance bands. When the price breaks through the upper or lower envelope, it signals a potential breakout.
Confirmation comes from fractals, with a bullish fractal above the breakout level confirming a long signal and a bearish fractal below confirming a short signal. This approach helps traders catch strong breakout moves while filtering false signals with fractal validation.
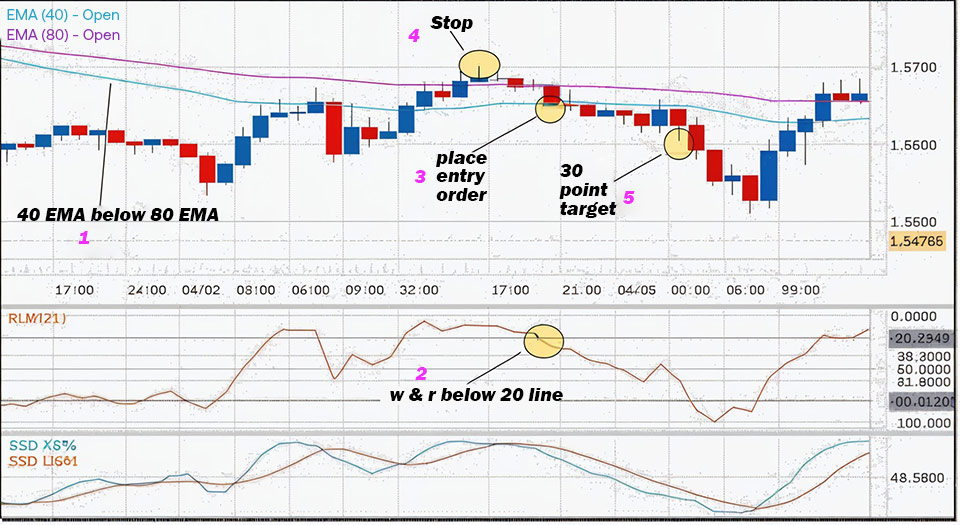
DeMarker and Williams %R overbought/oversold reversal strategy
This strategy combines the DeMarker indicator with Williams %R to identify overbought or oversold conditions. Traders watch for the DeMarker to cross above 0.7 (overbought) or below 0.3 (oversold) levels.
For stronger confirmation, they look at the Williams %R to align with these signals, with values above -20 indicating overbought and below -80 showing oversold. When both indicators align, traders anticipate a potential price reversal and execute trades accordingly. This dual-indicator setup enhances reliability by capturing turning points in market momentum.
Gator oscillator and ROC trend continuation strategy
The Gator oscillator helps identify trend strength and direction, while the ROC confirms momentum. When the Gator oscillator shows widening bars (indicating an active trend), traders check if the ROC is positive and rising, signaling increasing momentum in the trend's direction.
A long signal is triggered when the Gator shows an active trend, and the ROC confirms bullish momentum. Conversely, a short signal is activated when the Gator supports a downtrend, and the ROC confirms negative momentum. This strategy allows traders to confidently participate in sustained trends.
DPO and Chaikin oscillator divergence strategy
This strategy uses the Detrended Price Oscillator (DPO) to spot divergence in price movements and the Chaikin oscillator to confirm momentum. Traders look for prices to make higher highs while the DPO makes lower highs (or vice versa), signaling a weakening trend.
The Chaikin oscillator is then checked for corresponding momentum changes to validate the divergence. If it aligns, traders anticipate a trend reversal and enter a position. This strategy helps identify potential turning points with a dual confirmation approach, enhancing entry precision.
Trading forex on MT5 with advanced indicators
Advanced MT5 indicators improve trend identification and momentum analysis. They help filter market noise and spot key signals.
However, relying too heavily on them can lead to false signals, especially in volatile markets. Beginners may also find interpreting multiple indicators challenging, risking delays or confusion. To overcome these challenges, traders should combine indicators with risk management strategies.
Disclaimer: All material published on our website is intended for informational purposes only and should not be considered personal advice or recommendation. As margin FX/CFDs are highly leveraged products, your gains and losses are magnified, and you could lose substantially more than your initial deposit. Investing in margin FX/CFDs does not give you any entitlements or rights to the underlying assets (e.g. the right to receive dividend payments). CFDs carry a high risk of investment loss.