If traders want to understand and confirm the market trend direction, they can use the advance-decline line market breadth indicator. It also helps traders spot reversals and confirm signals from other indicators.
In this article, we will discuss the advance-decline line in detail.
*This is an example only to enhance a consumer's understanding of the strategy being described above and is not to be taken as Blueberry providing personal advice.
What is the advance-decline line?
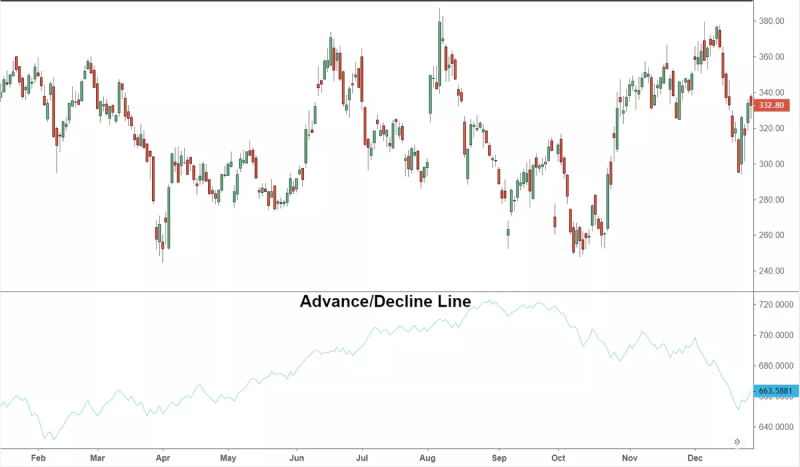
The advance-decline (A/D) line is a market breadth indicator that assesses the overall market direction. It tracks the cumulative difference between the number of advancing (rising) stocks/currency pairs and declining (falling prices) stocks/currency pairs. This is how the A/D line works –
- The trader counts the number of stocks/currency pairs whose prices have increased and decreased during each trading day.
- The trader then subtracts the number of falling prices stocks/currency pairs from the number of rising prices stocks/currency pairs to get the daily net advance or decline value.
- Finally, the trader adds the daily net difference to the previous cumulative total to create the AD line.
A rising A/D line suggests that more currency pairs are witnessing rising prices than falling prices, indicating a bullish market sentiment. The opposite is suggested with a falling A/D line.

Signal confirmations: What indicators to combine with the Advance-Decline Line
Cumulative volume index
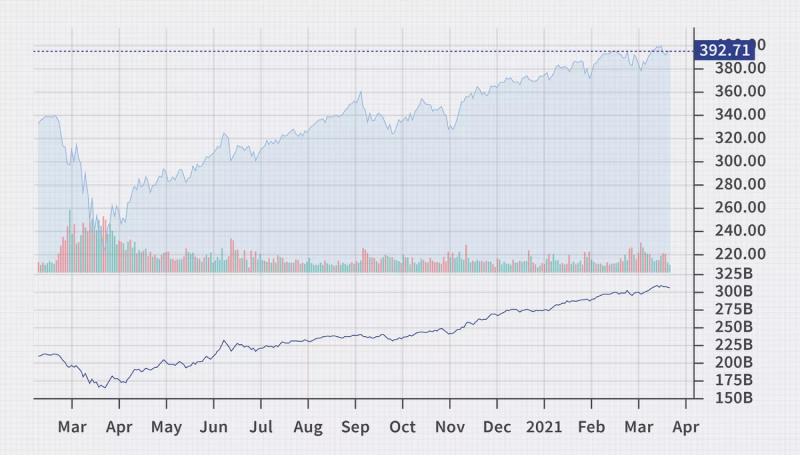
The Cumulative Volume Index (CVI) tracks the cumulative volume of advancing and declining currency pairs. It adds weight to the volume associated with each advance or decline. Traders can compare the CVI with the A/D line to understand the strength of the market trend.
If both CVI and A/D lines are rising, it indicates a strong uptrend. On the other hand, if the CVI is falling while the A/D line is increasing, it means a weakening market breadth.

New high-new low index
The new high-new low index tracks the number of new 52-week highs and lows of the asset to understand its market trend strength. Traders can combine the new high-new low index with the A/D line to confirm the market direction.
If both indicators are rising with an increase in new highs, it indicates a bullish trend. Conversely, if the new high-new low index shows more lows with a rising A/D line, it indicates weak market strength.

Percentage of stocks above moving average
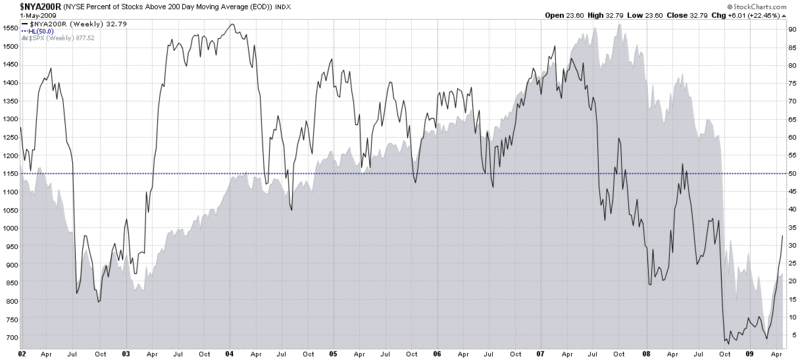
The percentage of stocks above the moving average measures how many stocks are trading above the specified moving average. This reflects the overall strength of the market.
Traders can use this percentage with the A/D line to confirm market trends. A high percentage of stocks above a moving average and rising A/D line confirms a strong bullish trend, and vice versa. Any divergence between this indicator and the A/D line signals potential market reversals.

How to use the advance-decline line to trade
Identify the A/D line trend
The first step is to track the direction of the A/D line to determine the market trend. Align the trading strategy with the A/D line’s trend. For example, consider long positions in a rising A/D line and short positions in a declining trend.
Compare the A/D line with the market index
Compare the A/D line's performance with that of a major market index (such as the USDX). The A/D Line should follow the same direction as the index.
- If the index is rising and the A/D line is also rising, it confirms the strength of the bullish trend
- If the index is rising while the A/D line is falling, it may indicate weakness or a potential reversal
Spot A/D line divergences
The next step is to look for divergences between the A/D line and the market index. A divergence occurs when the A/D line moves in the opposite direction of the market index.
Use divergences as signals for potential market reversals. For instance, if the market index reaches new highs but the A/D line does not, it could signal a weakening trend and possible correction.
Integrate A/D line with other breadth indicators
Combine the A/D line with other breadth indicators like the CVI to gain a broader market breadth view.
Time entries and exits with A/D line signals
Use changes in the A/D line to time the trades. An increasing A/D line can signal entering long positions, while a decreasing A/D line can suggest exiting or shorting.
Monitor A/D line for daily shifts in market breadth
Track daily changes in the A/D line to analyze market breadth and sentiment shifts. Significant daily movements in the A/D line can indicate short-term changes in market sentiment, enabling traders to adjust their positions or manage risk.
*This is an example only to enhance a consumer's understanding of the strategy being described above and is not to be taken as Blueberry providing personal advice.
Top tips for trading forex with the A/D line
- Combine A/D line analysis with crucial support and resistance levels. A rising A/D line near support or a falling A/D line near resistance can provide stronger trade signals
- Pay attention to changes in the volume associated with advances and declines. Significant volume increases in the direction of the A/D line trend can reinforce trading decisions
- Set alerts for when the A/D line exceeds or moves below its moving average. Crossovers can signal potential entry or exit points based on the changing market breadth
Entering rising and falling markets with the A/D line
The A/D line provides insight into market strength. However, the A/D lie may not account for volatility specific to forex markets and can be less effective in highly dynamic or low-volume conditions. Hence, traders should combine other indicators with the A/D line for confirmed market signals.
Disclaimer: All material published on our website is intended for informational purposes only and should not be considered personal advice or recommendation. As margin FX/CFDs are highly leveraged products, your gains and losses are magnified, and you could lose substantially more than your initial deposit. Investing in margin FX/CFDs does not give you any entitlements or rights to the underlying assets (e.g. the right to receive dividend payments). CFDs carry a high risk of investment loss.


