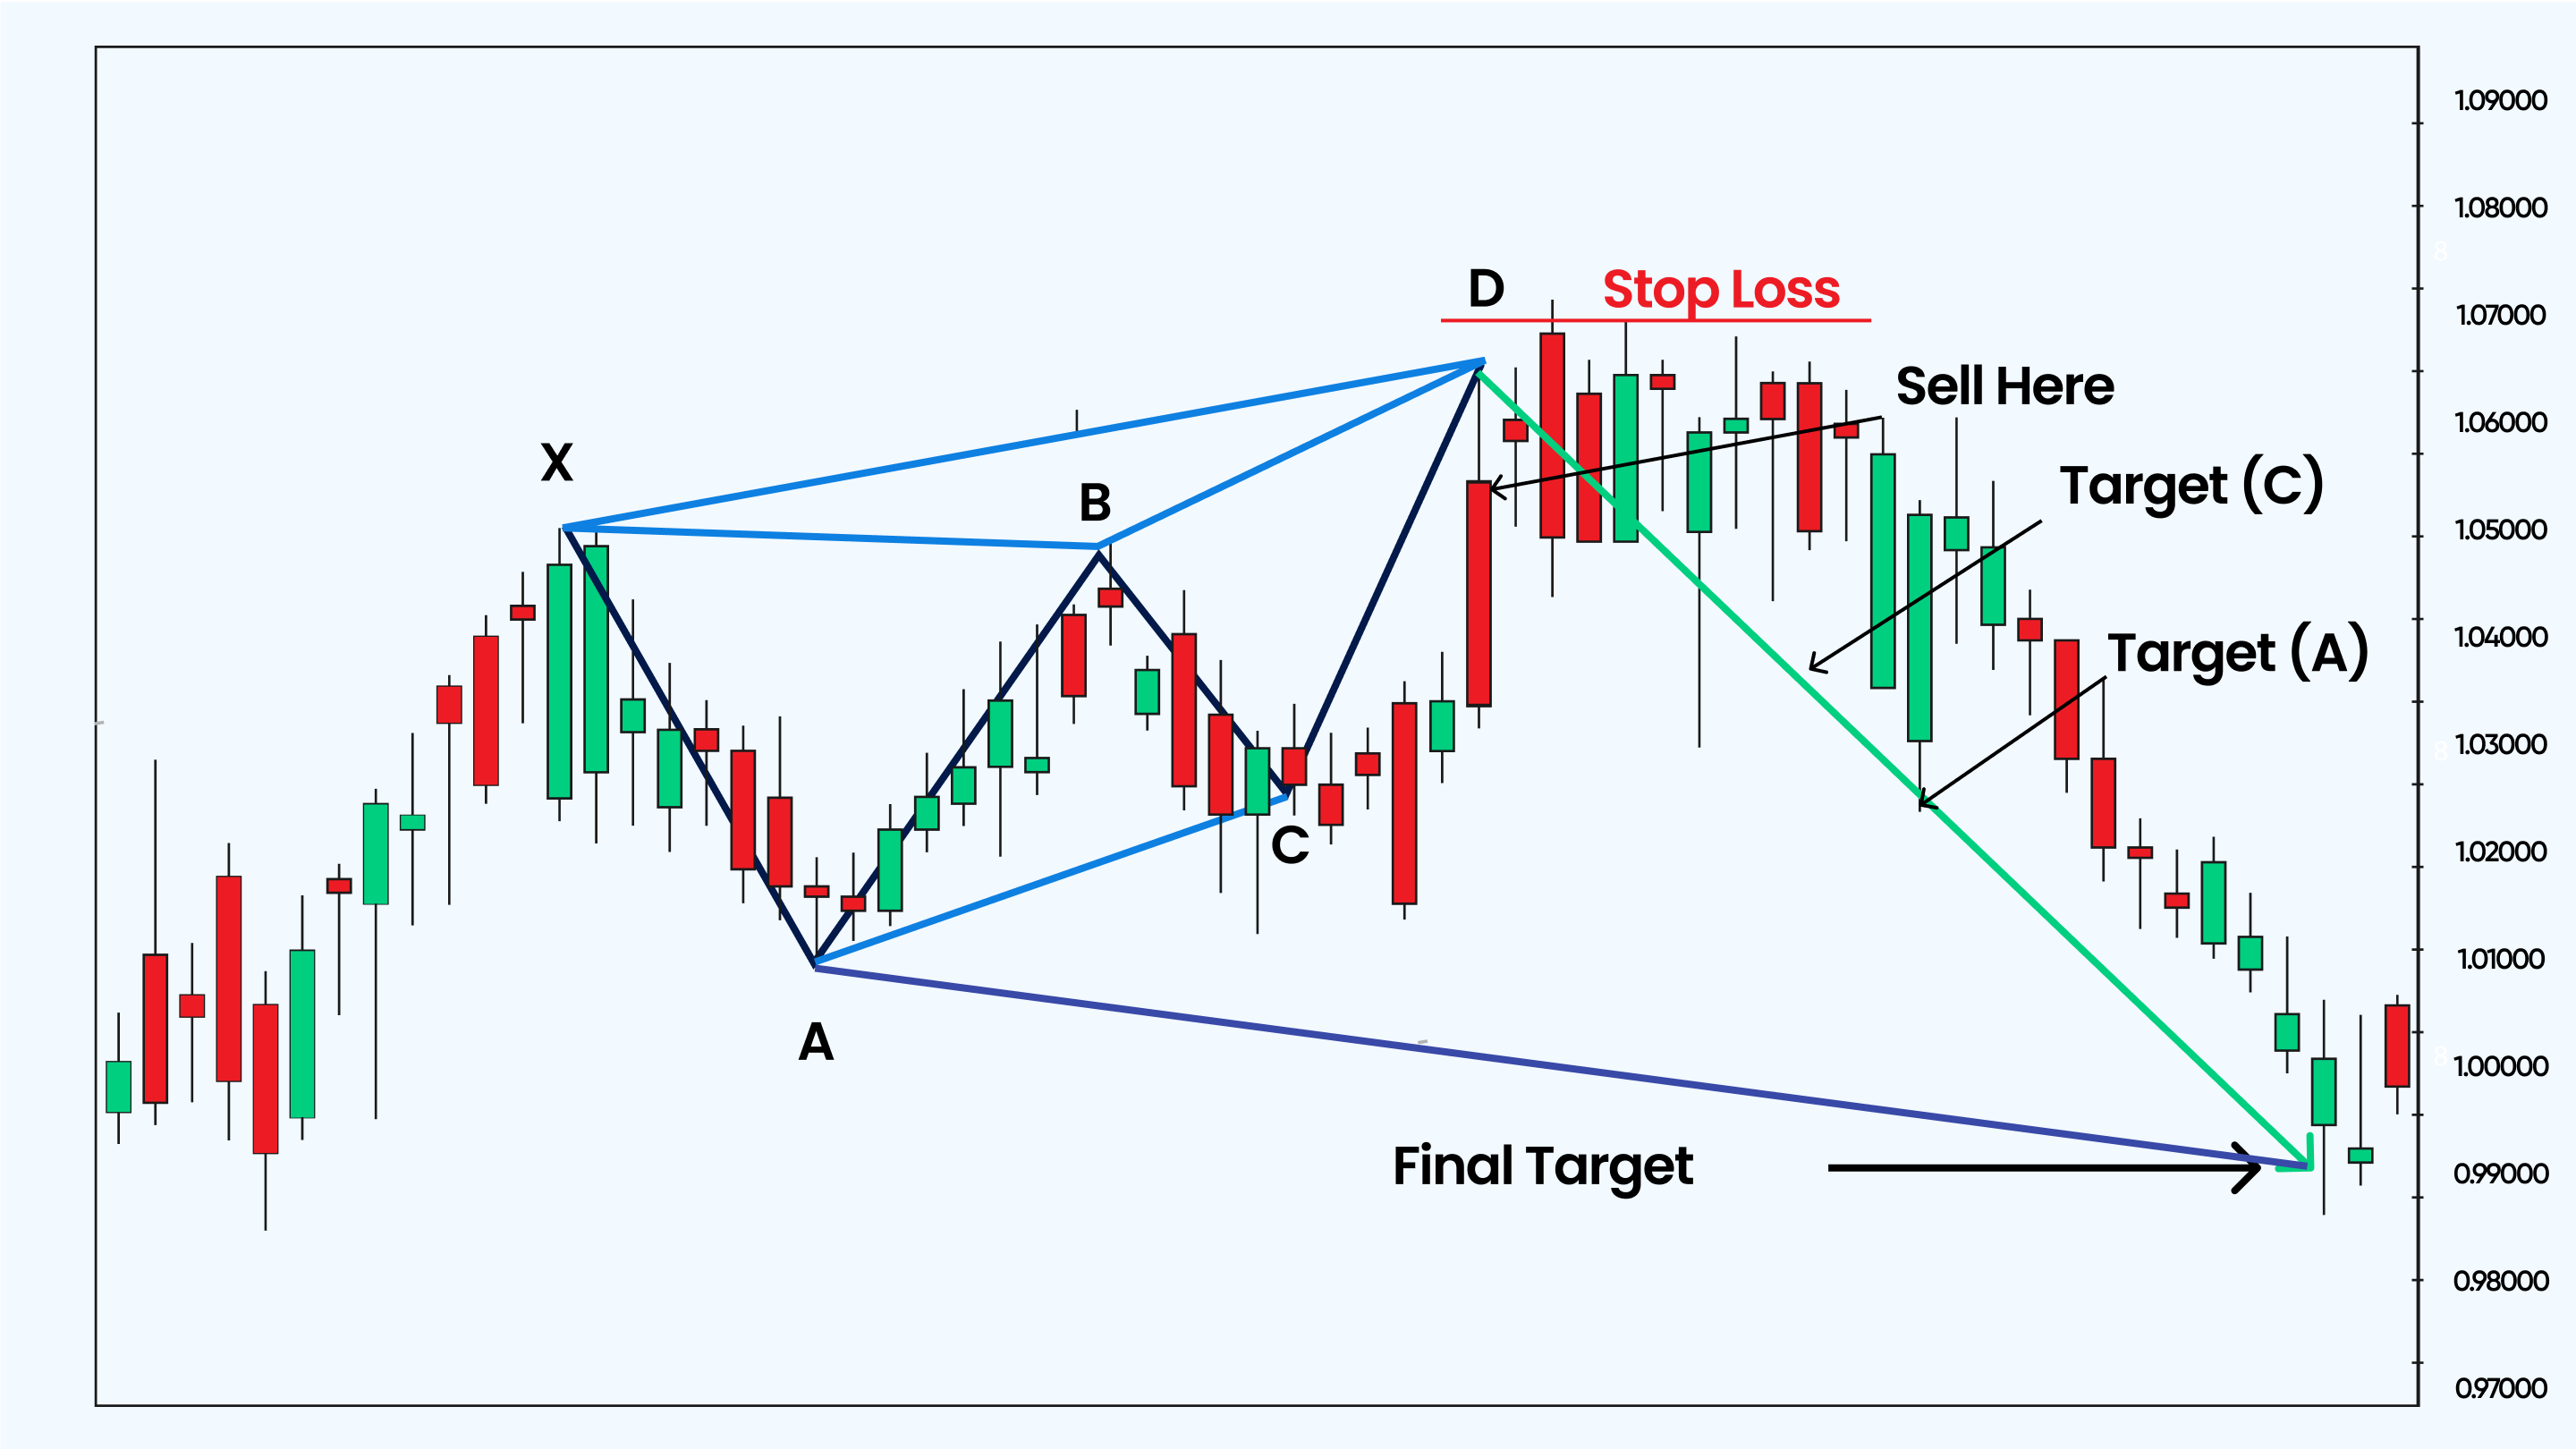
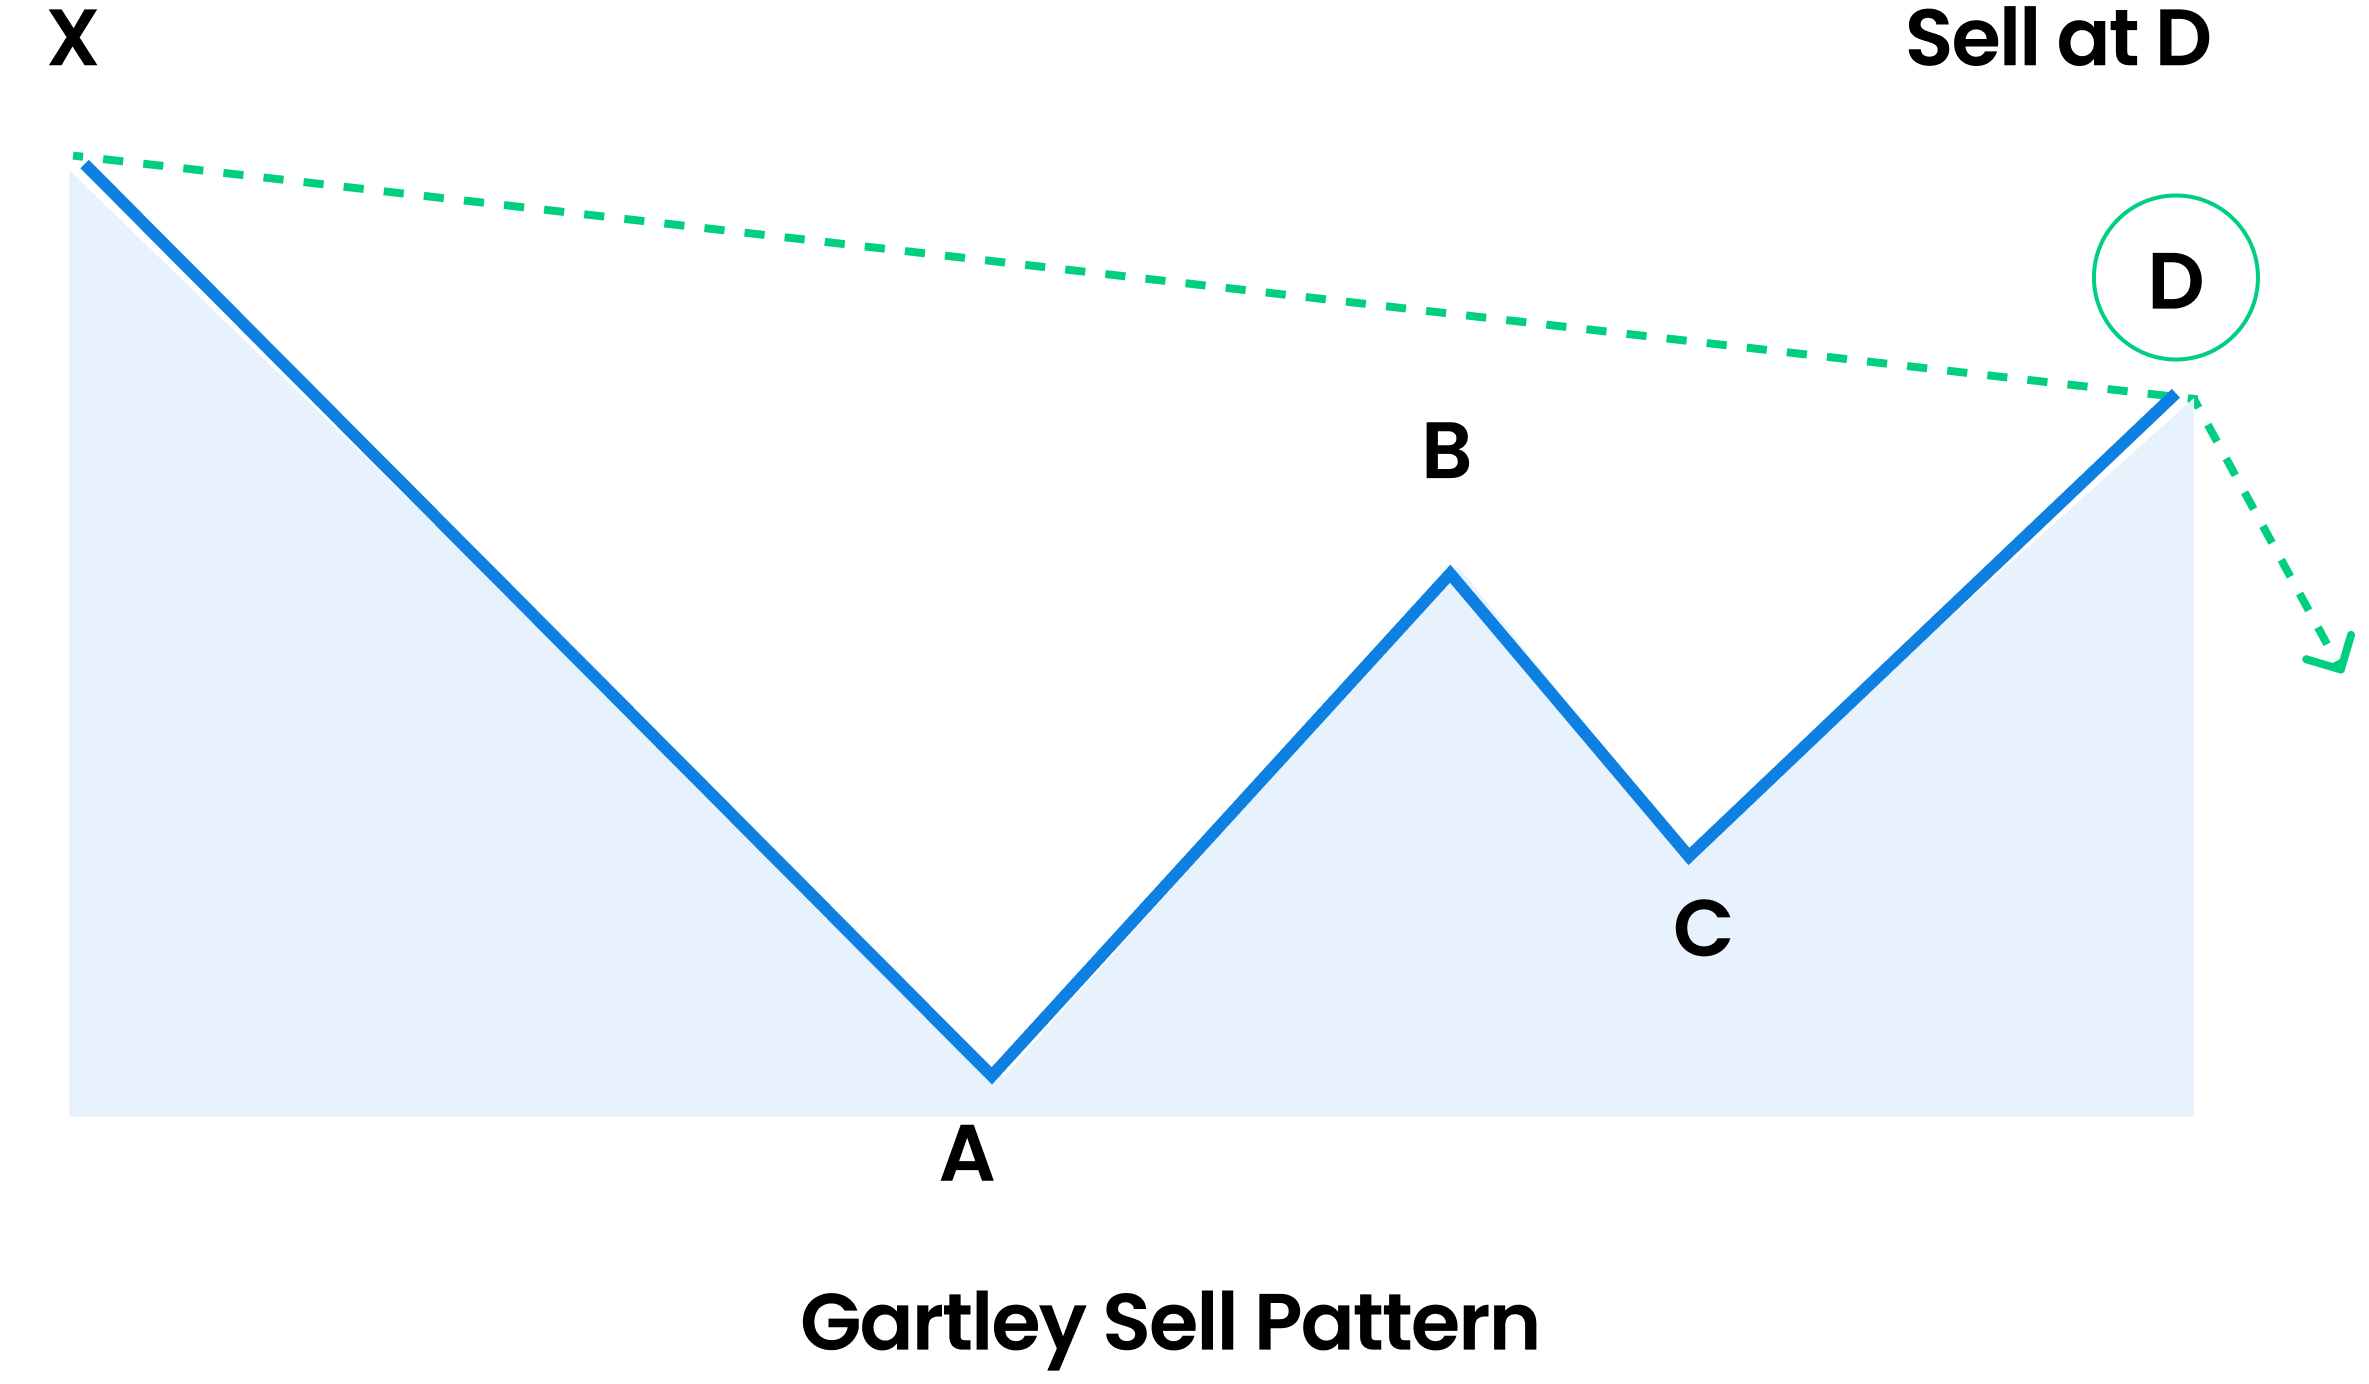
The Bearish Gartley pattern was introduced in 1935, by H.M. Gartley in his book, “Profits in the Stock Market”. The pattern helps Forex traders in identifying higher probabilities of selling opportunities. Hence, it gives the trader the favorable exit point for a long position that benefits them. If you are looking for a favorable risk-reward ratio, the Bearish Gartley pattern can help you manage risks effectively.
What is the Gartley Pattern
The Gartley pattern, in general, is a harmonic pattern that depends on the Fibonacci ratios and numbers. A Fibonacci number is an integer in the infinite sequence, with the first two terms being 1 and each succeeding term being the sum of the previous two numbers. These numbers themselves determine the Fibonacci ratios. The Gartley pattern can either be a Bullish Gartley pattern or a Bearish Gartley pattern in Forex trading. The Gartley pattern assists traders in identifying high and low reactions which gives them favorable buy and sell opportunities that define the accurate entry and exit levels in the Forex market. Since it is a highly traded pattern, it also enables traders to understand low-risk opportunities seamlessly. Traders use the Gartley pattern to highlight support and resistance levels in the Forex market. At the support level, the prices stop falling, and at the resistance level, the prices stop increasing. The pattern provides a broad overview of where the currency prices will go in the long term, giving the traders the right direction to trade-in.
How to draw a Gartley pattern
Depending on various points with a general price movement, the Gartley patterns are mainly used for Bullish trends that experience a Bearish retracement, or overall Bearish trends that experience a Bullish retracement. Every swing in this chart conforms to a particular Fibonacci level. Here is how we can structure the Bearish Gartley pattern:
X to A
Every Gartley movement begins from point X, followed by a point called A. There is no specific rule to identify the leg of X to point A. In a Bearish Gartley pattern, the first leg is identified when the price falls from point X towards point A, also called the most extended leg in the entire pattern.
A to B
At point A, Fibonacci sets off to become relevant, and the distance that is between point A followed by point B should be somewhere around the distance from point X to point A. B shall always be lower than point X. Otherwise, the pattern remains invalid.
B to C
The price swing again falls from point B to point C, with a retracement that is not below point A.
C to D
Extending the leg of B to point C, we come to a new point called D. This point D shall be higher than point B but lower than point X.
A to D
Once the pattern is completed as we reach point D, it is vital for traders to measure the total movement from point A to point D. The movement gives traders the total change in the price till now. In this pattern, XA is a Bearish line, AB is bullish, BC is again Bearish, and CD is bullish.

What is the Bearish Gartley pattern?
The Bearish Gartley pattern starts at a higher point, coming to a lower price swing. As mentioned above, it gives high selling opportunities to traders and helps them identify the right exit point in the Forex market. In contrast, the Bullish Gartley point starts with a low price swing, followed by a higher price swing. The Bullish Gartley pattern provides the traders with high buying opportunities and helps them identify accurate entry points in the Forex market. The Bearish Gartley pattern contains four consecutive price swings and is represented as a geometric pattern depicting the letter ‘W.’ It is always preceded by a significantly high point on the chart that we call X. The chart expectation is a price reversal, following the CD point, implying that prices will start falling from point D. AB shall always be equal to CD as the graph completes, which also means that the Bearish Gartley helps traders identify exit and entry or sell and buy points in the Forex market. A market reversal takes place from point B, also known as the Fibonacci retracement. It is used by traders to find risk and reward ratios while trading a trend. The trader ultimately receives the selling point in this chart pattern at point D.

How to trade in a Bearish Gartley pattern
The first and foremost step is to confirm whether the Gartley pattern you are identifying is valid or invalid. The next step is to recognize the four price moves on the chart, which are responsive to their Fibonacci levels. You can label the price swings as A, B, C, D, and X to estimate the total pattern size clearly. A trader places a sell order at point D since they identify or recognize that the market is going to fall further. In the Bearish Gartley pattern, the trader trades to the short side.
Bearish Gartley pattern stop-loss
A stop-loss order is recommended to protect yourself from unexpected price swings. A Bearish Gartley trade stop-loss is found above point D of the pattern. Once a Bearish Gartley trade is opened and the trader books a stop-loss order, they will have to wait for the price to swing in their favor. When it does, the trader needs to decide how long they wish to remain in the trade. Generally, it is recommended that the trader should enter or exit a full position only after point D and scale-out later, at different points. You can still keep a small part of the trade open if the price movements are strong enough. Trend lines, candle patterns, and more can be used with the Gartley pattern to find the correct entry/exit points which are near to accurate. However, you can stay in the trade for as long as possible if the price movement doesn’t show any signs of interruptions.
Final words
The Bearish Gartley pattern is the pattern that gives traders favorable exit/sell opportunities and it is an important pattern to consider when you are looking for more profit. Whether you are new to Forex trader or you are an experience trader, Blueberry Markets can offer a seamless Forex trading experience with top-notch support, transparent information, and easily manageable trade accounts.


