


Flag patterns are bread-and-butter continuation setups for trend traders. They help you judge whether a strong move is likely to continue, where the next impulse could travel, as well as how to structure entries, stops and targets with more discipline. At a time when forex trends can accelerate around macro catalysts, knowing the difference between a bullish flag vs a bearish flag – and exactly how to trade each – can make your strategy more consistent.

The following information is provided solely for educational purposes and does not constitute personal advice or a recommendation to trade margin FX/CFDs.
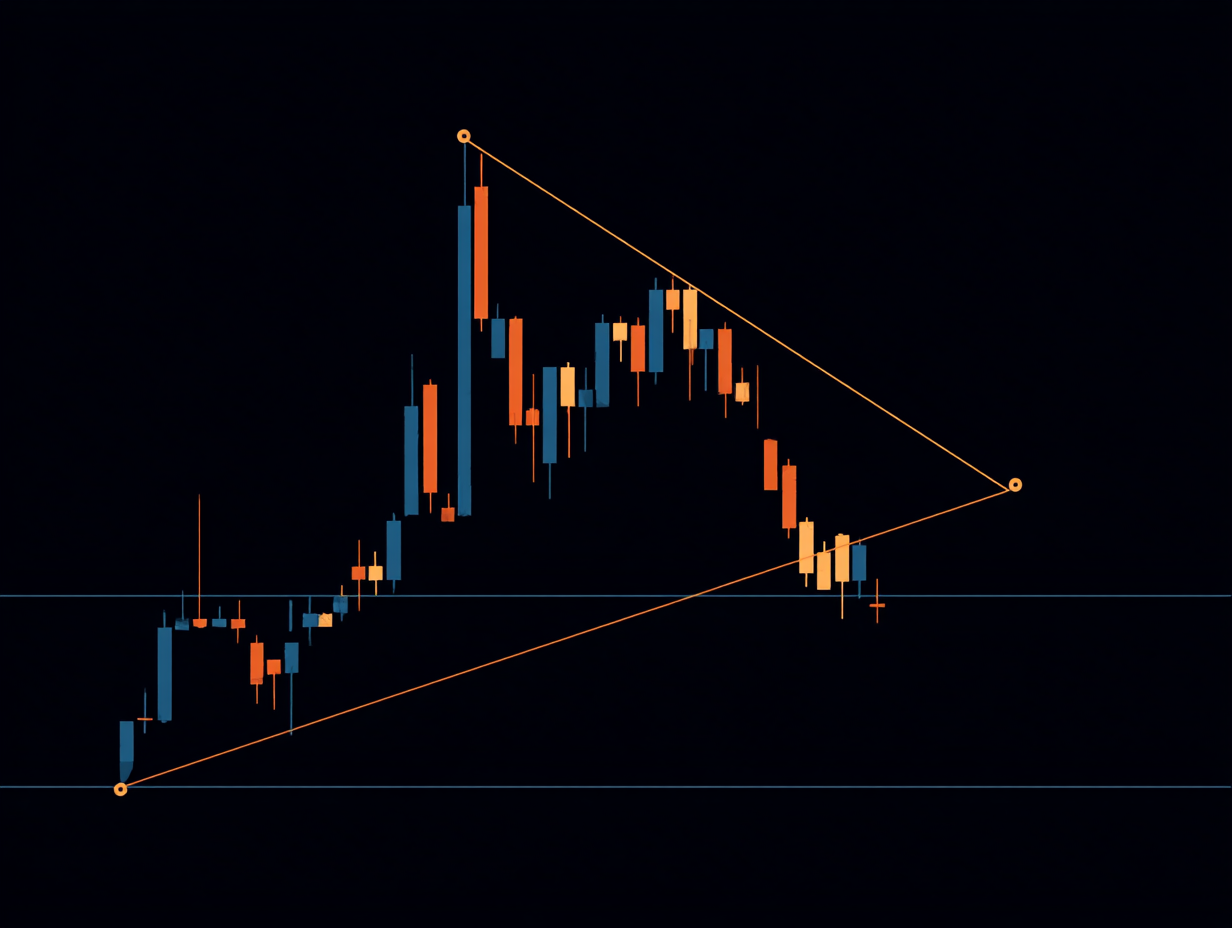
What is a flag pattern in forex?
A flag is a short-term consolidation that forms after a sharp, directional move (the “flagpole”). Price pauses and drifts counter to the prior impulse inside two roughly parallel trendlines (the “flag”). When momentum resumes, price usually breaks out in the direction of the original move and travels a “measured move” roughly equal to the height of the flagpole.
- Flagpole: The impulsive leg (strong up move for bull flags, strong down move for bear flags).
- Flag: A tight, orderly pullback that slopes against the prior move (downward for bull flags, upward for bear flags). Volume contracts during the flag and expands on breakout.
- Breakout and measured move: Continuation in the original direction, with targets projected by adding (bull) or subtracting (bear) the flagpole height from the breakout point.
Types of flag patterns
Flags are continuation patterns. You’ll meet them in two core flavors – bullish (continuation higher) and bearish (continuation lower).
What is a bullish flag?
A bullish flag is a bullish pattern that occurs in an existing uptrend. After a strong rally (flagpole), price pulls back in a tight, downward-sloping channel (the flag). If buyers retain control, price breaks up out of the flag and continues higher.
Imagine EUR/USD rallies 180 pips in two sessions, then drifts 40–60 pips lower in a tidy, downward channel for 10–20 candles. Spreads contract, volume pulls back and momentum indicators cool. A breakout candle closes above the flag’s upper trendline with expanding volume. The measured move = ~180 pips from breakout.
Identifying a bullish flag in forex trading
The bullish flag pattern has several components. Hence, at times, it can be complex to identify it on a forex chart. Traders need to identify and understand these components closely in order to be able to locate a bull flag as soon as it appears on the forex charts to trade this pattern successfully. Significant things to look out for in a bullish flag pattern are:
-
A clear, preceding uptrend with a visible flagpole.
-
A downward-sloping consolidation (two parallel lines).
-
Shallow pullback, usually less than 38% retracement of the pole. Deeper pullbacks risk invalidation.
-
Volume confirmation – volume usually declines during consolidation and increases on the upside breakout.
-
Breakout ideally closes above the flag’s top line. Follow-through can approximate the pole height.
Reliability
When all components of the flag pattern are correctly identified and present within the chart, this particular pattern is considered as an inspiration to trade and make informed decisions.
Advantages
- Works across timeframes and instruments.
- Shows clear structure for entries, stops and measured targets.
- Naturally favorable risk-to-reward if the flag is compact.
Disadvantages
- Can be confused with rectangles or channels, which aren’t true flags.
- Over-deep pullbacks or “messy” flags reduce edge.
- Novice traders might enter before confirmation.
What is a bearish flag?
A bearish flag is the mirror opposite of a bull flag – a bearish pattern inside a downtrend. After a strong selloff (flagpole), price climbs in a tight, upward-sloping channel. If sellers keep control, price breaks down out of the flag and the downtrend resumes.
Let’s say GBP/USD drops 220 pips in a day, then retraces 50–70 pips upward inside a neat channel over 12 candles. Volumes fade during the bounce and expand as price breaks below the lower trendline. A measured move of roughly 220 pips lower is projected from the breakdown.
Identifying a bearish flag in forex trading
Look out for the following:
- A clear, preceding downtrend with a visible flagpole.
- An upward-sloping consolidation (two parallel lines).
- Shallow retracement of less than 38% of the pole.
- Volume confirmation – volume should decline into the flag and increase on the downside break.
- Ideally, breakdown closes below the flag’s lower line. Look for price breaks lower than usual, equal to the flagpole’s length.
Reliability
Bear flags are considered an extremely reliable price pattern when all their unique formations are correctly identified and measured.
Advantages
- Applicable across all markets and timeframes.
- Provides traders with objective entries, exits, stops and limit levels.
- Can yield favorable risk-to-reward ratios when the flag is tight.
Disadvantages
- Can be challenging to distinguish from a simple corrective channel.
- Overlapping price action or choppy pullbacks make things more complicated for newer traders.
Types of bearish flags
These structures generally behave like bearish continuations in context. Always confirm with the broader trend, support/resistance and volume.
Inverted cup and handle
An inverted “U” (the cup) followed by a smaller, upward-sloping pullback (the handle). Breakdown from the handle signals continuation lower.
Spot when a larger downtrend pauses, “retests” lower highs, then rolls over.
Falling range flags (descending flags)
A short continuation pattern in a downtrend where price makes lower highs and lower lows in a tight range. A decisive drop through support suggests sellers are in control.
Top tip: Watch for a last, weak bounce to the flag’s top line to refine the risk.
Rising wedges
Price makes higher highs and higher lows, but the slope narrows (converging trendlines). Momentum usually wanes to set up a bearish break.
Rising wedge into a resistance confluence (prior swing low turned resistance) can sharpen the signal.
Ascending channel
A steady, rising channel within a larger downtrend. The breakdown from the lower boundary generally resumes the dominant trend.
Be aware that channels can extend longer than expected, so it might be wise to wait for a close-out of structure.
Types of bullish flags
Cup and handle
A rounded “U” (cup) with a mild, downward handle. Breakout above handle resistance indicates trend continuation higher.
Rising range flags (ascending flags)
In an uptrend, price consolidates in a tight, upward-tilted range. A strong break above resistance confirms continuation.
In terms of execution, bear in mind that smaller flags near a key breakout level can be more explosive.
Falling wedges
Converging, downward-sloping trendlines with lower highs and lows. Loss of downside momentum often precedes an upside break.
Descending channel
A steady, downward channel inside a larger uptrend. Breakout above the upper boundary signals a potential continuation of the broader uptrend.
How to draw a flag pattern
Both bearish and bullish flag patterns can be identified during strong uptrends and downtrends, respectively. Here are five steps on how you can draw a bull flag and bear flag pattern:
- Look for strong upward (or downward) sloping bars that are formed one after the other in a particular timeframe.
- Identify candlesticks with smaller bodies right after the strong upward or downward bars.
- Wait for the market to go through a consolidation to identify a small but evident trend that moves in the opposite direction of the prior trend.
- When the trend reversal is confirmed, a bullish flag pattern can be drawn right after a downtrend, and a bearish flag pattern can be drawn right after an uptrend.
- The prior trend will be identified as the flag pole pattern. The reversed trend will be identified as the body of the flag.
For MT4/MT5, use the “Channels” tool for parallel lines and set alerts at trendline breaks. Or for TradingView, you can turn on “Magnet mode” for precise highs/lows. You might also want to consider an ATR (average true range) indicator to calibrate stop distance.
How to trade the bearish and bullish flags in forex
Here’s a practical, rules-based flow that you can test and adapt to your preferences:
-
Spot a prior trend: Trade with the prevailing trend. For a bull flag, the higher timeframe should also be trending up. For a bear flag, trending down. Avoid counter-trend flags unless you have a separate mean-reversion playbook.
-
Identify a narrow price range: Your flag should be tidy, with overlapping candles and reduced volatility. Mark support/resistance with parallel lines. Remember, the tighter the flag, the better your potential risk-reward.
-
Confirm with volume or momentum: Look for declining volume through the flag and a surge on breakout. If volume isn’t available, use momentum proxies (e.g. relative strength index (RSI), leaving a shallow pullback).
-
Enter on breakout (or retest):
-
Aggressive: Enter as price closes beyond the flag boundary.
-
Conservative: Wait for the first pullback to retest the broken trendline and then enter on the rejection candle.
-
Place the stop-loss order: In a bearish flag pattern, stop-loss orders can be placed above the flag so that if and when the market moves below this level, the trade is automatically exited. In a bullish flag pattern, stop-loss orders can be placed below the flag so that if, and when, the market moves beyond this level, the trade is automatically entered.
-
Set profit targets:
-
Measured move: Project the flagpole height from the breakout.
-
Scale-out: Think about taking partial profits at 1R or a nearby swing, then trail the rest under (bull) or above (bear) minor higher lows or higher highs.
- Monitor trades and act accordingly: The last step to trading a bearish or bullish flag pattern is to monitor the trades regularly and act accordingly. Even when you have placed an order, it is essential to keep analyzing the market and check if the pattern is reacting the same way it suggested. Doing this helps traders avoid false market signals.
Key differences between bullish and bearish flags
|
Bull flag |
Bear flag |
|
|
Direction of trend |
Continuation up. |
Continuation down. |
|
Flag slope |
Downward-tilted consolidation. |
Upward-tilted consolidation. |
|
Volume behavior |
Contracts during flag, expands on upside break. |
Contracts during flag, expands on downside break. |
|
Entry trigger |
Close above the flag’s upper boundary (or retest buy). |
Close below the flag’s lower boundary (or retest sell). |
|
Stop placement |
Below flag lows or ATR-based under breakout candle. |
Above flag highs or ATR-based over breakdown candle. |
|
Targeting |
Measure pole height from breakout. Trail under higher lows. |
Measure pole height from breakdown. Trail over lower highs. |
|
Typical invalidation |
Deep pullback (>50% of pole) or breakdown below pole origin. |
Deep retracement (>50% of pole) or breakout above pole origin. |
Common mistakes to avoid when trading flag patterns
-
Ignoring volume or momentum clues: A clean flag often “breathes” with lower activity into the pause and higher activity on break. If there’s no expansion on break? Consider passing.
-
Trading flags against the higher-timeframe trend: A neat H1 bull flag inside a daily downtrend is lower quality. Align timeframes.
-
Forcing flags out of messy consolidations: Not every channel is a flag. You want a sharp pole, a compact pullback and orderly price action.
-
Pre-empting the breakout: Entering inside the flag can work, but it raises whipsaw risk. If you do it, use smaller size and a tighter invalidation plan.
-
Placing stops too tight: Volatility expands at breakouts, so if your stop sits inside normal ATR “noise”, you should expect shakeouts.
Frequently asked questions
1. What is the main difference between a bull flag and a bear flag pattern?
They’re mirror-image continuation structures. A bull flag pauses an uptrend with a downward-sloping pullback and then breaks higher, whereas a bear flag pauses a downtrend with an upward-sloping pullback and then breaks lower. A bullish flag vs bearish flag captures that simple but important distinction.
2. How do bull flags and bear flags typically form in trending markets?
A strong impulse (flagpole) creates imbalance. The market then “catches its breath” in a tight channel that slopes against the prior move. When participation returns, price breaks out in the direction of the original trend.
3. What role does the flagpole play in both bull and bear flag patterns?
It defines potential energy and acts as a measuring stick. Traders can project the pole’s height from the breakout to estimate a target for continuation.
4. How reliable are bull flag and bear flag patterns as continuation signals?
Reliability improves when the flag is shallow, occurs within a higher-timeframe trend and breaks with increasing volume or momentum. No pattern is perfect, so use risk controls and confirm with levels.
5. Can a bear flag pattern ever turn bullish, and vice versa?
Yes. If structure fails (e.g. a bear flag breaks up and holds above the flag), treat it as invalid. Markets can transition into ranges or reversals, so you should always have an exit plan.
6. How long do bull and bear flag patterns usually last before breaking out?
From a few candles to a few dozen (depending on the timeframe and volatility). Flags that drag on too long could morph into broader channels or rectangles.
7. What impact do support and resistance levels have on bull and bear flags?
They frame risk. A bull flag breaking into heavy resistance might underperform, while a bear flag sitting atop multi-touch support should be treated with caution. Always map nearby levels before committing.
Trade the flag patterns today to identify continued market trends
Both bear flags and bull flags are represented in the same way in the same chart pattern. They are reflected in the opposite direction, marking a downward or an upward slope, respectively. Strategies followed by traders to profit from these projections are similar in nature but involve a superior understanding of these patterns. You can start trading these patterns along with several others on our platform and experience a smooth trading process.