


The morning star pattern is a bullish candlestick reversal pattern that signals a potential shift from a downtrend to an uptrend. This three-candle formation appears at the bottom of price declines and indicates that selling pressure is weakening while buying interest begins to emerge.
Traders rely on the morning star pattern to identify optimal entry points when markets are transitioning from bearish to bullish momentum. The pattern consists of a large bearish candle, followed by a small-bodied candle showing market indecision, and completed by a strong bullish candle that confirms the reversal.
Understanding this pattern is essential for forex traders using technical analysis to time their trades effectively. When properly identified and confirmed with additional indicators, the morning star pattern can provide high-probability trading opportunities as markets establish new upward trends. In this guide, we'll explore how to recognize this formation, understand what makes it reliable, and implement practical strategies to trade it successfully.
The following information is provided solely for educational purposes and does not constitute personal advice or a recommendation to trade margin FX/CFDs.
What is the Morning Star Pattern?
The morning star pattern is a three-candle technical formation that appears on price charts, signaling a bullish reversal after a downtrend. Unlike technical indicators that calculate mathematical values, this pattern is a visual price action signal based on the relationship between consecutive candlesticks.
The Three-Candle Structure
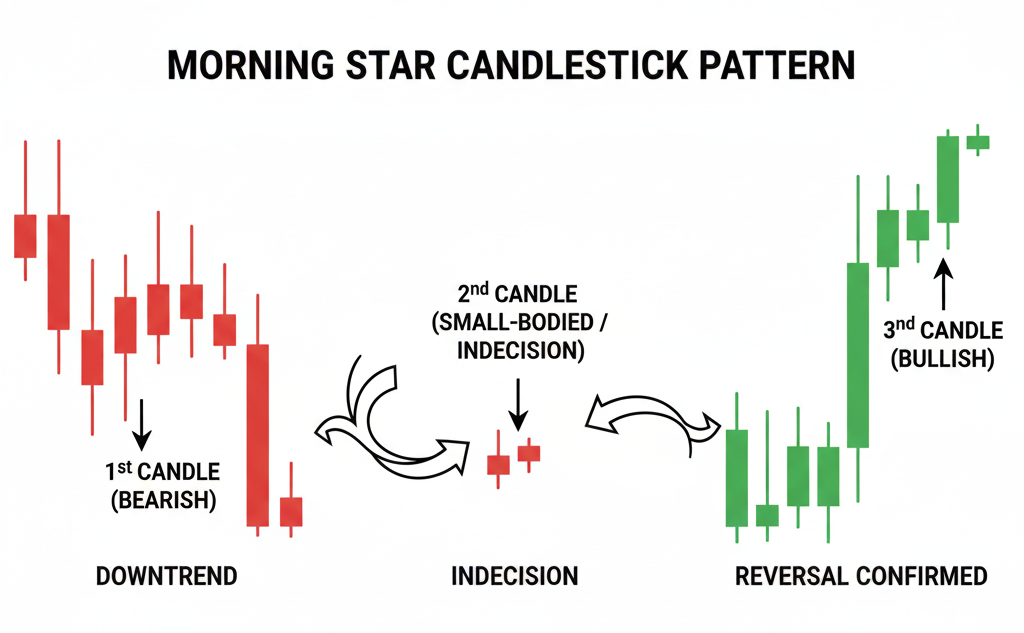
The pattern unfolds across three distinct trading sessions:
First Candle: A long bearish (red or black) candle that extends the existing downtrend. This candle reflects strong selling pressure and confirms that bears remain in control of the market.
Second Candle: A small-bodied candle that can be either bearish or bullish. This candle typically gaps down from the previous close, creating separation from the first candle. The small body indicates indecision as buyers and sellers reach a temporary equilibrium. This is where the trend momentum begins to weaken.
Third Candle: A large bullish (green or white) candle that gaps up and closes well above the midpoint of the first candle's body. This candle confirms that buyers have taken control and marks the potential start of a new uptrend.
Market Psychology
The morning star pattern represents a psychological shift in the market. The name comes from the planet Venus, known as the "morning star," which appears before dawn—just as this pattern appears before a potential rise in prices. The progression from bearish dominance to indecision to bullish control tells the story of a market bottoming out.
Morning Star vs. Evening Star Pattern
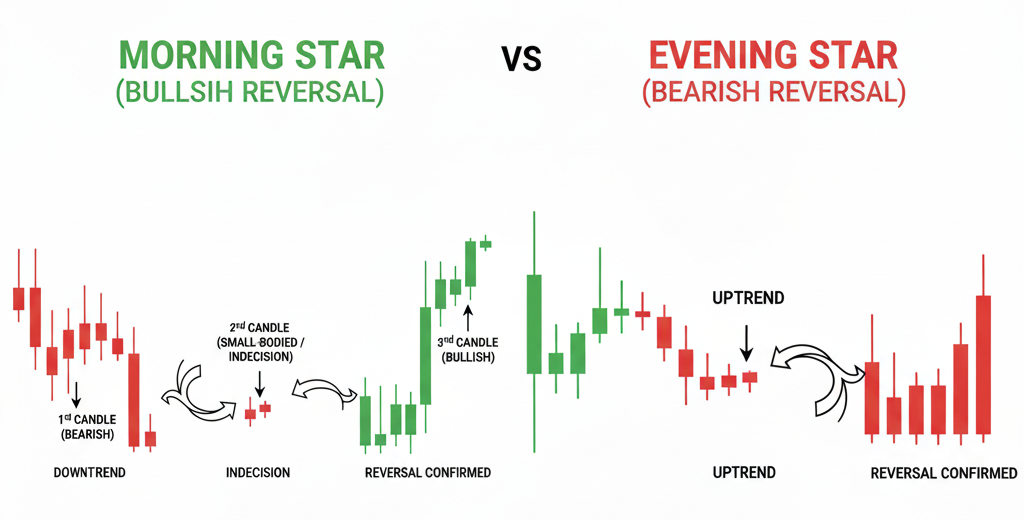
While the morning star signals a bullish reversal, its counterpart—the evening star pattern—signals a bearish reversal. Understanding both patterns helps traders identify trend changes in either direction.
Key Differences
The evening star is essentially a mirror image of the morning star pattern, but it appears at the top of uptrends rather than at the bottom of downtrends:
-
Trend Context: Morning star appears after downtrends; evening star appears after uptrends
-
First Candle: Morning star begins with a bearish candle; evening star begins with a bullish candle
-
Signal Direction: Morning star signals upward reversal; evening star signals downward reversal
-
Third Candle: Morning star completes with a strong bullish candle; evening star completes with a strong bearish candle
Why Both Matter
Successful traders monitor both patterns because they represent critical turning points in market sentiment. When you identify a morning star forming at support levels, you're watching for buying opportunities. When an evening star appears at resistance levels, you're watching for potential exits or short positions.
The middle candle in both patterns serves the same purpose—it shows indecision and the moment when the previous trend loses its momentum. This indecision phase is crucial because it marks the transition point before the new trend establishes itself.
By recognizing both formations, you develop a complete picture of potential reversal points throughout the market cycle.
Morning Star vs. Doji Morning Star Pattern
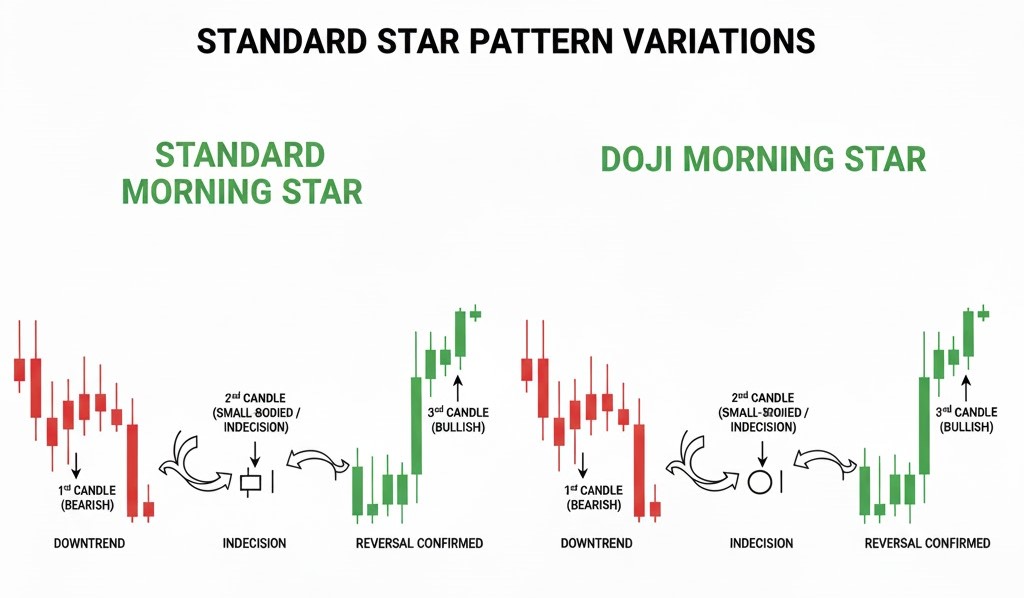
The morning star pattern has an important variation called the doji morning star, which often signals an even stronger reversal potential.
Standard Morning Star
In the classic morning star pattern, the middle candle has a small real body—meaning the closing price is slightly higher or lower than the opening price. This small body shows that while there's some directional movement, neither buyers nor sellers have gained clear control.
Doji Morning Star Variation
The doji morning star features a doji candle as the middle formation. A doji occurs when the opening and closing prices are virtually identical, creating a cross or plus-sign shape on the chart. This represents perfect equilibrium between buying and selling forces.
Why the Doji Version Matters
The doji middle candle indicates stronger indecision than a standard small-bodied candle. When the market shows this level of uncertainty after a sustained downtrend, the subsequent bullish candle often represents a more decisive shift in sentiment.
Many technical analysts consider the doji morning star a more reliable signal because:
-
The doji shows complete neutrality before the reversal
-
It indicates maximum uncertainty at the turning point
-
The following bullish candle represents a clearer break from the previous trend
Both variations are valid reversal signals, but the doji version may warrant closer attention when you're evaluating potential trade opportunities at support levels.
How to Identify a Morning Star Pattern
The morning star pattern starts with a comparatively bigger sized bearish candle, followed by a smaller red-coloured candle that is only slightly bearish. The third and last candle in this pattern is more significant than the previous two candles in size, and identifying these three main candles forming is only the first step towards identifying the whole pattern. The other steps into identifying the pattern are:
-
Identify the part where the market is showing lower lows and lower highs in an existing downtrend
-
Identify a large bearish candle that appears due to heavy selling pressure in the market and continues the existing downtrend. At this point, traders are signalled to short the trades
-
The next step is to identify a smaller bearish or bullish candle that indicates the first downtrend signal. This candle makes a lower low in the market and showcase market indecisions
-
The third step is to identify the largest bullish candle in the pattern, which indicates the first true reversal sign with buying pressures in the market. This candle gaps up from the previous close price and starts a new uptrend
-
After the third candle is identified, an uptrend is confirmed, and traders notice higher lows and higher highs that signal them to place long orders
How to Trade the Morning Star Pattern
Since the morning star pattern suggests that bulls are taking over the market and bears are losing their grip, leading to a bullish trend reversal, it is always advisable to trade this pattern with other price patterns like trend lines or support and resistance levels. Here is how you can trade with the morning star pattern in 3 easy steps:
Downtrend Confirmation
Confirm the downtrend with the help of support levels that indicate prices cannot fall further and will reverse from hereon. This helps confirm a continued downtrend that reverses so traders can take buying positions in the market. The downtrend can be confirmed on the existing timeframe by measuring the support level.
The formula of calculating the support levels:
-
First level of Support = (2*PP) – high, where PP = Pivot Point = (High price + Low price + Close price) / 3
-
Second level of Support = PP – (High – Low)
-
Third level of Support = Low – 2(High – PP)
The downtrend is confirmed as soon as the morning star pattern reaches these support levels.
Identifying the Morning Star Pattern
A Low Stochastic occurs when the currency pair prices close near its low price and keep decreasing. An oversold condition is signalled when the stochastic lines are below 20, providing traders with an upward market reversal. This prepares traders to enter long trade positions, with the prices expected to increase soon.
Entry Points
Timing your entry correctly maximizes the potential of morning star pattern trades while managing risk effectively.
Optimal Entry Timing
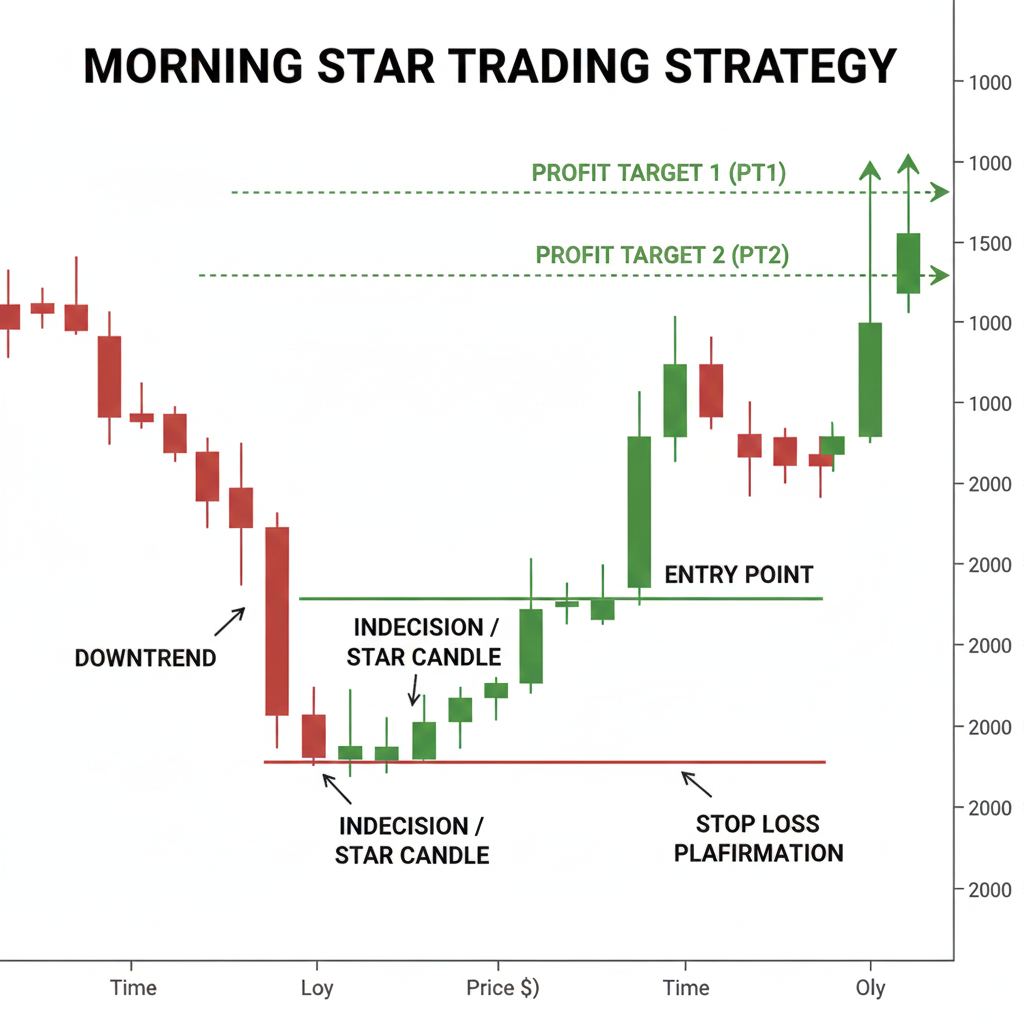
The most common entry point is at the close of the third candle or the opening of the following candle. This approach ensures the pattern is fully formed and confirmed before you commit capital.
Conservative Entry: Wait for the next candle after the pattern completes to open and close above the third candle's high. This provides additional confirmation but may sacrifice some profit potential.
Aggressive Entry: Enter during the formation of the third candle if it's clearly bullish and volume is increasing. This captures more of the move but carries higher risk if the pattern fails.
Confirmation Before Entry
Don't trade the pattern in isolation. Look for supporting evidence:
-
Volume increase on the third candle confirms buying pressure
-
Support level confluence means the pattern appears at a known support zone
-
Indicator confirmation such as RSI showing oversold conditions below 30
-
Broader trend context where the downtrend is mature and overextended
The more confirmation factors present, the higher the probability of a successful trade.
Stop Loss Placement
Proper stop loss placement protects your capital if the pattern fails while giving the trade room to develop.
Standard Stop Loss
Place your stop loss just below the low of the second (middle) candle. This level represents the pattern's invalidation point—if price drops below this level, the reversal signal is negated and the downtrend likely continues.
Conservative Stop Loss
For higher-risk tolerance trades, place the stop below the low of the entire three-candle pattern. This gives the trade more breathing room but increases your potential loss.
Trailing Stop Strategy
Once the trade moves in your favor, consider implementing a trailing stop:
-
Move your stop to breakeven once price advances by 1-2 times your initial risk
-
Trail the stop below each new higher low that forms
-
This locks in profits while allowing the uptrend to continue
Why This Placement Works
Stop placement below the pattern's low makes logical sense—if price revisits these levels, the bullish reversal has failed and the original downtrend remains intact. This invalidation point provides a clear, objective exit rule.
Profit Targets</h3>
Setting realistic profit targets helps you capture gains while avoiding premature exits or holding positions too long.
Primary Target Selection
Identify the nearest resistance level above your entry point. This could be:
-
Previous swing highs that acted as resistance during the downtrend
-
Round number psychological levels
-
Moving averages where price previously struggled
-
Fibonacci retracement levels from the recent decline
Risk-Reward Ratios
Aim for a minimum risk-reward ratio of 1:2, meaning your potential profit should be at least twice your risk. If your stop loss represents a 50-pip risk, target a minimum 100-pip gain.
Scaling Out Approach
Consider taking partial profits at multiple levels:
-
Close 50% of your position at the first resistance level
-
Move your stop to breakeven
-
Let the remaining 50% run toward the next resistance level or a 1:3 risk-reward target
This approach locks in some profit while maintaining exposure if the trend continues. Adjust your strategy based on how strongly the price action confirms the reversal.
The suitable entry point with this pattern is the closing point of the green candle that appears immediately after the three red candles. You can exit the position at any area of resistance. The stop-loss order can be placed at the currency pair price reaching close to the resistance level in a higher timeframe. The take profit price can be set at a level where the currency pair prices touch the old support level in the pattern.
What are the Top Morning Star Trading Strategies
Relative Strength Index
Relative Strength Index helps traders measure price fluctuation in overbought and oversold market situations. Combining it with the morning star pattern, traders are given ideal entry points when the market is at its lowest, to profit from the uptrend. To trade with the morning star RSI strategy, we use 5-periods RSI and enter buy positions as soon as the RSI crosses level 30, as a morning star forms. This is because reading over 30 indicates the market correcting itself from an oversold situation to a normalized uptrend that encourages traders to open long positions.

Morning Star Doji
A Doji candlestick pattern indicates market indecision where the closing and buying prices of the currency pair are almost the same. Right after the indecision takes place, a bullish move is expected due to a possible trend reversal, and traders stop selling to take more long positions in the market instead. The next candle opens at the same level as the previous Doji candle but confirms a bullish trend reversal since the market then witnesses an uptrend thereafter.

Reliability and Accuracy of the Morning Star Pattern</h2>
Understanding the morning star pattern's reliability helps you set realistic expectations and trade it more effectively.
Overall Effectiveness
The morning star pattern demonstrates moderate to high reliability as a reversal signal, particularly when traders apply proper confirmation techniques. Like all technical patterns, it's not foolproof—its success depends heavily on market context and how you use it.
Factors That Improve Success Rates
The pattern becomes more reliable when:
-
Volume confirms the reversal: Trading volume increases on the third candle, validating the shift in sentiment
-
Support levels align: The pattern forms near established support zones or previous price lows
-
Longer timeframes: Daily and weekly charts produce more reliable signals than 5-minute or 15-minute charts
-
Mature downtrends: The pattern appears after extended downward moves rather than brief corrections
-
Additional indicator support: Momentum oscillators like RSI show oversold conditions (below 30)
When False Signals Occur
The pattern is less reliable in:
-
Choppy, range-bound markets without clear trends
-
Very short timeframes where random price fluctuations dominate
-
Situations where the pattern appears without volume confirmation
-
Cases where the third candle barely closes above the first candle's midpoint
No pattern achieves 100% accuracy. The morning star pattern works best as part of a complete trading strategy that includes multiple confirmation factors and sound risk management practices.
Frequently Asked Questions About the Morning Star Pattern
Is the morning star pattern bullish or bearish?
The morning star pattern is a bullish reversal signal. It appears at the bottom of downtrends and indicates that selling pressure is exhausted and buying interest is emerging. When properly confirmed, this pattern suggests prices are likely to move higher, making it a signal for potential long (buy) positions rather than short (sell) positions.
How reliable is the morning star pattern?
The morning star pattern has moderate to high reliability when used correctly. Its effectiveness increases significantly when combined with confirmation factors such as volume analysis, support levels, and technical indicators. The pattern works best on longer timeframes like daily or weekly charts, where it filters out market noise. In trending markets with clear support and resistance levels, the pattern tends to be more reliable than in choppy, range-bound conditions. However, no pattern guarantees success—proper risk management remains essential regardless of the pattern's historical accuracy.
What is the difference between morning star and evening star patterns?
The morning star and evening star are opposite reversal patterns. The morning star appears after downtrends and signals bullish reversals, while the evening star appears after uptrends and signals bearish reversals. Structurally, the morning star begins with a bearish candle and ends with a bullish candle, whereas the evening star begins with a bullish candle and ends with a bearish candle. Both patterns feature a small middle candle showing indecision. Traders monitor both patterns to identify potential turning points in either direction.
Can the morning star pattern fail?
Yes, the morning star pattern can produce false signals, particularly in certain market conditions. Failures are more common when the pattern appears without supporting confirmation factors, in highly volatile or choppy markets, on very short timeframes where noise is prevalent, or when broader market trends overwhelm the signal. This is why experienced traders always use the pattern alongside other forms of analysis rather than relying on it in isolation. Proper stop loss placement protects against failed patterns by limiting losses when the expected reversal doesn't materialize.
What timeframe works best for the morning star pattern?
The morning star pattern generally shows higher reliability on daily and weekly charts compared to shorter intraday timeframes. Longer timeframes filter out market noise and reflect more significant shifts in supply and demand. That said, the pattern can appear and work effectively on 4-hour and 1-hour charts for swing and day traders. The key is maintaining consistency—if you identify the pattern on a daily chart, use daily chart indicators and levels for confirmation. Mixing timeframes can lead to conflicting signals and reduce the pattern's effectiveness.
How do I confirm a morning star pattern?
Confirm the morning star pattern by checking multiple supporting factors before entering a trade. Look for volume expansion on the third candle, which validates buying pressure. Verify that the pattern appears near established support levels or previous price lows. Check momentum indicators like RSI to ensure the market was oversold before the pattern formed. Assess whether the downtrend before the pattern was sustained and mature rather than a brief pullback. The more confirmation factors present, the higher the probability that the reversal will follow through. Never trade the pattern based solely on the candlestick formation without additional context.
Trade with the Morning Star Pattern to Identify Trend Reversals
The morning star pattern provides forex traders with a powerful visual signal for identifying potential trend reversals from bearish to bullish momentum. By understanding its three-candle structure and applying proper confirmation techniques, you can incorporate this pattern into a systematic trading approach.
Key Takeaways
-
The morning star is a bullish reversal pattern consisting of three candlesticks that appears after downtrends
-
Proper identification requires a large bearish candle, small indecision candle, and strong bullish confirmation candle
-
Always confirm the pattern with volume analysis, support levels, and technical indicators before entering trades
-
Use appropriate stop loss placement below the pattern's low and target resistance levels for profit-taking
-
The pattern works best on daily and weekly timeframes in trending markets with clear support and resistance
Remember that successful pattern trading combines technical analysis with disciplined risk management. No single pattern guarantees profits, but the morning star pattern—when properly understood and confirmed—can help you identify high-probability entry points as markets transition to uptrends.
Ready to apply the morning star pattern in your trading? Start practicing pattern identification on Blueberry's demo account to build confidence before trading live markets.