The Heikin Ashi Candlestick pattern is almost the same as the traditional candlesticks, with one big difference—the former is an averaged out version of the latter. The chart pattern can help traders spot Forex market trends, predict future prices, and determine the ideal time to enter, exit, or stay in the market. Let's take a look at what Heikin Ashi Candlestick really is and how you can effectively use it as a Forex trading strategy.
Understanding Heikin Ashi Candlestick
The Heikin Ashi Candlestick aims to filter out any noise in the currency pair prices by creating a chart pattern with averaged out prices. The pattern helps traders understand the market direction, trends, gaps, and reversals. It does not use the open, close, high, and low currency pair prices like the standard candlestick charts to depict the price movement graphically. Instead, it uses a formula based on two-period averages that help give the chart a smoother appearance, unaffected by any extreme price moves.
- The open price is the first trade price of the currency pair during the day
- The close price is the last trade price
- The high price, at the topmost portion of the candlestick, depicts the highest traded price
- The low price, at the bottom-most portion of the candlestick, depicts the lowest traded price
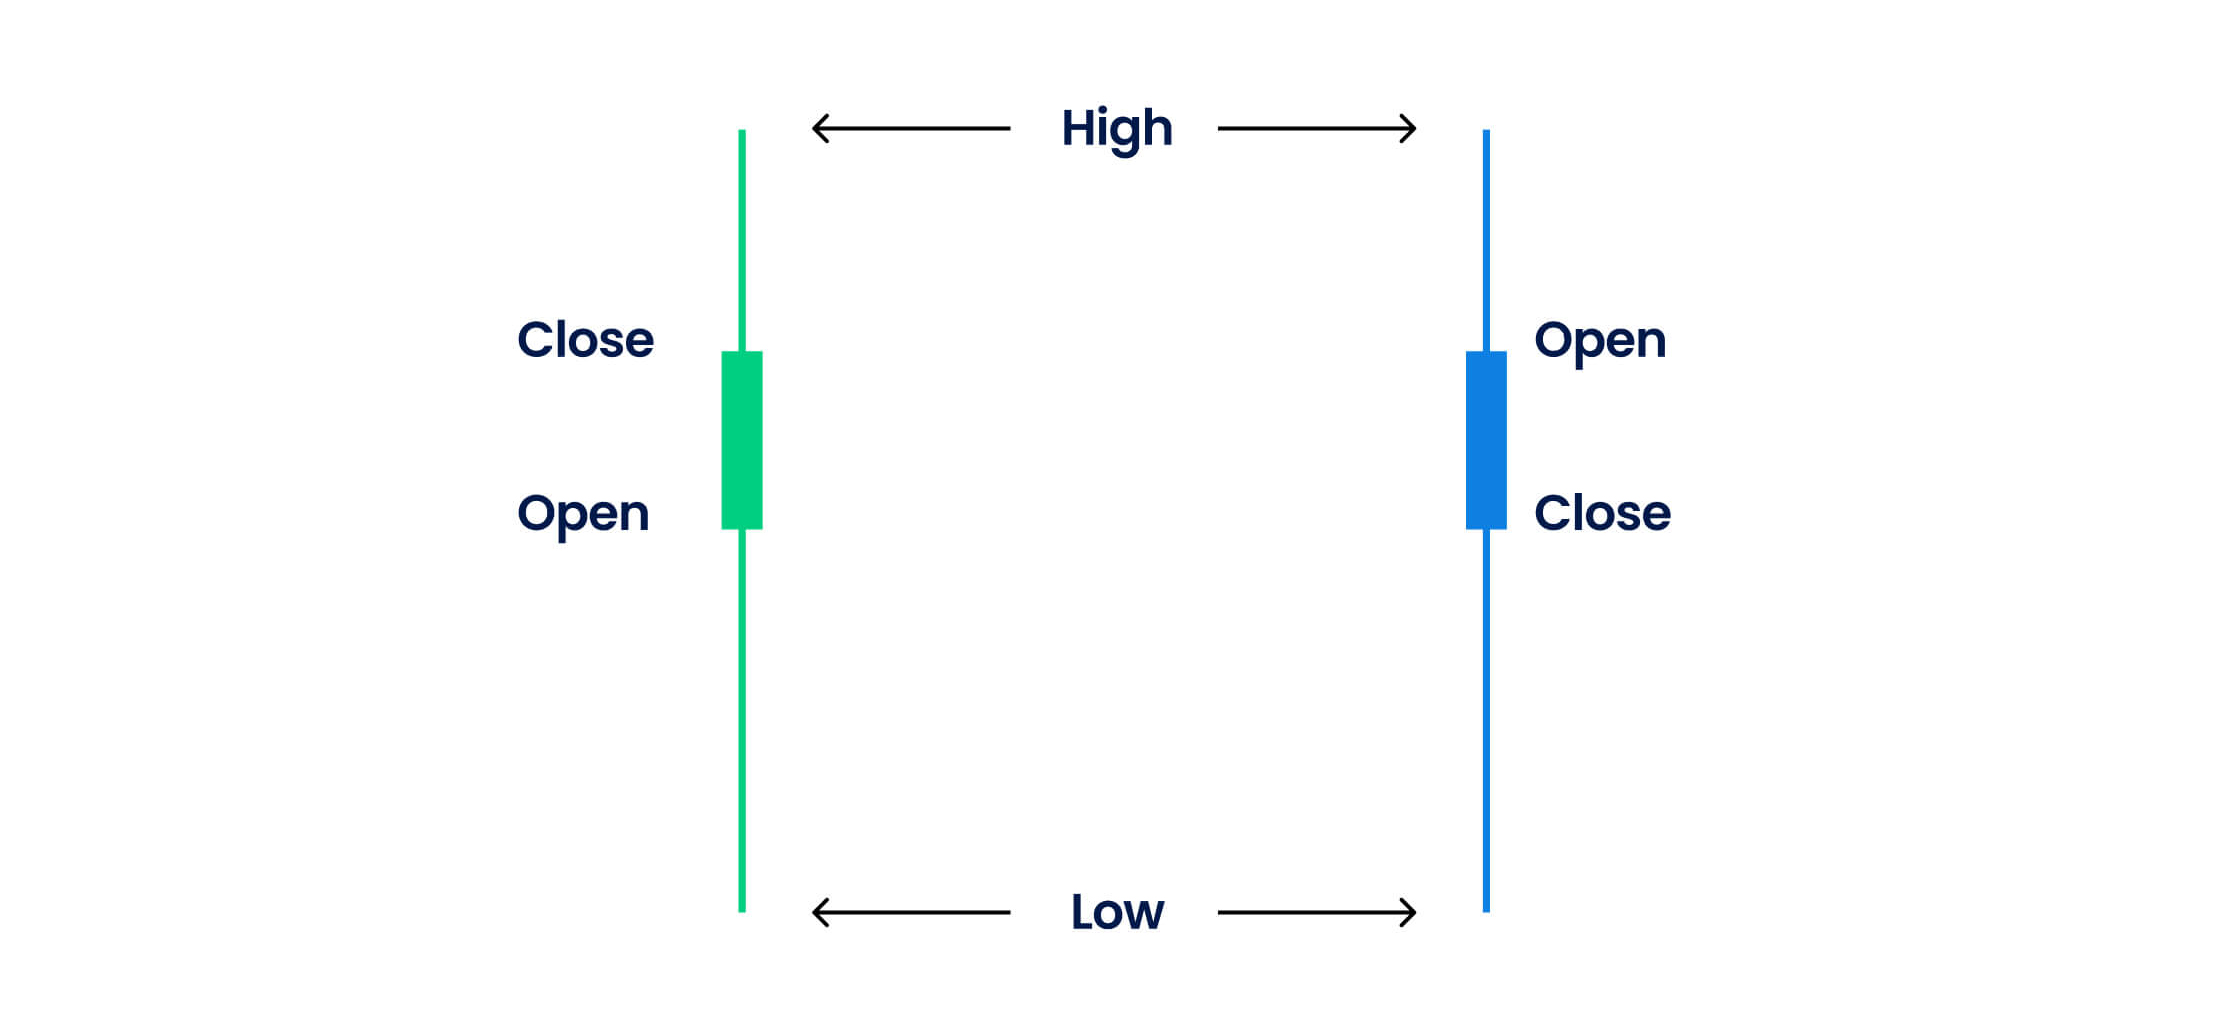
It is important to note that candles in the Heikin Ashi pattern with less or no shadow on top signal strong selling pressures in the market. On the other hand, candles with less or no lower shadow signal strong buying pressures in the market.
What is the Heikin Ashi formula?
The Heikin Ashi (HA) formula is a technical analysis indicator that smooths out price fluctuations and provides a clearer trend view. It calculates the open, high, low, and close (OHLC) values for each candlestick on the candlestick chart based on the previous candlestick's data.
Here's the formula for calculating the Heikin Ashi values –
- HA open: (Previous open + previous close) / 2
- HA high: Maximum of (current period high, previous close, open)
- HA low: Minimum of (current low, previous close, open)
- HA close: (current open + current high + current low + current close) / 4
Calculating the Heikin Ashi Candlestick
The Heikin Ashi Candlestick calculation helps traders get all the separate candlesticks that the pattern consists of through the set of four price points - the high price, low price, open price, and close price.
- The first Heikin Ashi close price (indicating the current bar's average price) = 1/4 (open price + high price + low price + close price)
- The first Heikin Ashi open price (indicating the midpoint of the previous bar) = 1/2 (the opening price of the last bar + closing price of the last bar)
- The first Heikin Ashi high price (the highest price point in the period taken) = Maximum Value [High price, Open price, Close price]
- The first Heikin Ashi low price (the lowest price point in the period taken) = Minimum Value [Low price, Open price, Close price]
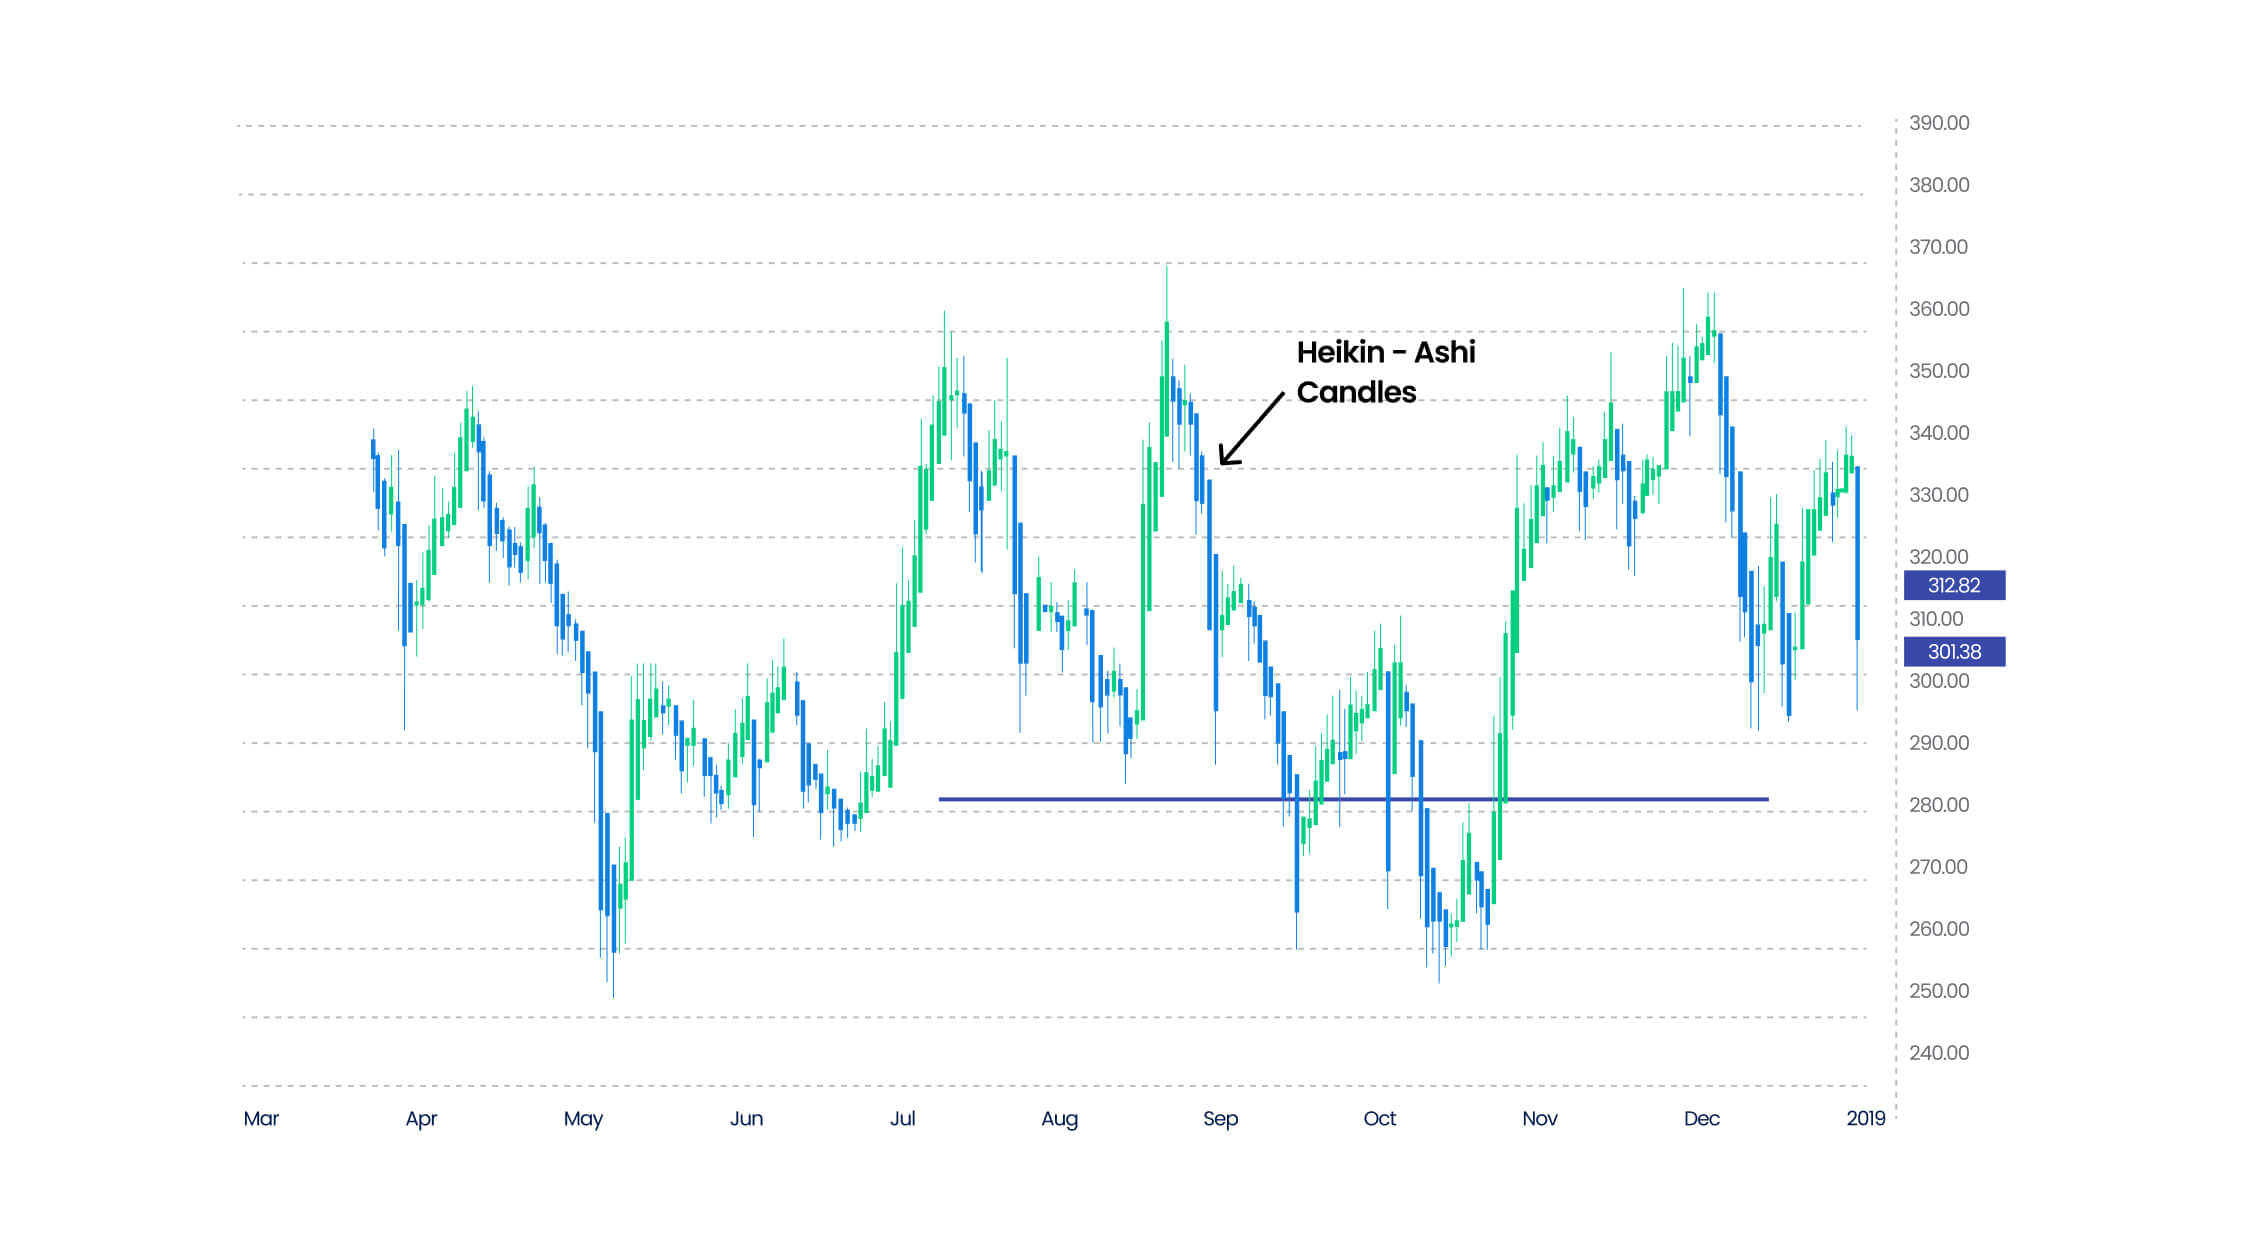
Trading the Heikin Ashi Candlestick pattern
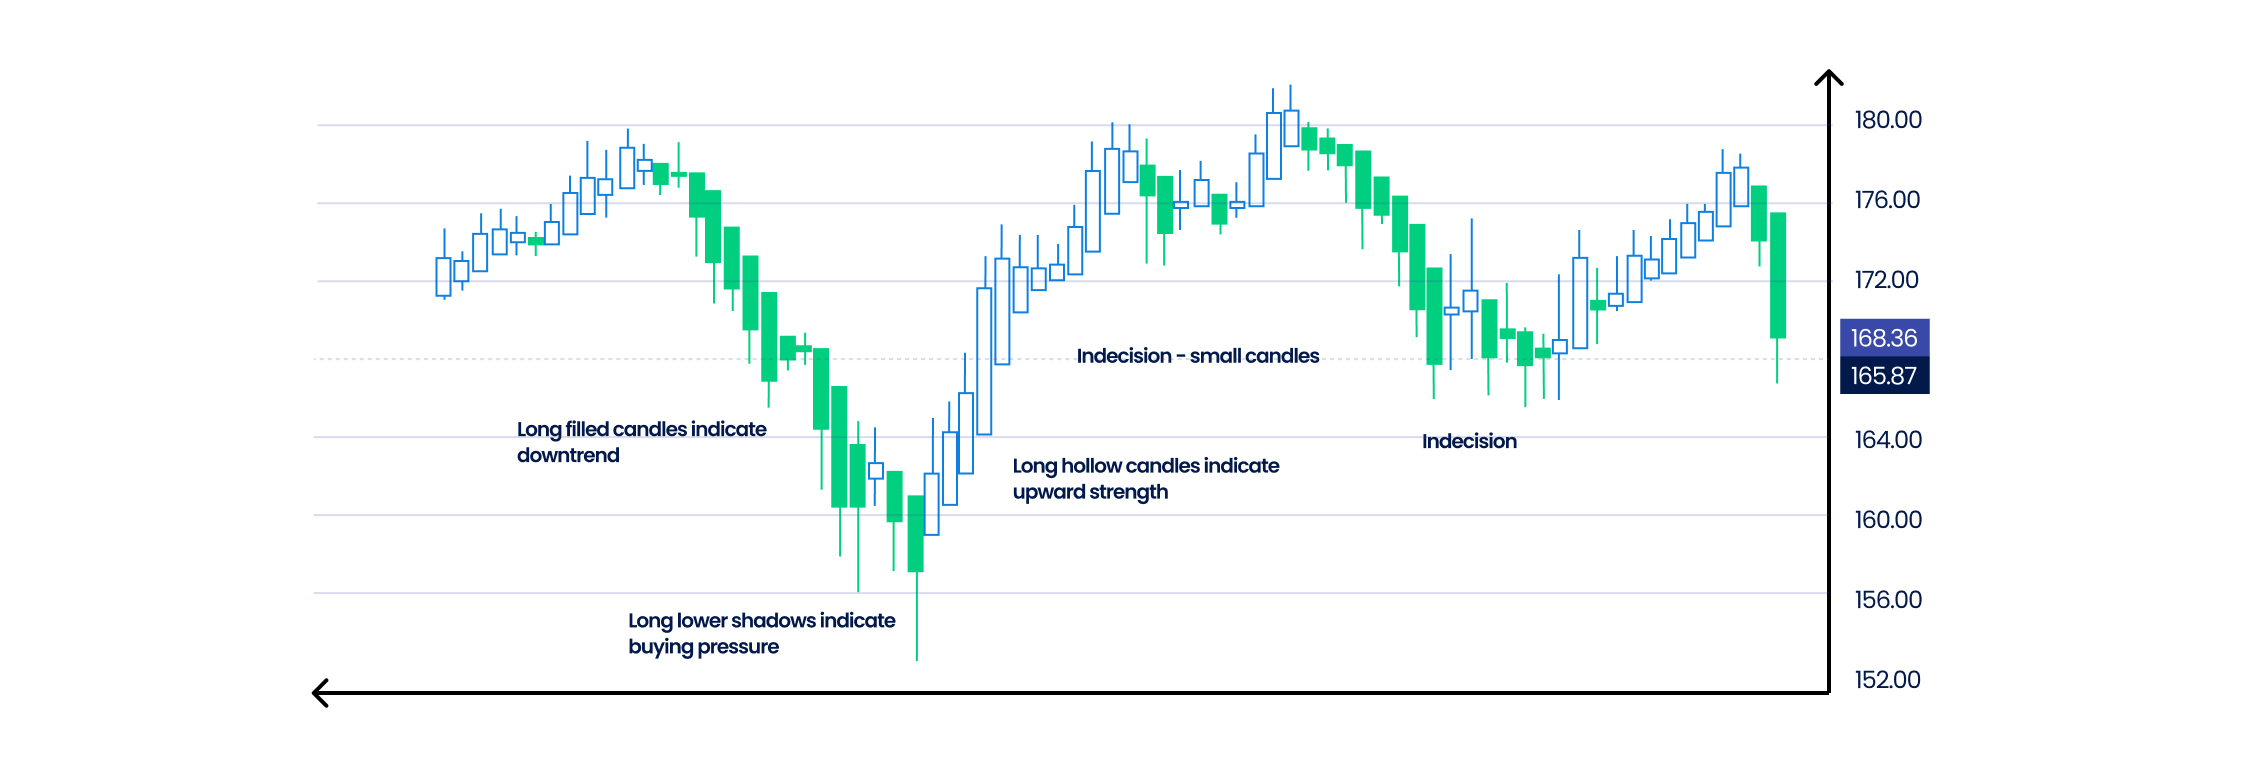
- When the candles do not have any lower shadows/tails or appear green in color, they indicate a strong market uptrend, signaling traders to enter long positions.
- All hollow candles send a bullish trend indication, signaling traders to exit short positions as soon as possible
- Filled, red, or candles that do not have higher shadows indicate a strong downtrend/bearish trend, indicating traders to short positions and exit long positions.
- When a candle has a short body and is surrounded by lower and upper shadows/tails, it indicates a market trend reversal where traders can either enter or exit the market as per the market direction.
- In the above situation, traders who wish to maximize profits enter into a short position when the market is in an uptrend and expected to reverse (with falling prices). Similarly, they enter a long position if the market is in a downtrend and it is expected to witness increasing prices.
Top three use cases of Heikin Ashi Candlestick
1. Identifying the candlesticks without shadows
The Heikin Ashi Candlestick pattern helps traders identify the candlesticks that come without any lower shadow, which are responsible for depicting a strong bullish trend. The beginning of this bullish trend enables trades to enter long positions in the market to gain maximum potential profits. The higher the number of candlesticks in a pattern without a tail/shadow, the stronger is the trend expected to be, with higher certainty about the profits. On the other hand, the pattern also enables traders to identify candlesticks without any upper shadows, which depicts a strong yet stable downward bearish trend with falling prices, signalling traders to short the positions to minimise losses.
2. Ascertaining the trend pauses and reversals
In the Heikin Ashi Candlestick pattern, the candles with small bodies signal traders about market trend reversals and pauses. A smaller candle opens right after the first candle in a continued trend and either closes above or below, indicating the trend reversal. Thereafter, a third candle, also with a small body, is formed to confirm the market's trend reversal.
3. Determining strong bullish and bearish market trends
The Heikin Ashi Candlesticks also help traders identify when to enter or exit the market by providing the strong bullish or bearish trend reversal points in the chart. As soon as a bullish trend emerges, traders exit their short positions and take long positions to maximise profits. Whereas, as soon as a bearish trend emerges, traders exit their long positions and take short positions to minimise losses.
*This is an example only to enhance a consumer's understanding of the strategy being described above and is not to be taken as Blueberry providing personal advice.
How to use Heikin Ashi to identify trend direction and strength
Trend direction
- Uptrend: When the Heikin Ashi candles have consistently higher closes than the previous candles, it indicates a strong uptrend. The green candles will be longer than the red ones.
- Downtrend: When the Heikin Ashi candles have consistently lower closes than the previous candles, it indicates a strong downtrend. The red candles will be longer than the green ones.
- Sideways trend: When the Heikin Ashi candlestick is indecisive, with no clear upward or downward bias, it indicates a sideways trend.
*This is an example only to enhance a consumer's understanding of the strategy being described above and is not to be taken as Blueberry providing personal advice.
Trend strength
- Uptrend: When the Heikin Ashi candles have consistently higher closes than the previous candles, it indicates a strong uptrend. The green candles will be longer than the red ones.
- Downtrend: When the Heikin Ashi candles have consistently lower closes than the previous candles, it indicates a strong downtrend. The red candles will be longer than the green ones.
- Sideways trend: When the Heikin Ashi candlestick is indecisive, with no clear upward or downward bias, it indicates a sideways trend.
Benefits and risks of Heikin Ashi candlesticks
Benefits
Smoother trend identification
Heikin Ashi charts provide a clearer picture of underlying trends by filtering out market noise and focusing on closing prices. This can help technical traders identify potential support and resistance levels.
Reduced false signals
Heikin Ashi candlesticks are less likely to generate false signals compared to traditional candlesticks, as they are based on a combination of open, high, low, and close prices. This can lead to fewer losing trades and improved overall performance.
Enhanced trend confirmation
Heikin Ashi can be used to confirm trends identified by other technical indicators, such as moving averages or Bollinger Bands. This can increase traders' confidence in their trading decisions.
Improved risk management
By providing a clearer view of trends and potential reversal points, the Heikin Ashi chart can help traders manage risks better. For example, traders can use the Heikin Ashi chart to set stop-loss orders at support levels or take-profits at resistance levels.
Risks
Lagging indicator
Heikin Ashi is a lagging indicator, meaning it may not provide signals as quickly as other indicators. This can lead to missed trading opportunities or late entries.
False breakouts
While the Heikin Ashi chart can help reduce false signals, false breakouts can still occur.Traders should be cautious and use other indicators to confirm signals.
Overreliance
Relying solely on the Heikin Ashi chart without considering other technical indicators or fundamental analysis can increase the risk of making poor trading decisions. It is better to use the Heikin Ashi as one tool among other technical analysis tools for more accurate trading decisions.
Individual interpretation
The interpretation of Heikin Ashi candlesticks can vary from trader to trader. It is important to develop one's own understanding of the indicator and how it fits into their trading strategy.
Combining Heikin Ashi with other traditional candlestick charts
Heikin Ashi and Japanese candlesticks
Combining Heikin Ashi with a traditional Japanese candlestick chart provides a clearer perspective on both upward and downward market trends. The visual contrast between the two types of HA candles highlights areas of agreement or divergence, providing additional insights into the underlying price data action. If both the Heikin Ashi chart and the Japanese candlestick chart indicate the same trend direction, it can strengthen the confirmation of the existing trend.
Additionally, comparing the two can help identify potential false breakouts where one indicator signals a reversal while the other suggests a continuation of the trend.
Heikin Ashi and Renko charts
Renko charts focus on average price changes of a specific magnitude, filtering out market noise and providing a clearer view of trends. By combining Heikin Ashi charts with Renko charts, traders can gain from the smoothing effect of Renko charts while also gaining insights from the trend-identifying capabilities of Heikin Ashi. This combination can be useful in identifying trend reversals and potential turning points.
Heikin Ashi and Kagi charts
Kagi charts are another type of chart that focuses on price reversals of a specific magnitude. Combining Heikin Ashi charts with Kagi charts can provide a comprehensive analysis of trends and potential turning points. Heikin Ashi charts can help identify the direction of the trend, while Kagi charts can provide insights into the strength and duration of the trend.
Heikin Ashi and point-and-figure charts
Point-and-figure charts are used to measure trend strength and identify potential reversal points. By combining Heikin Ashi charts with point-and-figure charts, traders can better understand market dynamics and make more informed decisions. Heikin Ashi can provide a visual representation of the trend direction, while point-and-figure charts can help quantify the strength of the trend.
Heikin Ashi and Ichimoku Kinko Hyo
The Ichimoku Kinko Hyo is a technical analysis indicator that provides signals for trend direction, support and resistance levels, and potential reversal points. Combining Heikin Ashi with Ichimoku Kinko Hyo can provide a powerful tool for identifying trends and making informed trading decisions. Heikin Ashi can help visualize the trend direction, while Ichimoku Kinko Hyo can provide additional signals and confirmation.
Heikin Ashi and three-line break
The three-line break technical indicator signals potential trend reversals. Combining Heikin Ashi with a three-line break can help identify potential turning points in the market. Heikin Ashi charts can provide a clearer view of the trend direction, while three-line break signals potential reversals.
Trade the Heikin Ashi Candlestick pattern to level up your trading strategy
This means the Heikin Ashi Candlesticks do not have any irrelevant price fluctuations. All the noise is filtered out for the traders to only receive significant price points necessary to trade in the market. Blueberry. is a leading, globally regulated trader that gives you access to a seamless trading experience and advanced trading tools to make trading more profitable for you. Sign up for a live trading account or try a demo account to make the most out of the Heikin Ashi Candlestick pattern.
Trade smarter with low spreads and lightning-fast executions. Open a live account today and experience unparalleled support from our dedicated customer service team. Blueberry is here to help every step of the way!
Trade Now Open a Demo Account