One of the most classic chart patterns, the ABCD pattern represents the perfect harmony between price and time. It can be used to identify trading opportunities in the Forex market, weighing the risks and rewards before making a trade, and it can even form the basis for other patterns. The Forex ABCD pattern gives the highest probability of the trade entry point to the trader at the completion of the pattern point (D), making it an important concept for Forex traders to understand.
What is the ABCD Pattern?
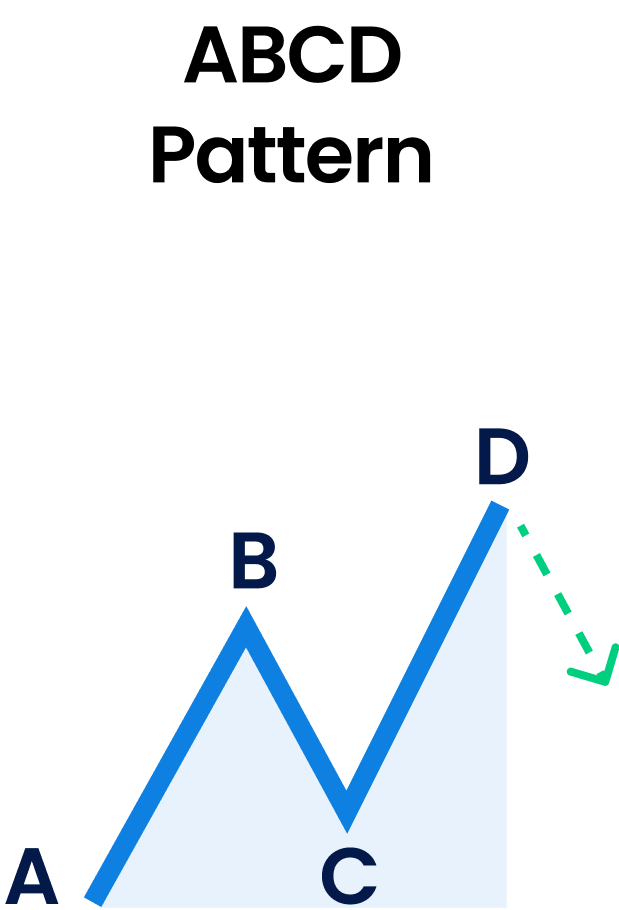
ABCD pattern is a graphical representation with three price swings in a rhythmic style, depicting where the market moves. It has 3 consecutive price trends, looking like a lightning bolt on a price chart which helps determine where and when to exit and enter a trade. It consists of two equivalent price legs and helps the trader identify when the currency price is going to change directions. The pattern can predict both bullish and bearish reversals. It is important to note that when you enter the Forex market based on the ABCD pattern, you must set up a stop-loss order in order to protect yourself against any unexpected price move. Your exact stop-loss location should be beyond the extreme ABCD pattern price.
How to draw an ABCD pattern?
A trader can recognize the ABCD pattern through the price behavior when it starts moving in a new direction, known as A. The price then moves further to create a critical swing level B, which is at a higher level than A. It then retraces to a position as A's leg, which we call C. The swing finally resumes and continues till it is finally at a point that has an equal distance to AB, which is seen as DA. When the leg of CD finally reaches a similar length to the leg of AB, there is a reverse mechanism that takes place for the CD price swing.
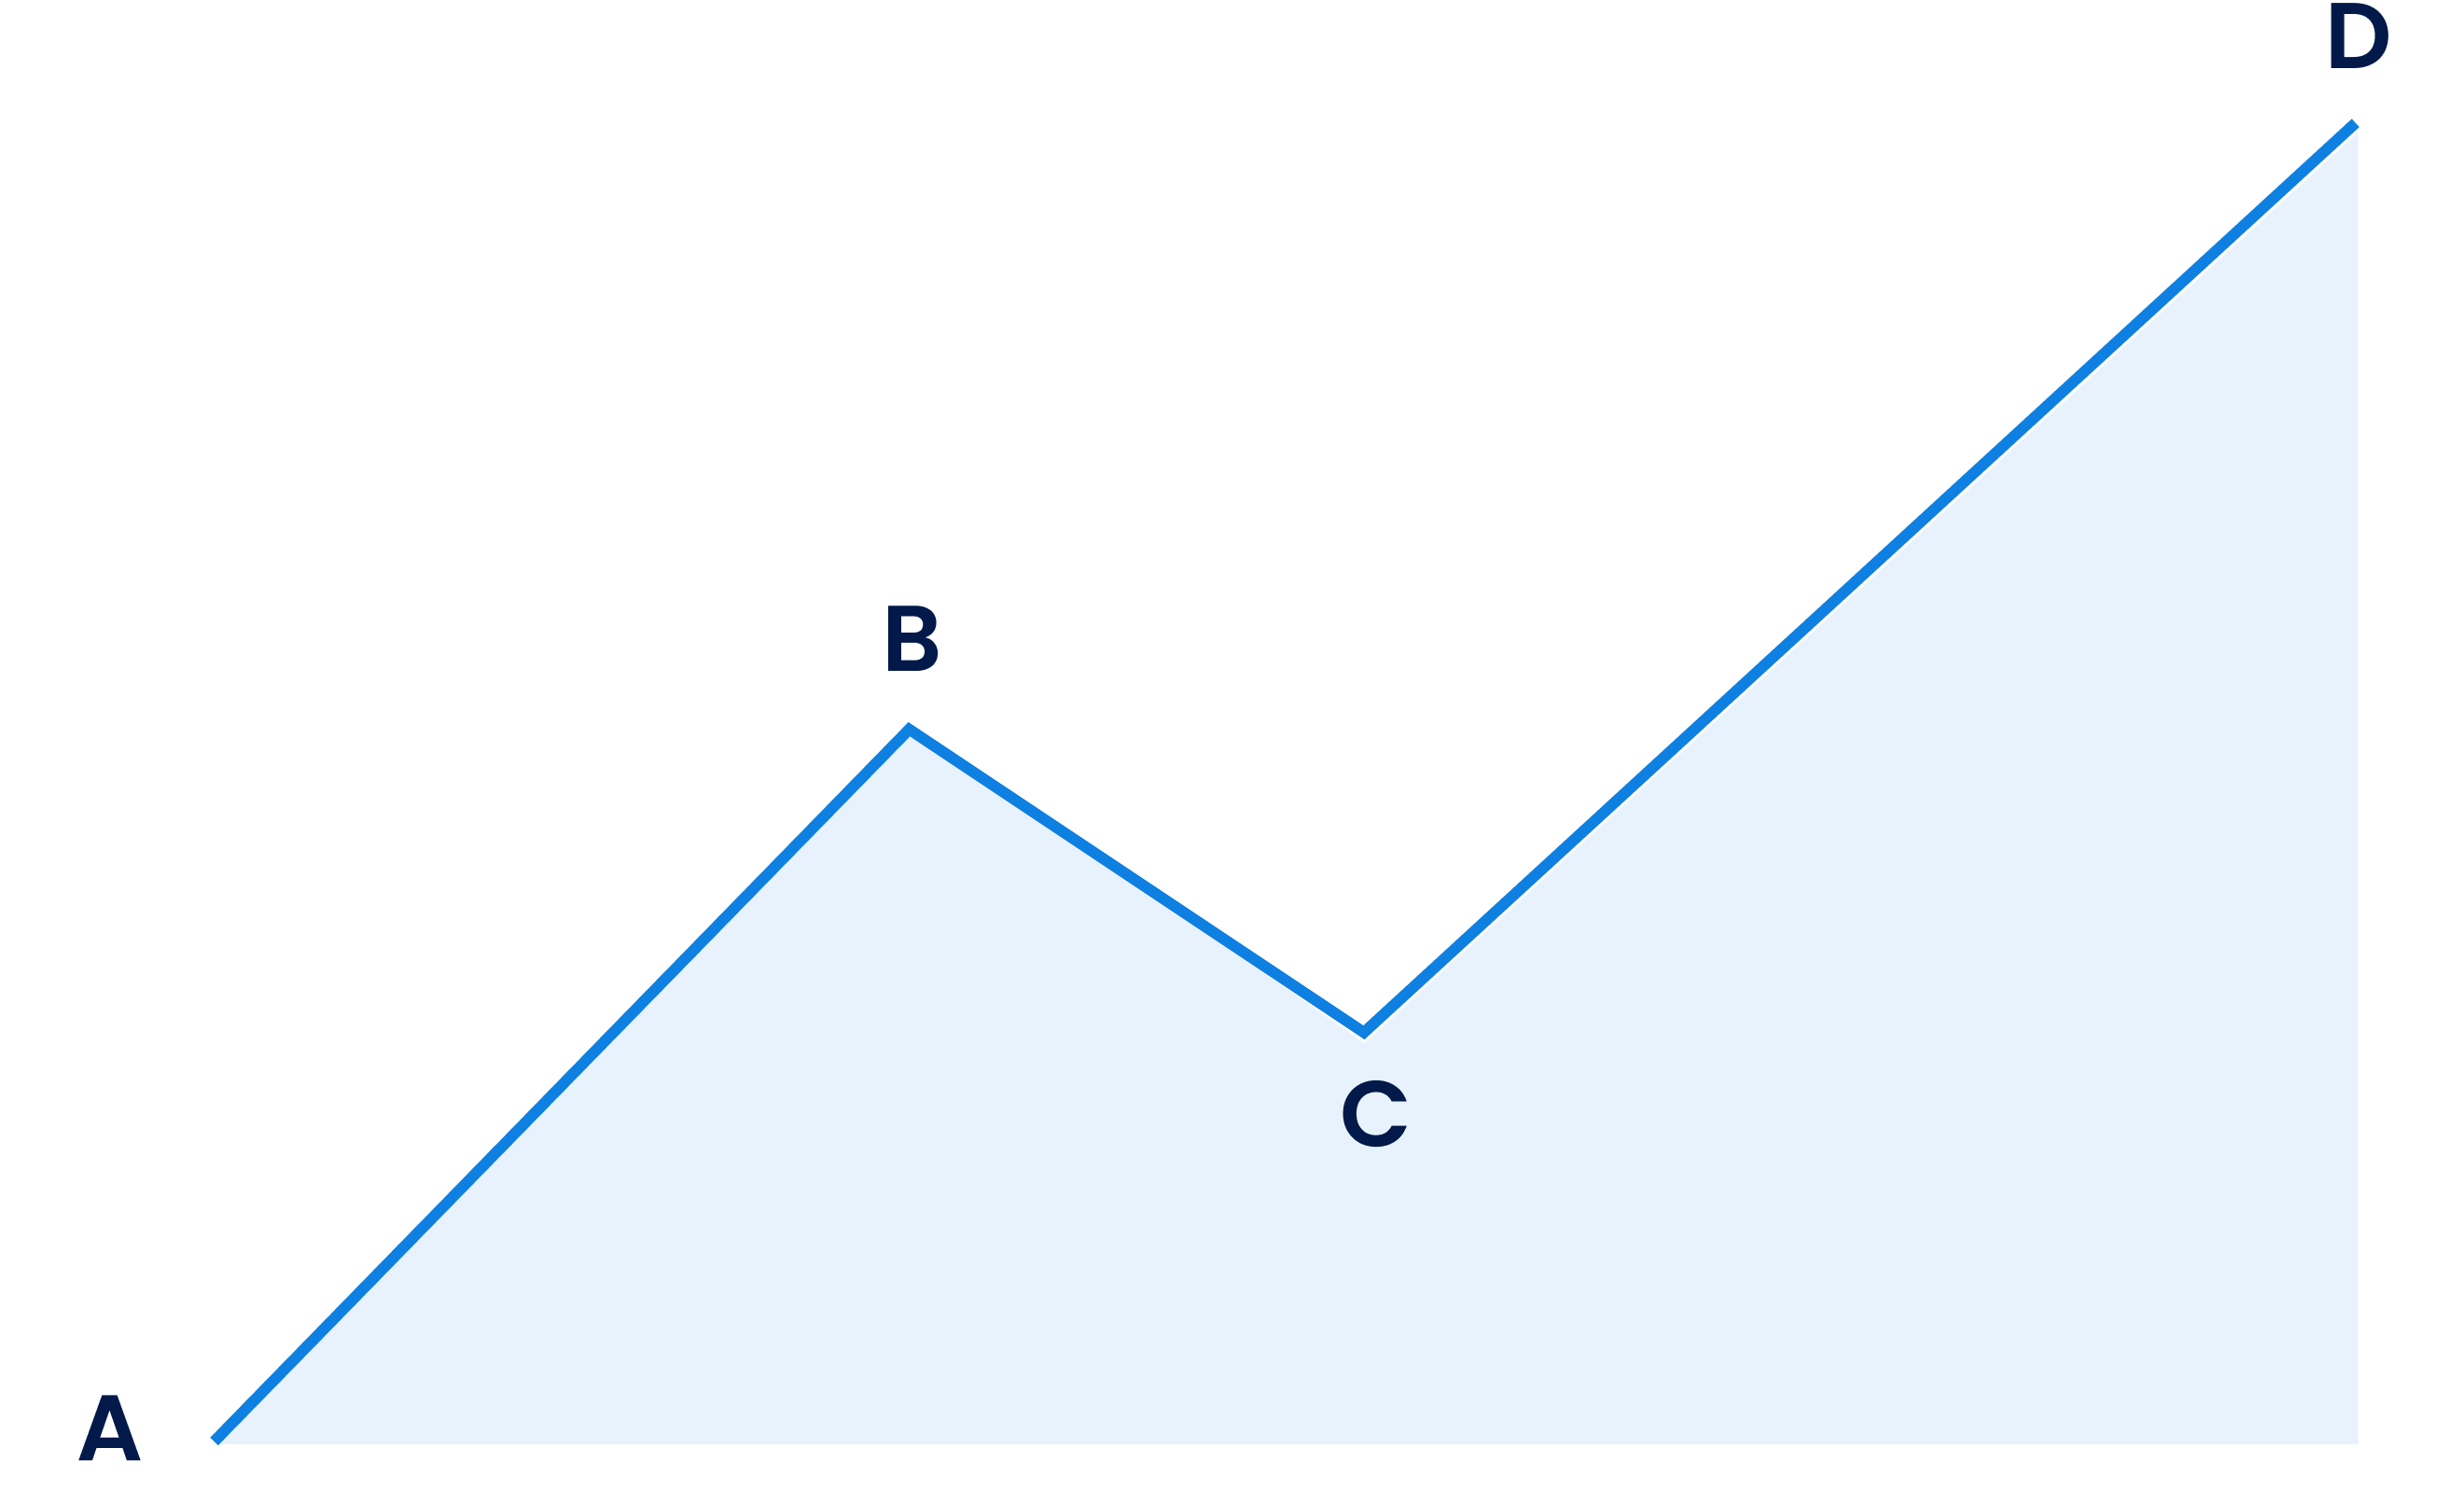
There are mainly two types of ABCD patterns -- bullish ABCD pattern and bearish ABCD pattern.
Identifying the ABCD Pattern
Since each pattern has both bearish and bullish versions, they help identify opportunities to buy and sell. Bullish patterns help identify more significant opportunities to buy, and bearish patterns help identify higher selling opportunities. Each turning point in the pattern represents a high or a low on the price chart, telling the trader the exact moment to either buy or sell the trade, i.e., enter or exit the trade point.
Bullish ABCD
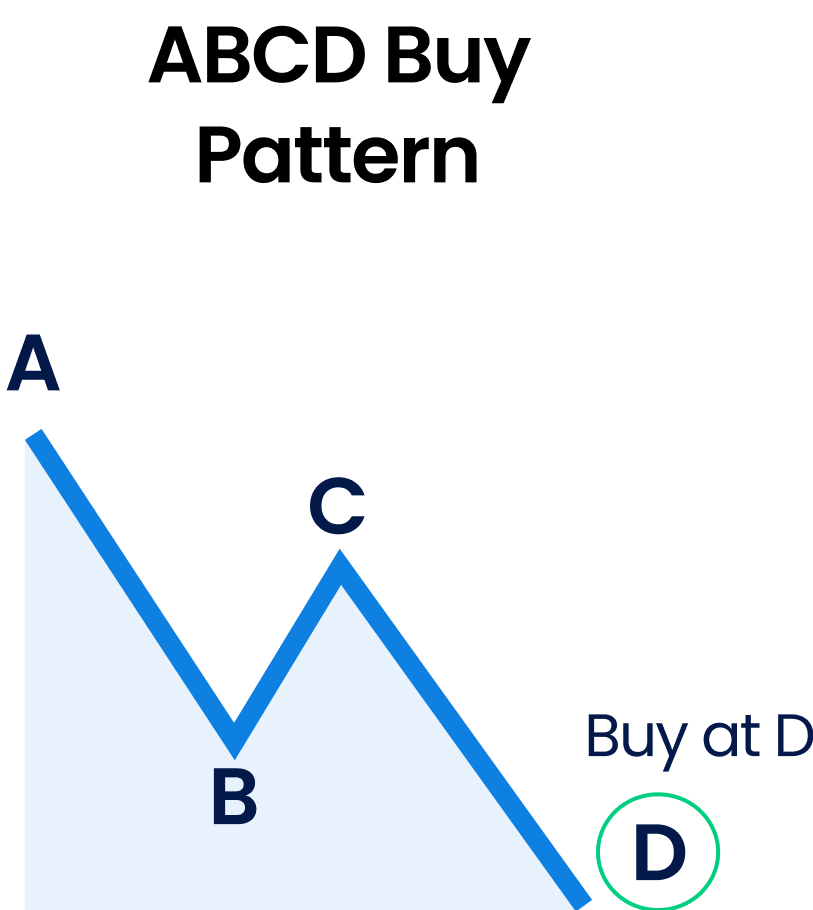
The bullish ABCD pattern commences with a price fall or a lower price. It is identified through a zig-zag pattern that starts at A, which extends to the price swing that we call B. The pattern is then followed by a reverse and rise in price, known as BC, which is then reversed to a bearish move (CD), completing the pattern. The D point falls below point B. Once the price completes the CD price swing, there is a reversal and an increase in the price once the price touches point D.

Bullish ABCD pattern rules:
- AB is where A is significantly higher and B is significantly lower
- In the A to B move, there are no higher points than A and no lower points than B
- Find BC, where C must be a lower point than A.
- In the move from B to C, there can be no lows below B and no highs above C
- Draw CD, where D is lower than B.
- There is no higher point above C in the C to D move, and no point is lower than D.
- CD price shall always be equal to AB price.
Bearish ABCD
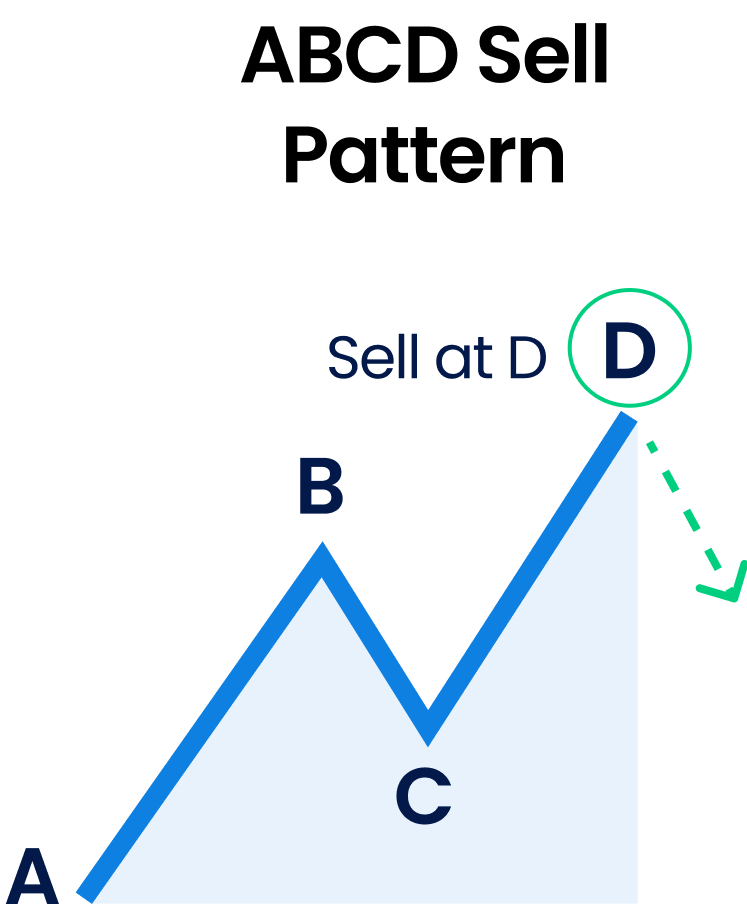
The bearish ABCD pattern is the exact opposite of the bullish ABCD pattern. It starts with a bullish pattern, at point AB initially, where point A is at the bottom and B is the increased price swing. It is then reversed with a bearish move called BC. The BC price move is then changed by a bullish move called CD, which goes above point B. The price is reversed again, creating a brand new bearish ABCD point once the chart is formed in the ABCD pattern. It is a complete zig zag cycle that continues repeatedly. Once the price swing reaches point D, it drops down further as a decrease in the price caused due to the reversal, once again.
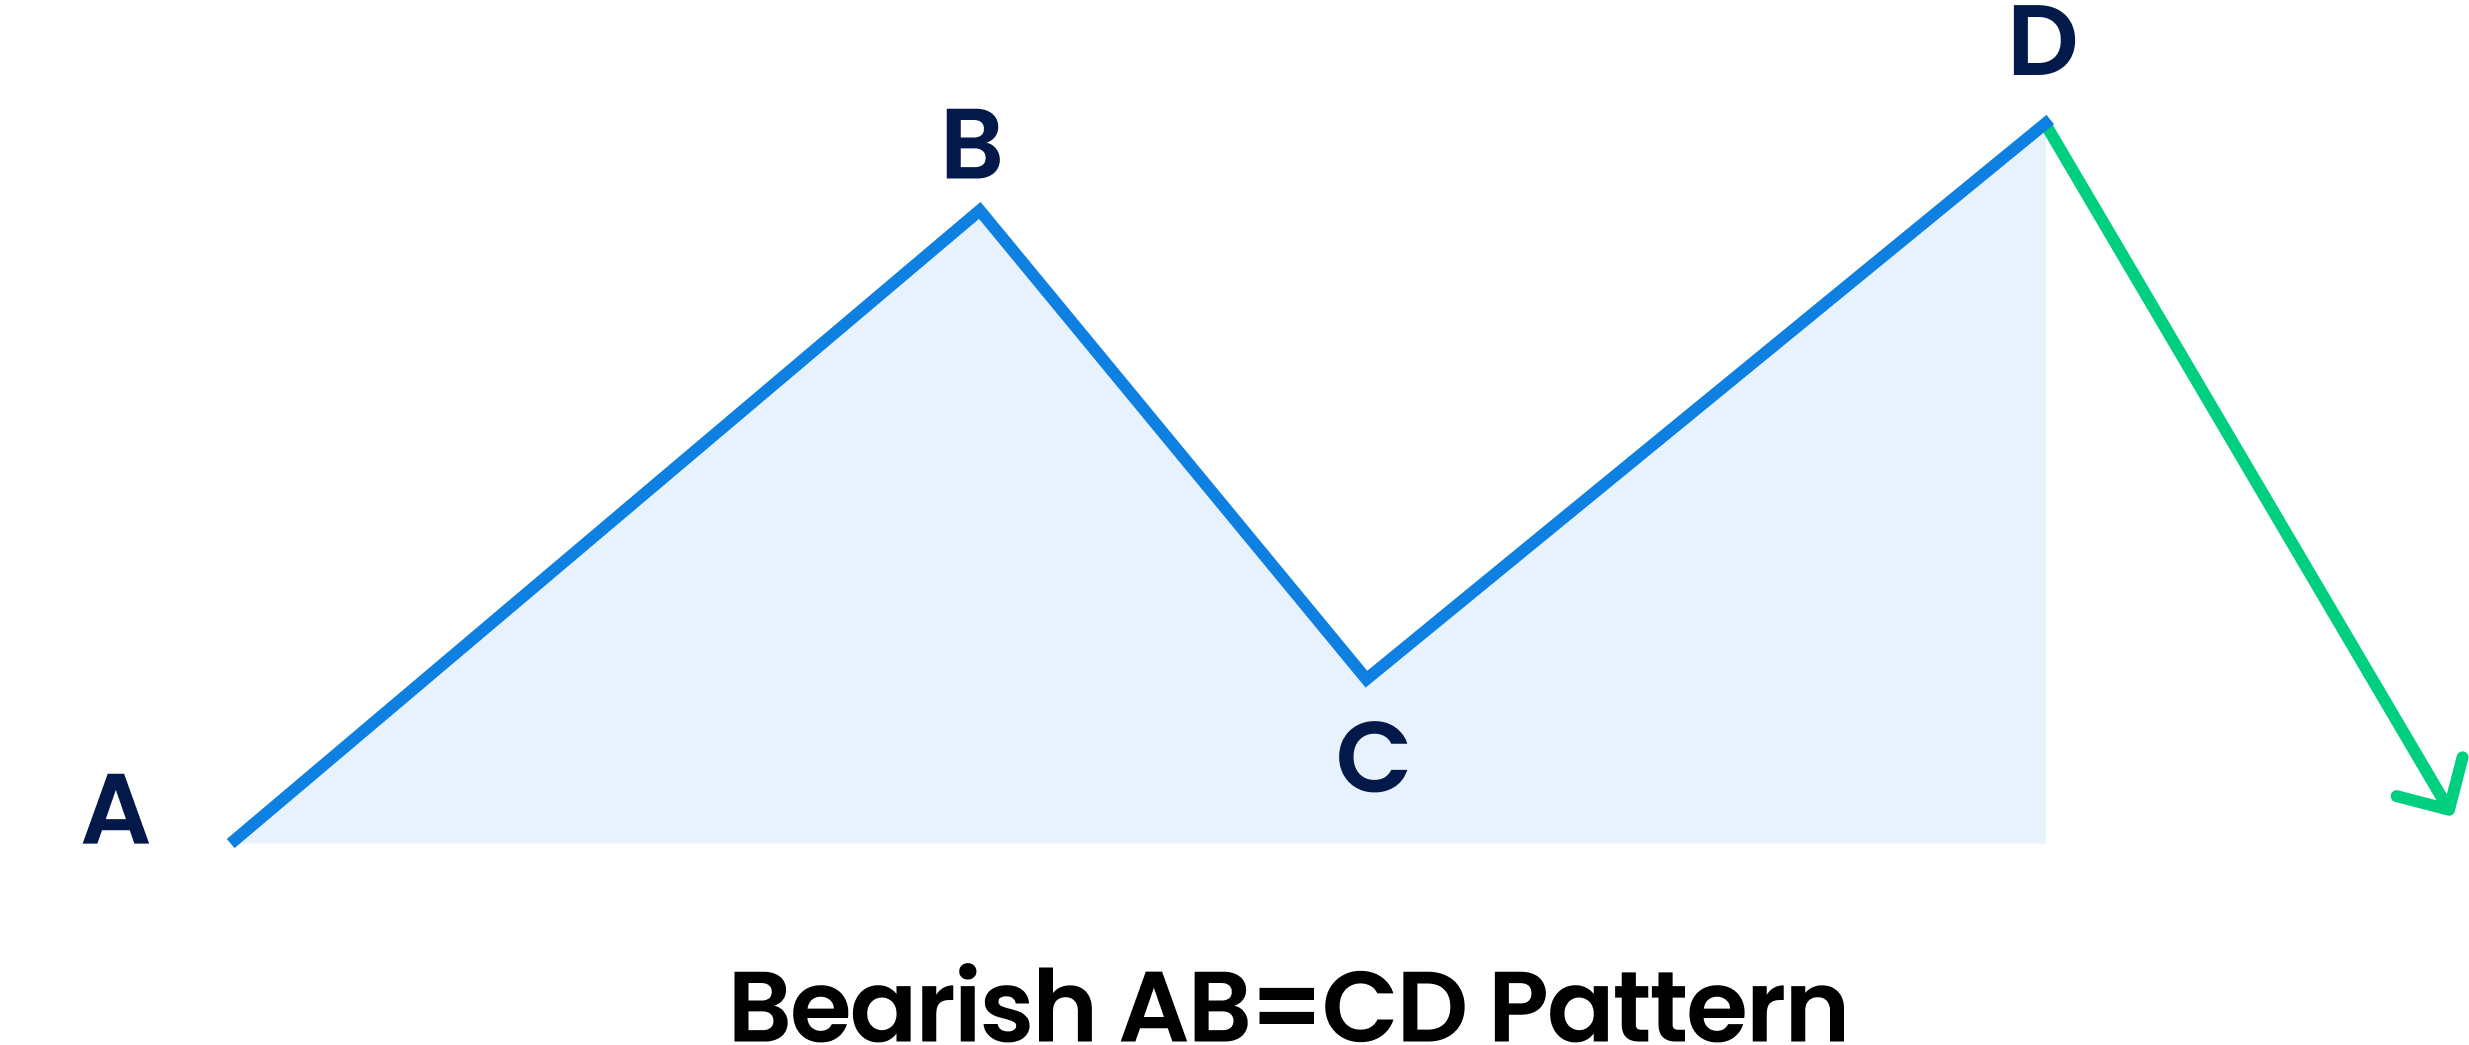
There are a total of three price moves in the ABCD pattern. These are called the leg of AB, the leg of BC, and the leg of CD. A trade is only initiated when the leg of CD reaches a distance same as the leg of AB.
Bearish ABCD pattern rules:
- AB is where A is significantly lower and B is significantly higher
- In the move from A to B, no point can be below A and above B.
- Find BC, where C must be higher than A.
- In the B to C move, no point can be higher than B and lower than C.
- Draw CD after identifying BC.
- Point D is always higher than point B.
- In the C to D move, no point can be lower than D and higher than D.
Final words
Once the ABCD chart analysis is performed, the trader must validate the pattern keeping in mind the pattern rules discussed above. In a bullish pattern, the trade can go on for a long time, placing a stop-loss order below D. A trader should then keep staying in the Forex trade until the price reaches C. However, in a bearish pattern, shorting the Forex pair is an intelligent decision. The trader should put the stop loss above D and remain in the trade until and unless the price finally reaches C. Our trading platform has transparency and reliability as its core principles, which helps you make efficient trades with accurate information and clear regulations.
Disclaimer:
- All material published on our website is intended for informational purposes only and should not be considered personal advice or recommendation. Traders should carefully consider their objectives, financial situation, needs, and level of experience before entering into any margined transactions.


