


Understanding market trends enables traders to place successful entry and exit orders—but knowing when a trend will continue is where the real edge lies. Continuation patterns can help confirm the existing market trends and find the right timing for you to place orders. While many traders focus on dramatic reversals, continuation patterns actually account for the majority of trading opportunities, appearing in approximately 60-70% of trending markets.
These chart formations signal temporary pauses before the trend resumes its original direction, offering strategic entry points for traders who know what to look for. The key is recognizing the pattern, confirming it with volume, and executing with proper risk management.
The following information is provided solely for educational purposes and does not constitute personal advice or a recommendation to trade margin FX/CFDs.
Key Takeaways: Mastering Continuation Patterns
-
What they are: Continuation patterns indicate brief consolidations within existing trends, suggesting the price will resume its original direction after the pause
-
12 patterns in 6 categories: This guide covers pennants, flags, triangles, rectangles, cup and handle, and wedges—each with bullish and bearish variants
-
Volume is critical: Successful patterns show declining volume during formation, followed by at least 50% volume increase on breakout
-
Success rates vary: Research shows continuation patterns achieve 60-70% success rates when properly identified and confirmed with volume
-
Timing matters: These patterns form across all timeframes—from hourly charts for day traders to weekly charts for position traders
In this article, we delve deeper into the top continuation patterns, exploring how to identify them, trade them effectively, and avoid the common mistakes that lead to false breakouts.
What are continuation patterns?
A continuation pattern indicates if the current market trend is going to continue in the same direction or not. They help identify ideal exit/sell or entry/buy price levels in the market. The patterns suggest that a short-term price movement will resume and follow the same direction in the long-term.
-
A continuation pattern in an uptrend signals that the prices will continue increasing in the long-term
-
A continuation pattern in a downtrend signals the prices to continue decreasing in the long-term
Unlike reversal patterns that signal trend changes, continuation patterns confirm trend persistence after brief consolidations. Research from technical analysis pioneer Thomas Bulkowski shows these patterns achieve success rates ranging from 67% for flags to 87% for descending triangles when properly identified and confirmed.
Continuation patterns occur on all types of time frames like hourly charts, daily charts, weekly charts and yearly charts.
Key elements in a continuation pattern
Existing market trend
The existing trend is the one where the currency pair prices are currently trending before a new pattern forms. When forming a continuation pattern, the current trend provides traders with an expected future market direction.
Future market trend
The future market trend is the same as the existing or old market trend after the continuation pattern has occurred. This provides traders with the ideal entry or exit price levels. If the future or new market trend is an uptrend, it provides traders with buy signals, and if it is a downtrend, it provides traders with sell signals.
Consolidation area
The consolidation price area is when the currency pair prices trade in a specific zone for some time. The price range is between the support level (the level where the falling prices stop falling and start increasing) and the resistance level (the level where the rising prices stop rising and start decreasing).
Breakout level
The breakout level is where the currency pair's price changes direction and breaks out of the support or resistance level.
Volume confirmation techniques
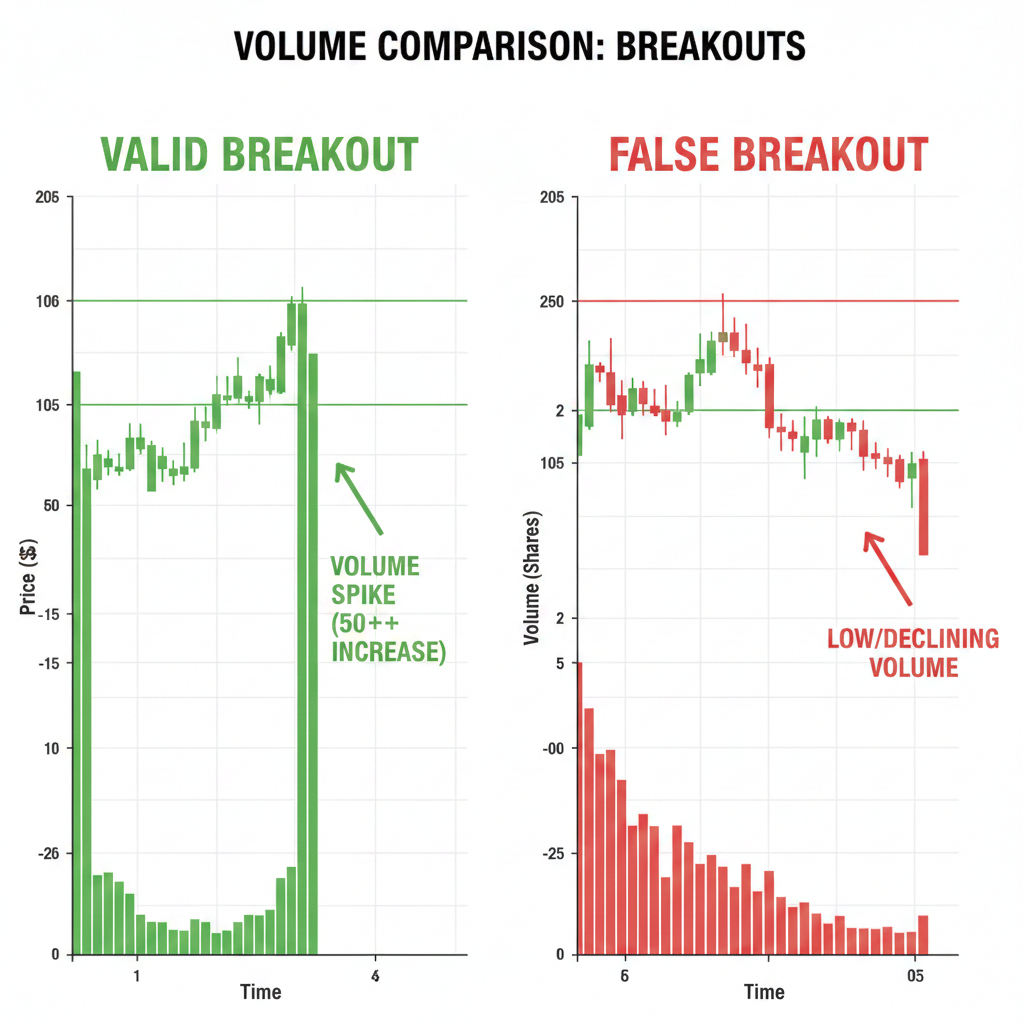
Volume behavior is the single most important factor in distinguishing valid continuation patterns from false breakouts. Understanding how volume changes throughout a pattern's lifecycle can dramatically improve your trading success rate. According to research by Thomas Bulkowski, breakouts accompanied by volume increases of 50% or more above average succeeded in 65% of cases, while those with below-average volume succeeded only 39% of the time.
Volume patterns during formation
During pattern consolidation, trading volume typically declines 30-50% from the initial trend move that preceded the pattern. This reduction indicates decreasing participation as buyers and sellers reach temporary equilibrium. Think of it as the market catching its breath after a strong move.
Declining volume during consolidation is healthy and expected—it signals the pattern is "coiling" for the next directional move. If volume remains elevated or increases during the consolidation phase, it may indicate underlying pressure that could lead to a reversal rather than continuation.
Breakout volume requirements
Valid breakouts require volume expansion of at least 50% above the consolidation period's average volume. Stronger, more reliable breakouts often show volume increases of 100% or more. This surge in participation confirms that market sentiment strongly supports the new price direction.
To measure this effectively:
-
Calculate the average daily volume during the consolidation period
-
Monitor for volume spikes when price breaks pattern boundaries
-
Use volume indicators like On-Balance Volume (OBV) or Volume Oscillator for additional confirmation
-
Pay attention to which sessions show the highest volume in forex—breakouts during the London/New York overlap (1:00-4:00 PM GMT) tend to be more reliable than those during the Asian session
False breakouts and low volume
Low-volume breakouts are red flags. When price breaks through support or resistance but volume fails to confirm with at least a 50% increase, you're likely witnessing a false breakout. These failed moves often trap traders who entered prematurely, only to see the price quickly reverse back into the pattern.
False breakouts are particularly common during:
-
Low-liquidity trading sessions
-
Holiday periods with reduced market participation
-
News events that create temporary volatility without sustained follow-through
The solution? Always wait for volume confirmation before committing capital. A breakout without volume is like an engine without fuel—it simply won't go far. Patience in waiting for proper volume confirmation can save you from costly false signals and significantly improve your pattern trading success rate.
Volume Behavior Throughout Pattern Formation
|
Pattern Stage |
Volume Behavior |
Action Signal for Traders |
|
Formation/Consolidation |
Declining 30-50% from initial trend move |
Normal pattern development—monitor for completion |
|
Breakout |
Increase of 50%+ above consolidation average |
Entry signal—confirm direction and execute trade |
|
Follow-through |
Sustained above-average volume |
Trend confirmation—hold positions or add to winners |
|
Weak breakout |
Volume increase less than 25% |
Warning signal—avoid entry or exit existing positions |
Types of continuation patterns
1. Pennants
Pennant patterns are formed during a huge move in the price of the currency pair. This large move is then followed by a consolidation zone where currency pairs trade between a range before breaking out in the same direction as the initial price move.
-
If the large price movement was in the upward direction, the prices would continue increasing after the breakout
-
If the large price movement was in the downtrend direction, the prices would continue decreasing after the breakout

Trading pennant patterns
Pennants form rapidly during high-momentum markets, typically completing within 1-3 weeks. Their compact formation makes timing crucial for optimal entries.
Entry strategy: Place buy orders 2-3% above the upper trendline for bullish pennants (or below the lower trendline for bearish pennants). Wait for a candle close beyond the boundary rather than entering on the initial touch—this reduces false breakout risk. Volume should spike at least 50% above the consolidation average to confirm the breakout.
Stop-loss placement: Position your stop 1-2 ATR (Average True Range) below the pennant's lowest point for bullish setups, or above the highest point for bearish setups. This provides enough buffer for normal price volatility while protecting against pattern failure.
Profit targets: Measure the height of the flagpole (the sharp move that preceded the pennant) and project that distance from your entry point. Conservative traders target 50-75% of the flagpole height, while aggressive traders aim for 100% or more if trend momentum remains strong.
2. Flags
A flag pattern occurs when the currency pair price witnesses a sharp upward or downward movement making the flagpole, and then trade between its support and resistance levels, making the flag’s body. Both of these trends are short-term trends. Thereafter, the currency pair prices witness a breakout in the same direction as the previous trend and start trading in the upward or downtrend direction in the long term.
- If the flagpole is created during an uptrend, the currency pair prices continue increasing after the breakout
- If the flagpole is created during a downtrend, the currency pair prices continue decreasing after the breakout

Trading flag patterns
Flags show success rates of approximately 67% for bullish flags and 63% for bearish flags when properly identified and traded with volume confirmation.
Entry strategy: Flags offer excellent risk-reward opportunities because their consolidation is typically shallow against the prevailing trend. Enter when price breaks beyond the flag's parallel trendlines with a decisive candle close. For bullish flags, this means breaking above the upper boundary; for bearish flags, below the lower boundary. Volume should increase by at least 50% on the breakout candle.
Stop-loss placement: Set stops just beyond the opposite boundary of the flag body—below the lower trendline for bullish flags, above the upper trendline for bearish flags. Add a small buffer (0.5-1 ATR) to account for volatility.
Profit targets: Like pennants, measure the flagpole height and project it from the breakout point. The parallel nature of flags makes measured moves particularly reliable. Many traders scale out at multiple targets: taking partial profits at 50% of the flagpole, then letting the remainder run toward 100% or trailing stops.
3. Triangles
A triangle pattern is a continuous consolidation pattern that occurs during the middle of a market trend and helps traders identify where the currency pairs are headed in the future. It consists of the currency pair prices narrowing in the short term, followed by a continuation according to the initial trend.
- If the currency pair prices narrow down after an uptrend, the prices continue to increase after the breakout
- If the currency pair prices narrow down after a downtrend, the prices continue to decrease after the breakout

Trading triangle patterns
Triangles take longer to form than flags or pennants—typically several weeks to months—making them more significant continuation signals. Ascending triangles achieve 83% success rates in bull markets, while descending triangles show 87% success rates.
Entry strategy: The breakout typically occurs in the final third of the triangle pattern, as the converging trendlines squeeze price into an increasingly tight range. For ascending triangles, enter when price breaks above the flat resistance line with volume confirmation. For descending triangles, enter when price breaks below the flat support line. Symmetrical triangles require careful attention to the prevailing trend—enter in the direction of that trend when price breaks through either boundary.
Stop-loss placement: Place stops beyond the opposite trendline of the breakout direction. For ascending triangles, this means below the rising support line; for descending triangles, above the descending resistance line. Allow a 1-2 ATR buffer.
Profit targets: Measure the widest part of the triangle (its height) and project that distance from the breakout point. Triangles often achieve their full measured move, making them reliable for swing traders.
4. Rectangles
A rectangle pattern is formed when the prices move strictly between the currency pair’s support and resistance levels. The particular pattern indicates that there is no trend currently. But as soon as a breakout occurs, the prices start trending according to the initial trend (that occurred before the consolidation period) and out of the rectangle.
- If the rectangle is formed after an uptrend, the prices break above the resistance level and start increasing
- If the rectangle is formed after a downtrend, the prices break below the resistance level and start decreasing

5. Cup and handle
The technical price pattern, cup and handle resemble exactly its name – a cup and a handle. The cup is a shape of a ‘u’ or inverted ‘u’, whereas the handle is either a continued downtrend or uptrend. In this pattern, the prices slowly start decreasing or increasing, followed by an opposite trend direction in the short-term, before a breakout occurs in the initial trend’s direction.
- During a downtrend, the currency pair prices decrease in the short term before increasing for a short period of time, followed by a downtrend breakout
- During an uptrend, the currency pair prices increase in the short term before decreasing for a short period of time, followed by an uptrend breakout

6. Wedges
Wedges are chart patterns that are formed by converging price lines. Both the price lines move in the same direction, almost parallel to each other before a breakout occurs. These lines are drawn by connecting a currency pair’s high price points and low price points.
- If a wedge occurs after a downtrend, the price breaks below the support level to continue decreasing
- If a wedge occurs after an uptrend, the price breaks above the resistance level to continue increasing

Top 12 continuation patterns in forex
1. Ascending triangle
An ascending triangle is a bullish continuation pattern that is created by joining the higher highs and higher lows of the currency pair prices. The two lines joined together form a triangle with a price breakout in the upward direction. It provides traders with ideal long or buy signals.
2. Descending triangle
A descending triangle is a bearish continuation pattern that is created by joining lower highs and lower lows of the currency pair prices. The two lines joined together form a downward sloping triangle with a price breakout in the downward direction. It provides traders with ideal short or sell signals.
3. Bullish pennant
A bullish pennant pattern is an uptrend continuation pattern that is formed as a currency pair makes higher highs in the market. The currency pair price trades within a range for some time before breaking above the resistance level and continuing the uptrend. This pattern helps traders identify ideal long or buy signals.
4. Bearish pennant
A bearish pennant pattern is a downtrend continuation pattern that is formed as a currency pair makes lower lows in the market. The currency pair price trades within a range for some time before breaking below the support level and continuing the downtrend. This pattern helps traders identify ideal short or buy signals.
5. Bullish flags
Bullish flags are formed during an uptrend when the prices are continuously increasing before showing a slow consolidation in the short term. The consolidation period ends as soon as the currency pair prices break above the resistance level to continue the uptrend and provide traders with ideal entry signals in the market.
6. Bearish flags
Bearish flags are formed during a downtrend with the prices continuously decreasing before showing a slow consolidation in the short term. The consolidation period ends as soon as the currency pair prices break below the support level to continue the downtrend and provide traders with ideal exit signals in the market.
7. Bullish rectangle
Bullish rectangles are an uptrend continuation pattern in which the currency pair prices trade between their resistance and support levels in the short term before breaking in an upward direction. This pattern provides traders with the ideal price levels to place a buy order.
8. Bearish rectangle
Bearish rectangles are a downtrend continuation pattern in which the currency pair prices trade between their resistance and support levels in the short term before breaking in a downward direction. This pattern provides traders with the ideal price levels to place a sell order.
9. Bullish cup and handle
Bullish cup and handle patterns resemble a 'u' shape cup followed by a handle that is made from a series of falling prices. A price breakout occurs as the handle ends and prices start increasing again, following an extended uptrend. Traders receive a signal to enter buy positions at the end of the pattern's handle.
10. Bearish cup and handle
Bearish cup and handle patterns resemble an inverted 'u' shape cup followed by a handle that is made from a series of increasing prices. A price breakout occurs as the handle ends and prices start decreasing again, following an extended downtrend. Traders receive a signal to enter sell positions at the end of the pattern's handle.
11. Bullish wedges
Bullish wedges are an uptrend continuation pattern that is formed by lower lows and lower highs in the market. The prices begin to contract in the downward direction and trade between the support and resistance levels before reaching a point of breakout. After this point, the prices continue to increase again. This pattern provides traders with the ideal signals to enter a trade.
12. Bearish wedges
Bearish wedges are a downtrend continuation pattern that is formed by higher highs and higher lows in the market. The prices begin to contract in the upward direction and trade between the support and resistance levels before reaching a point of breakout. After this point, the prices continue to decrease again. This pattern provides traders with the ideal signals to exit a trade.
How to trade a continuation pattern
1. Identify the existing trend
The first step to trade a continuous pattern is to identify the existing trend, as it would provide you with an idea about the future market trend. If you identify an uptrend, prices are most likely to break above the resistance level, and if you identify a downtrend, prices are most likely to break below the support level.
2. Look for the period of consolidation
The period of consolidation is when the currency pair prices trade between their support and resistance levels for some time before breaking in a downward or upward direction. When currency pair prices break below the support level, it confirms a downtrend, and when they break above the resistance level, it confirms an uptrend.
3. Identify ideal entry or exit levels
Once the currency pair prices have traded in the consolidation zone for some time, it is time for you to identify the ideal entry (buy) or exit (sell) levels in the market before the breakout. During an uptrend, the ideal entry level is at the resistance level, and during a downtrend, the ideal exit level is at the support level.
4. Place the order before the breakout
Place the entry or exit orders as per the existing trend before the breakout occurs to make the most of the continued trade. You can also place stop-loss orders right at the breakout level.
5. Monitor markets thereon
After you have made an entry or exit decision, keep monitoring the markets thereon in order to closely analyze where the currency pairs are headed in the future. If the pattern continues in the same direction, you can hold onto the trades. However, if you feel the market can potentially reverse, make a trading decision opposite to what you had initially decided. This means, place an exit order if you entered a buy trade during an uptrend and place an entry order if you placed a sell trade during a downtrend.
Frequently asked questions about continuation patterns
What are continuation patterns in forex trading?
Continuation patterns are chart formations that signal a brief pause in an existing trend before it resumes in the same direction. They help traders identify optimal entry points during ongoing trends rather than trying to catch reversals. The six main types are pennants, flags, triangles, rectangles, cup and handle, and wedges—each appearing in both bullish and bearish variants.
How do you confirm a continuation pattern breakout?
Volume confirmation is essential. A valid breakout requires at least a 50% increase in volume above the pattern's consolidation average. Additionally, wait for a candle to close beyond the pattern boundary rather than entering on the initial touch. The breakout should occur in the direction of the prevailing trend, and ideally during high-liquidity trading sessions like the London/New York overlap in forex markets.
What's the difference between continuation and reversal patterns?
Continuation patterns signal that the current trend will persist after a brief pause, while reversal patterns indicate a trend is ending and changing direction. Continuation patterns typically form mid-trend during consolidation periods, whereas reversal patterns usually appear after extended moves when a trend is exhausting. Common reversal patterns include head and shoulders, double tops/bottoms, and wedges at trend extremes.
What volume increase confirms a breakout?
Research shows breakouts need at least a 50% volume increase above the consolidation period's average to be considered valid. Stronger breakouts often show volume increases of 100% or more. According to Bulkowski's research, breakouts with 50%+ volume above average succeeded in 65% of cases, while those with below-average volume succeeded only 39% of the time—a significant difference that underscores why volume confirmation is critical for pattern trading success.
Start trading continuation patterns today and place ideal entry or exit orders
Continuation patterns definitely help traders make a decision on whether they want to exit a trade or enter it. The patterns help confirm the trade’s future direction based on its existing direction. Start trading with our platform today to get hands-on trading experience with all the tools, techniques and strategies required to place successful trade orders.