


An advanced trading platform, MT4 has become a norm for seasoned Forex traders as it helps them execute their trades even when their machine is off. It comes with a user-friendly interface, numerous technical analysis tools for forecasting market patterns, real-time currency price data, and much more.
What is MetaTrader 4?
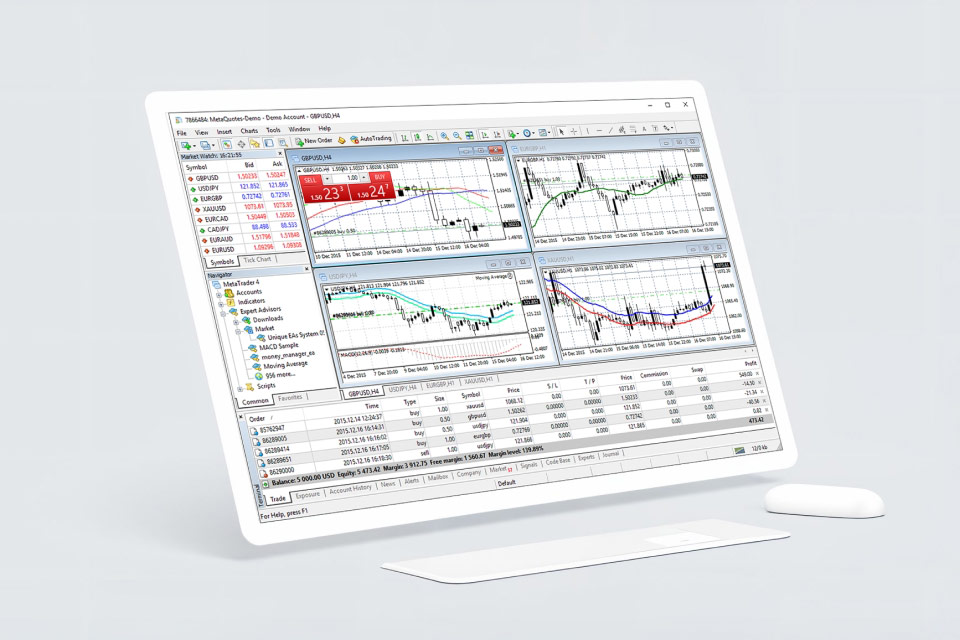
MetaTrader 4 is an advanced trading platform that can automate Forex and CFD trades. It can also closely analyse the markets. Developed by MetaQuotes in 2005, it is licensed to Forex brokers who can offer this platform to their clients for seamless trading.
Traders can use it to check live currency pair prices, charts, place orders, manage orders, and automate trades. The tool is free to download and gives traders access to a secure, fast and reliable trading environment.
Key features of MT4
Automated trading opportunity
Traders can automate their trade and leverage market movements without any manual intervention. In fact, traders can also use automated trading strategies with MT4 expert advisors. Expert Advisors or EA are strategic programs run on the MT4 platform, which help monitor and trade financial markets with systematic algorithms.
You can set your own EAs and technical indicators to suit your trading goals and objectives. You can then test and optimize your strategy through MT4’s Strategy Tester. The tester lets you know if the strategy you are doing will be useful in Forex trading or not.
Real-time market prices and liquidity access
MT4 allows you to access all Forex quotes in real-time and execute trades simultaneously. You can also view additional details about a currency pair, including its spread, margin, contract size, and the number of buy and sell orders.
If the bid is greater than the sell, the market trend is considered bullish. This enables the trader to increase their purchase of a particular currency pair due to the increased liquidity. This also helps them with short-term strategies like scalping.
Extensive price analysis tools
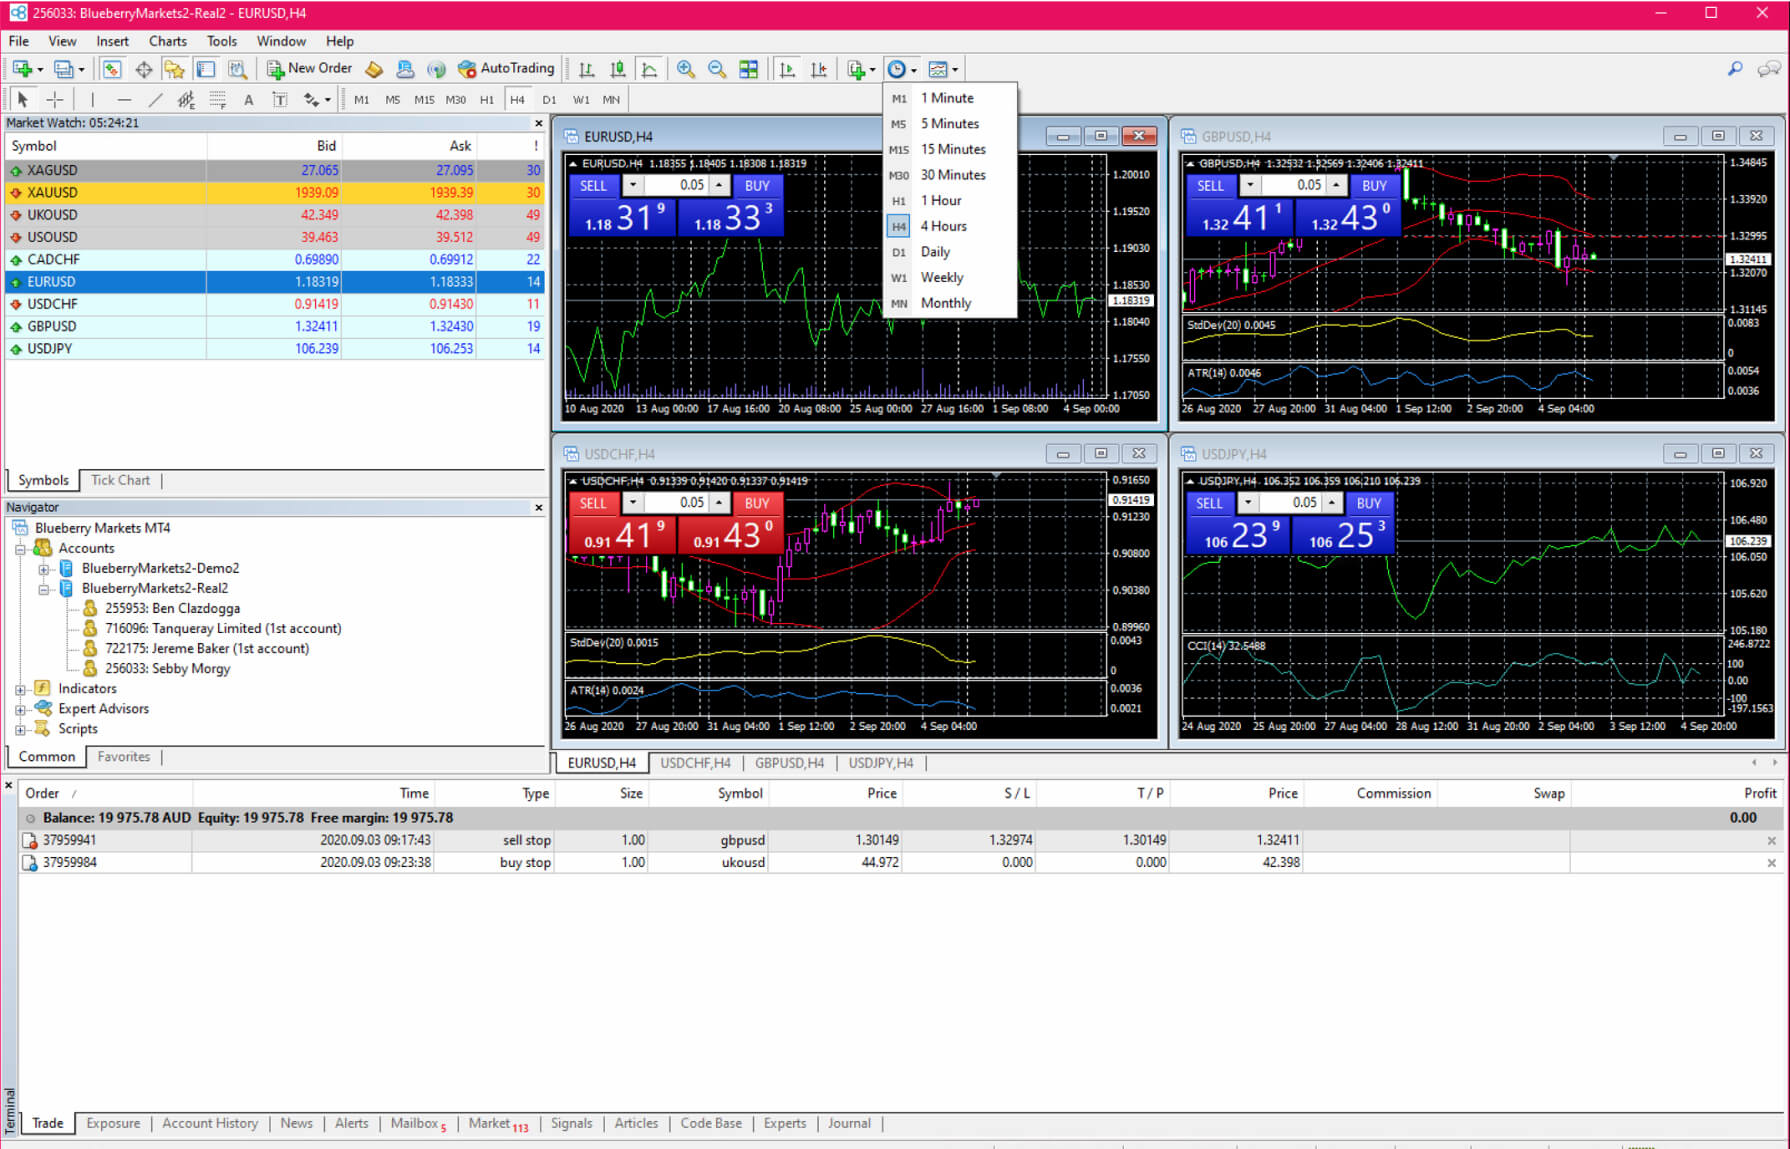
MT4 has several in-built charts and technical indicators along with extensive price analysis tools. There are over 30 indicators that include major volume and trend tools along with unlimited charts that can be viewed together. The platform displays currency pairs in nine different timeframes, ranging from minutes to monthly intervals.
It also allows traders to conduct an in-depth chart analysis with price analysis, mathematical tools, and drawing objects that help traders analyze all price-related activities. The charts are customized to suit each trader and their requirements. These charts help traders identify support and resistance levels, forecast price changes, define exit and entry points, and set the stop-loss levels in the Forex market.
High flexibility on multiple orders
With MT4, you can deal with two market orders, four pending orders, and three different trade execution modes together. Since everything on MT4 is automated, traders who do not wish to trade full time can opt for the same strategy.
Minimizes slippage
Slippage happens when an executed market order or stop-loss order is closed at a different rate than what was set initially. This happens mostly in markets of high volatility and can lead to losses. However, MT4 comes with a lightning-fast execution and robust stability that helps in minimizing the chances of this issue from happening.
Alert function
MT4 has an alert function that informs traders of significant price changes across financial markets. Any change in the national or global economy can result in dramatic changes in the market. This leads to volatile price movements that can result in losses. To protect you against these, MT4 sends an email and mobile alert notifications to update you on all price movements.
Automatic and algorithmic trading
With the EA’s function, there are several algorithms that you do on MT4. EAs come with a programming language that allows traders to create their own automated and algorithmic trading strategies.
How to setup MT4
On Mac
1. Account opening
Open a trading account with a broker that supports MT4 for Mac.
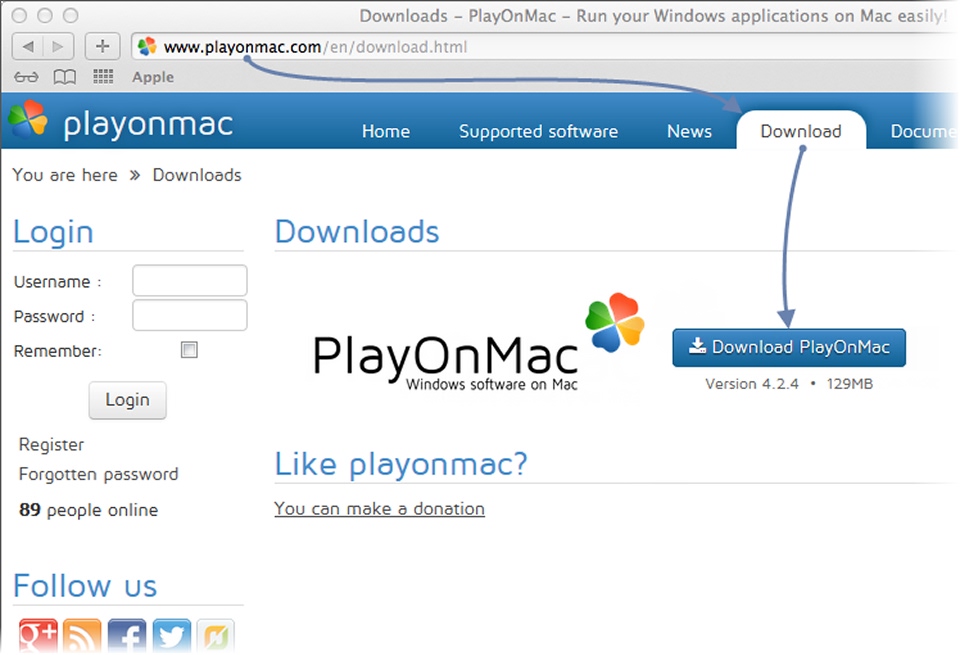
2. Download
Visit the broker's website and download the MT4 installation file for Mac OS.
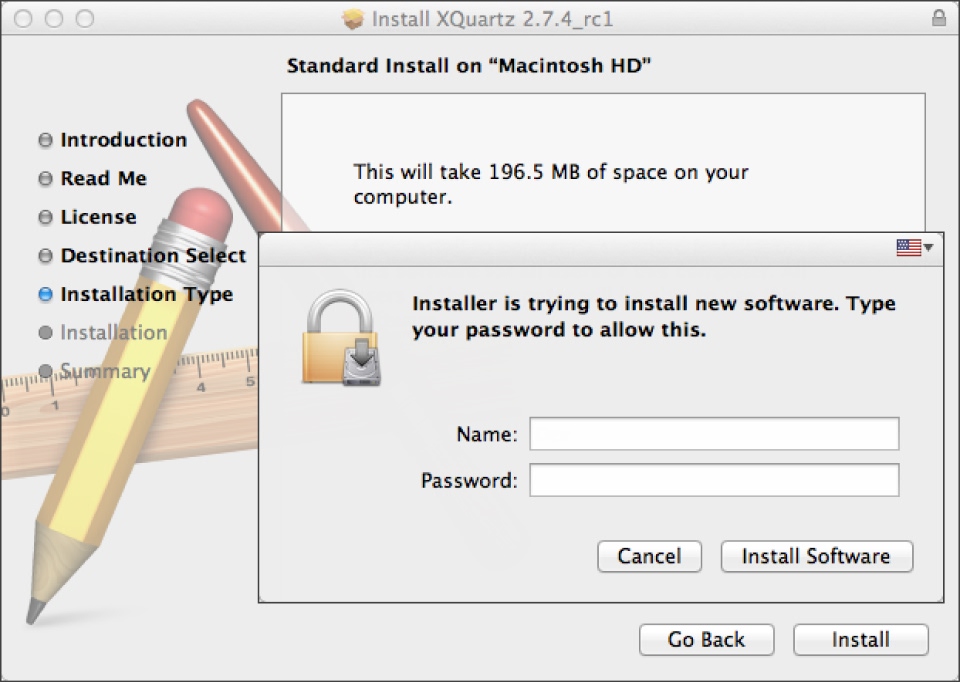
3. Installation
Follow the on-screen instructions to install MT4 on the Mac.
4. Login
Use the broker's login credentials to access the trading account within MT4.
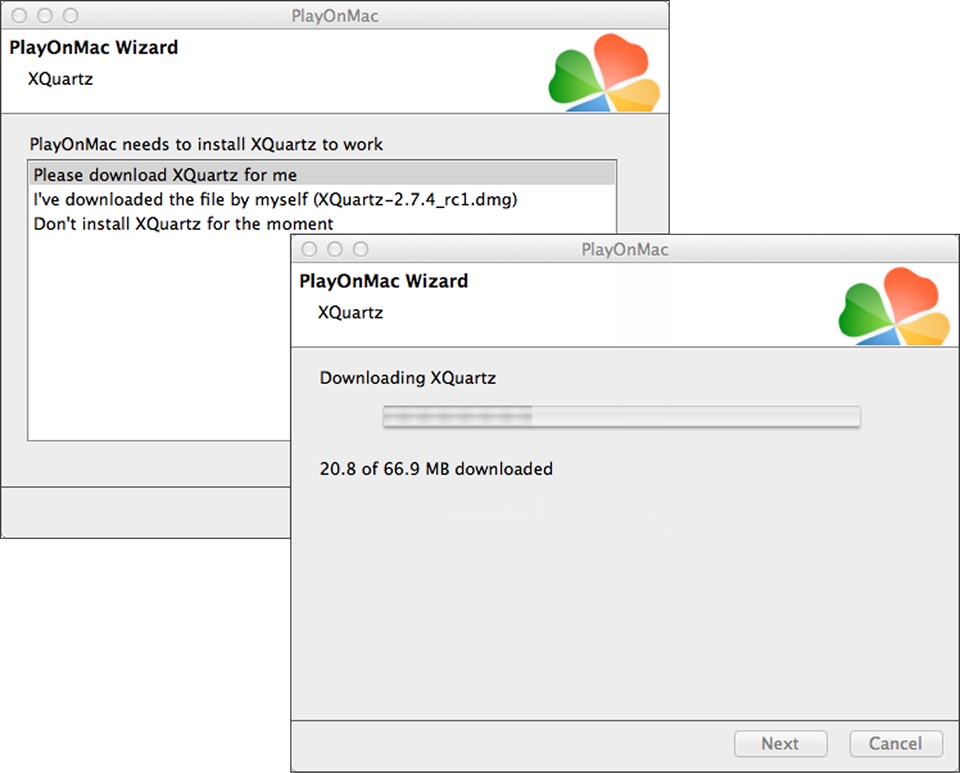
Note that some brokers may require traders to use third-party software like PlayOnMac or Wine to run the Windows version of MT4 on the Mac in the following way -
1. Download Wine
Visit the official Wine website and download the latest stable version of Wine for Mac OS.
2. Install Wine
Double-click on the downloaded Wine installer and follow the on-screen instructions to install it on the Mac.
3. Download MT4
Visit the broker's website and download the Windows version of the MT4 installer.
4. Run MT4 with Wine
Right-click on the downloaded MT4 installer, choose Open with Wine from the context menu, and follow the on-screen instructions to complete the installation.
On Windows
1. Download the MT4 Installer:
Visit the broker's website, locate the download link for MT4, and click on it. The installer will be downloaded to the computer.
2. Run the installer
Double-click on the downloaded MT4 installer file. The installation wizard will guide the trader through the process. Accept the terms and conditions and click Next to continue.
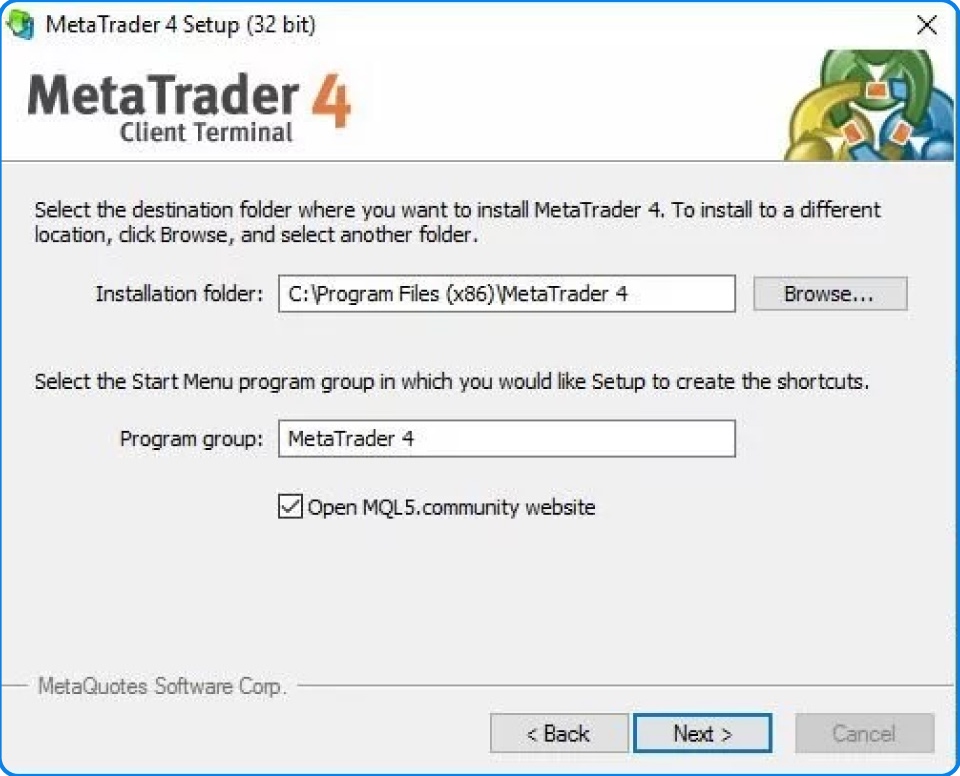
3. Choose installation options
The installer usually suggests default settings. Traders can accept these or customize them as needed. They can also choose where they want MT4 installed on their computer.
4. Wait for the installation to complete
The installation process will be visible through a progress bar. Once the installation is finished, a completion message will appear.
5. Launch MT4
If the trader created a desktop shortcut, double-click on it to launch MT4. Alternatively, they can find MT4 in the Start menu and launch it from there.
On mobile (Android and iOS)
1. Broker account
Open a trading account with a broker that supports MT4 for mobile.
2. App store
Download the MT4 app from the Google Play Store (Android) or App Store (iOS).
3. Login
Use the broker's login credentials to access the trading account within the MT4 app.
Logging into MT4
Demo account
A demo account is a way to practice trading without actual capital. Here's how to open and log in to a demo account in MT4 –
1. Open account window
There are a few ways to access the account opening window:
- File menu: Go to File and then click on Open an Account.
- Navigator window: Right-click in the Navigator window and select Open an Account.
2. Select server
Choose a server from the list provided. Servers with lower ping times are generally preferred.
3. New demo account
Select New demo account and click Next.
4. Personal details
Fill in the required information, such as name, email, phone number, and preferred account type.
5. Review and finish
Review the account details and click Finish to open the demo account.
6. Login
The trader will automatically be logged in to the new demo account.
Live account
Traders can open a live account with a broker, not directly through MT4. Contact the broker to open a live account and obtain login credentials. Once the trader has a live account, follow these steps to log in to MT4 –
1. Open the platform
Double-click the MT4 or MT5 icon on the desktop. Search for the platform in the Start menu and open it.
2. File menu
Click on the File option in the platform's top-left corner.
3. Login to trade account
Select Login to Trade Account from the dropdown menu.
4. Enter login credentials
- Login: Enter the trading account number
- Password: Enter the trading account password (not the Client Portal password)
- Server: Select the server that corresponds to the account type
5. Click Log in
After entering credentials, click the Login button to access the trading account.
Different functions of MT4
The File menu
- Open a new chart: Launch a chart for a specific financial instrument
- Open an account: Connect to an existing trading account
- Login to trade account: Access the live trading account (credentials provided by the broker)
- Open data folder: Manage custom indicators, Expert Advisors (EAs), and profiles
- Customize charts: Tailor the appearance and behavior of the charts
Charts and market watch
- Charts: Display real-time price movements of financial instruments. Traders can access all charts through the New Chart tab or the File menu
- Market watch window: Monitor quotes for various instruments. Use keyboard shortcuts (Ctrl+M) or the View menu to access it.
Market watch functions
- New order: Open, close, or place pending orders for instruments
- Chart window: Open a dedicated chart for the selected instrument
- Tick chart: View a chart with individual price ticks
- Hide/show symbols: Manage which instruments are displayed in the Market Watch
- Sets: Save, edit, or delete custom configurations for the Market Watch window
- High/low columns: Show or hide columns displaying the highest and lowest prices
- Time column: Display the arrival time of the latest quote for each instrument
- Gridlines: Toggle gridlines on or off in the Market Watch window
- Popup prices: View real-time quotes for selected instruments in a separate window
- Hide: Removes the specified symbol from the Market Watch window.
- Hide all: Hides all symbols from the Market Watch window that are not currently in use (symbols with open positions or charts will remain visible)
- Show all: Displays all available symbols in the Market Watch window
- Symbols: Opens a window where one can hide or show specific instruments
Navigator window (Ctrl+N)
- Technical indicators management: Manage and apply technical indicators and Expert Advisors (EAs)
- Add/change hotkeys: Assign keyboard shortcuts for quick access to favorite indicators
- Double-click indicators: Adjust indicator parameters like colors, levels, and visualizations
- Multiple accounts: View and manage multiple trading accounts if applicable
- Customizable toolbars: Right-click on toolbars to add or remove frequently used functions for easy access
- Data folder: Store and organize custom indicators, EAs, profiles, and templates
Ask price
To display the ask line (price), right-click on the chart, go to Properties > Common, and select Show Ask Line.
Crosshair
A crosshair measures the distance between two points on a chart. It also provides information about the date and time of any selected point. The information is displayed in the format – Number of periods/Number of points between two prices/prices.
Types of MetaTrader 4 indicators
Trend Indicators
Trend indicators are used to study and identify price trends of financial instruments in the market. Some examples include:
- Bollinger Bands
Bollinger bands predict market security movements based on market volatility. - Ichimoku Cloud
This indicator identifies momentum and trend direction and support and resistance levels through graphs that give an outline in four different time intervals. - Standard Deviation
This indicator measures data dispersion around a specific value which further helps in calculating the data accuracy. - Envelopes
Envelopes are formed when one of two Moving Averages shift upwards while the other moves downward. This indicator defines the upper and lower margins of the price range. - Average Directional Movement Index (ADX)
ADX measures the strength of any trend based on the average of a currency pair’s price range expansion over a certain period.
Oscillator indicators
The oscillator indicators show the fluctuations in the market with upper and lower bonds providing oversold and overbought signals. Some examples include:
- Force Index
This indicator measures the force of bulls during a rally and bears in a market’s downtrend. - DeMarker (DeM)
The DeMarker measures the demand for an underlying asset by comparing current and previous price changes. - Momentum
The momentum indicator defines the market strength by analysing how frequently the price changes as compared to the actual price. - Relative Vigor Index (RVI)
The RVI measures the strength of a trend using Simple Moving Average. - Relative Strength Index (RSI)
The RSI indicator calculates the momentum as a ratio between the highest closing prices and the lowest closing prices over a selected time. - Stochastic oscillator
A stochastic oscillator works by comparing certain closing prices of securities to a range of their prices over a specific period. - Williams’ Percent (W%R)
This is also a momentum indicator that indicates if an asset is oversold or overbought. It compares closing prices of the security over a specific time.
Volume indicators
Volume indicators define trading volumes and the quantity of security traded in a market over a specified period. A few examples of volume indicators are:
- Accumulation/Distribution (A/D)
(A/D) analyses intraday price movements and determines if the market is accumulating or distributing, which is also known as a moment of pause. - On Balance Volume (OBV)
This is an indicator that quantifies volume changes in the market to predict price movements. - Money Flow Index (MFI)
MFI is an oscillator that uses price and volume to generate overbought and oversold signals.
Bill Williams Indicators
Bill William indicators are preferred by people following the methods of American trader and author, Bill Williams.
- Williams Alligator
This indicator identifies sudden trends based on three Moving Averages that form the jaw, teeth, and lips of the alligator. - Gator Oscillator
This indicator is aimed to detect if a market is in trend or consolidating. This helps traders identify ideal entry and exit points. - Awesome Oscillator
This indicator is a type of oscillator comparing momentums of several periods together and reflecting the changes in the market by identifying trend strengths, formations, and reversals. - Accelerator Oscillator (AO)
AO measures the momentum of a market and confirms trends for possible reversals. - Market Facilitation Index (MFI)
MFI shows the strength of the varying prices of a particular security in a given period.
How do you trade on MT4?
1. Sign up with a Forex broker supporting MT4
Use MT4 by signing up with Blueberry. Once your account is set up, you can immediately open trades using MT4.
2. Download MT4
You can download MT4 for Windows, Mac, Android, or access it from the web. Log in with the credentials you used to sign up with Blueberry.
3. Open your first position
MT4 will show an order window where you can place your order. For one-click order placement, press F9 and fill the components like symbol, volume, take profit, stop loss, comment, and type. Your order is instantly executed based on the order type you choose.
4. Monitor current and pending orders
You can monitor all your open and pending positions in the terminal window. Press Ctrl + T or click on View in the toolbar. Then, select the Trade tab. Closing a position or deleting an order with MT4 comes easy with a single click.
5. Modify orders
You can also modify your orders on open and pending positions. Open the terminal window and visit the Trade tab again, right-click the position or pending order you want to change, and click on Modify or Delete the order.
6. Customize charts
You can draw on the charts, add indicators, and even edit indicators when required. MT4 also allows you to change the time frame of a particular price chart with one click.
7. Set up price alerts
You can set up price alerts by opening the terminal window and going to the Alerts tab. Right-click on the window and click Create. This will give you an alert editor where you can completely customize price alerts for currency pairs.
8. View trade history and download trade reports
Viewing trade history on MT4 is easy as all you have to do is click on the Terminal window and go to the Account History tab. After you have gone through your trade history, you can also download trade reports for specific periods. The reports give details on individual trades and an account summary with metrics like drawdowns and profit factors.
Automate trades seamlessly with MT4
Blueberry gives you access to MT4 if you sign up for a live or demo account with us. We allow our traders to customize everything from charts and strategies to indicators with a single click.