

Forex charts are used by traders who want to analyse the market to determine the best possible entry and exit positions and currencies ideal for trading and investments.
Historical and current price movements reveal existing trends and help predict future trends. Forex charts carefully illustrate how market data changes over time, giving you enough information so that you can plan your trading strategy better.
What is a Forex chart?
A Forex chart is a visual representation of a currency pair’s price movement over a period, which ranges from 1-minute to 1-year price charts. Price changes occur due to several reasons like a major economic announcement or financial investment.
The graphical representation provides the pair’s price history, current price behaviour, and predicted price movement. Hence, traders need to manage their risk and assess probabilities of when the chart will see an uptrend.
Once you know how to read Forex charts, it becomes easier to assess risks associated with an asset and analyse a currency pair’s past, current, and approximate future price.
Let's take a look at the different types of Forex charts and how to effectively read them:
Line chart
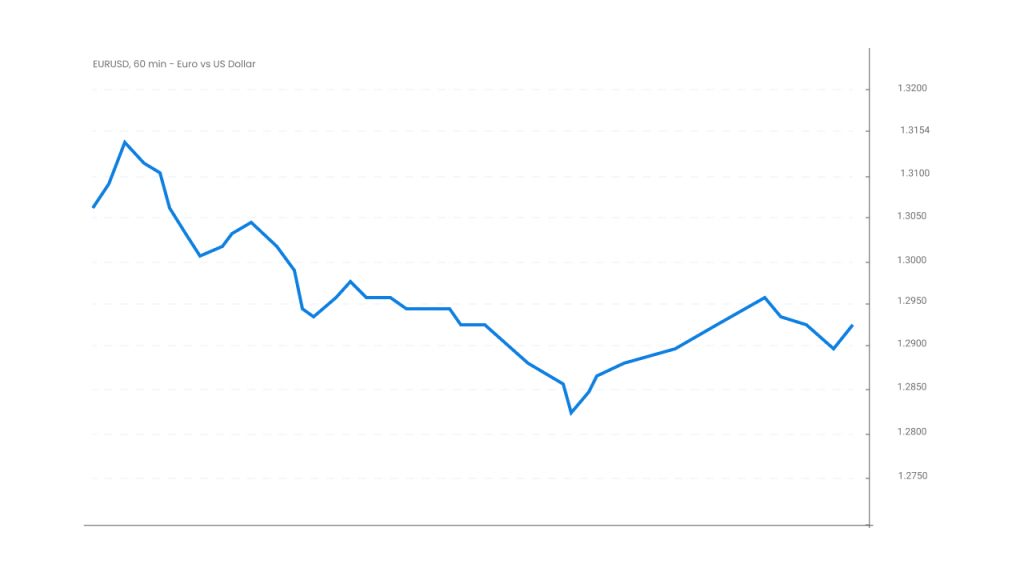
A line chart draws a line from one closing price to another. Between these two points are the price movements of the currency pair over a defined time period.
A line chart shows a bigger picture of the overall market movement, depicting whether the market is in an uptrend or a downtrend. This can help you identify the ideal trends in the market, which are represented by the line’s slope.
In most cases, the closing price is considered more important than the opening price because it makes it easier to compare different closing prices on different days to accurately measure market sentiment changes for the particular currency.
The bottom-most point of the vertical bar represents the lowest low of a currency during the defined period, while the top-most point shows the highest high. The bar itself indicates the pair’s trading range as a whole, and the horizontal hash visible on the right-hand side shows the opening prices of the currency pair.
The line chart above depicts that the pair opened at a higher price and closed at a lower one.
Bar chart
A bar chart is more complex than a line chart. It represents the closing price, opening price, high price, and low price of a currency pair. This makes it easier for you to see the entire price range of the pair for the defined time period in one go.
Every bar differs in size according to the currency pair’s prices for that period. Each vertical bar’s bottom indicates the lowest low and the top of the bar shows the highest high. The vertical height of the bar represents the range between the pair's highest traded price and lowest traded price in that period.
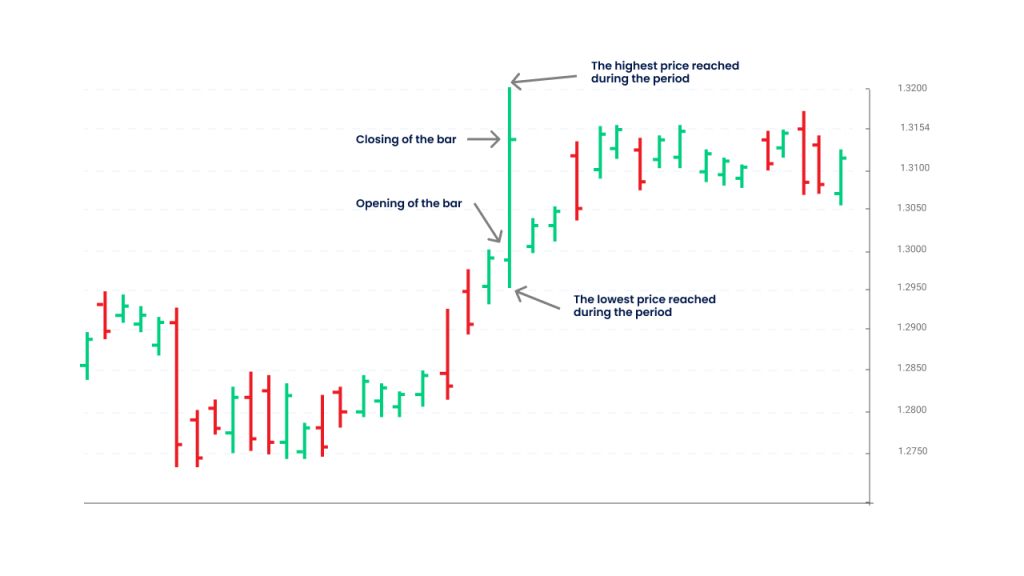
Whenever price fluctuations are larger, bars become longer. When there are fewer fluctuations, the bars become smaller. The price is more volatile if the difference in prices is larger.
Japanese Candlesticks charts
Japanese Candlestick charts describe price movements of currencies with each candlestick over a time period.
Candlestick charts indicate the high-to-low price range of the currency pair with a vertical line. They are used to determine the potential price movements based on previous price patterns.
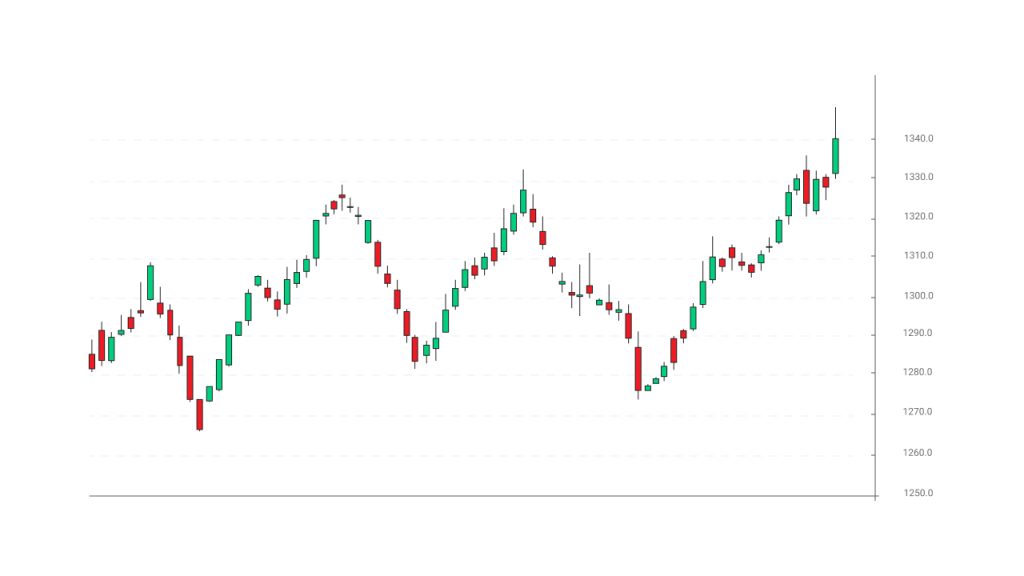
Each candlestick represents the opening and closing price range of the currency pair. The colours in the block help in visualising bullish and bearish market conditions. The most commonly used colours are green and red. A full green bar means that the closing price is bigger than its opening price, signalling a bullish price action. Meanwhile, a full red bar indicates that the closing price is lower than its opening price, signifying that the price action was bearish.
Other times, traders fill and unfill blocks instead of using a colour scheme. If the block is filled in, it means that the currency pair closed at a lower price as compared to its opening price. However, if the closing price surpasses the opening price, then the block is either left uncoloured or empty.
Trade smarter with Forex charts
Forex charts are important to help you analyse currency price movements and the overall market sentiment before you open a trade position. The different types of Forex charts share different types of insights and purposes. While some charts are more in-depth and elaborate like the Japanese candlestick chart, others are quicker to analyse prevailing currency pair situations like the line chart.
Through Forex charts, you can easily gather past and present information about your preferred markets. At Blueberry Markets, our industry-leading platforms feature powerful charting tools available in up to 21 timeframes that make Forex trading more convenient for you.
Create a live account and start trading with us today!
Disclaimer: All material published on our website is intended for informational purposes only and should not be considered personal advice or recommendation. As margin FX/CFDs are highly leveraged products, your gains and losses are magnified, and you could lose substantially more than your initial deposit. Investing in margin FX/CFDs does not give you any entitlements or rights to the underlying assets (e.g. the right to receive dividend payments). CFDs carry a high risk of investment loss.