Market reversals are important to track as they can help traders get in or out of a forex position before you end up bearing any losses. Spotting market reversals on time makes it easier for forex traders to decide whether the markets are still favourable or not.
In our article, we will dive deeper into learning more about market reversals and how to spot them.
What are market reversals?
A market reversal is a change in the direction of a currency pair’s current price. Reversals can occur in both rising and falling markets. It is a change in the overall price direction of the currency pair and suggests that the markets will continue in the opposite or reversed direction for a long time period now.
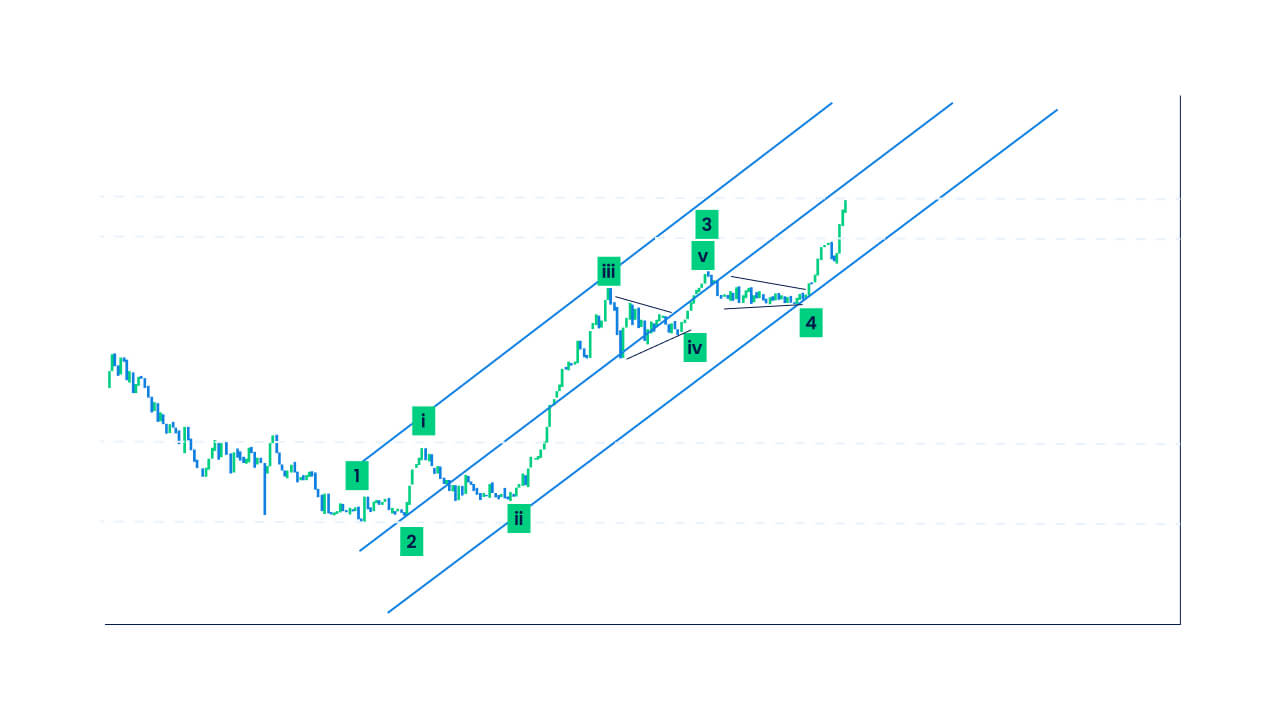
Reversals are of two types:
- An uptrend reversal occurs during a downtrend, when the falling prices stop falling and start rising, following an uptrend.
- A downtrend reversal occurs during an uptrend when rising prices stop rising and start falling, following a downtrend.
Different situations where the market can reverse
Overextended markets
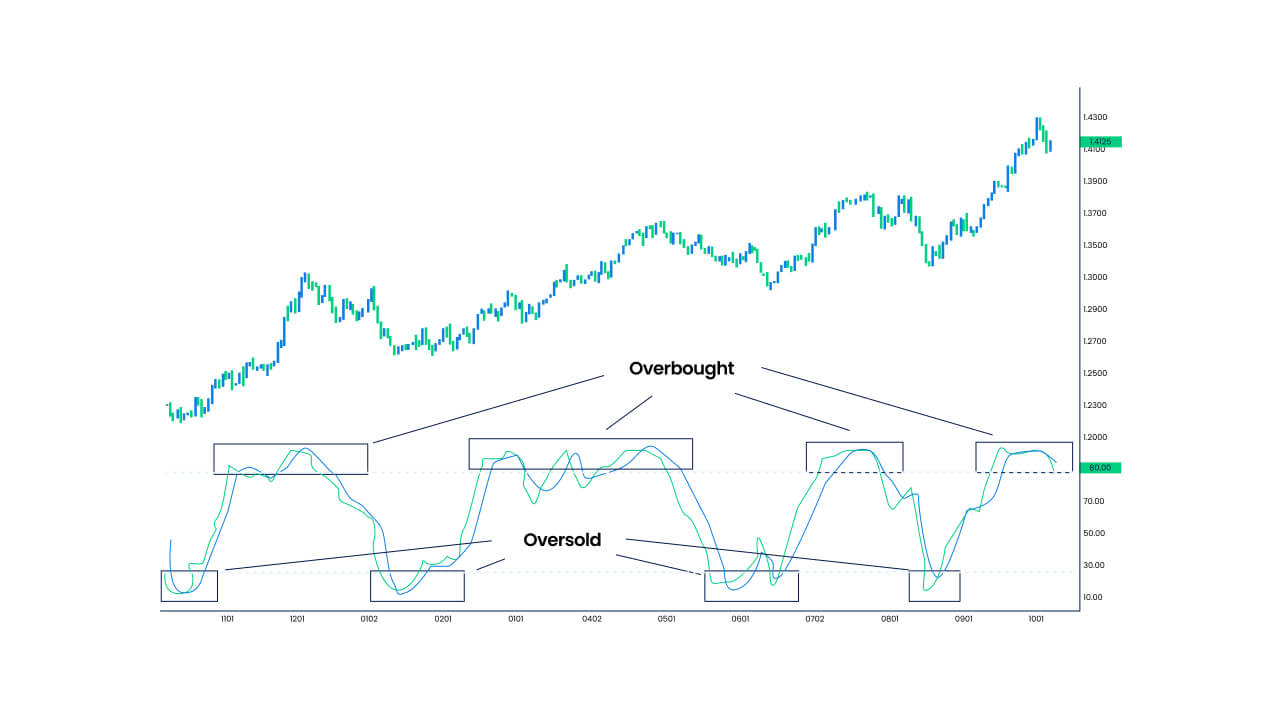
An overextended market is also called an overbought or oversold market. It refers to a situation when the markets are either trading far above or below their fair value (the value derived by the equilibrium between the currency pair’s demand and supply in the market). Such markets correct themselves to come back to their actual and initial level in the near future.
- An overbought market situation is when the currency pair price trades much above its fair value. The overbought market corrects itself by reversing in a downward direction and provides traders with signals to short or sell the trade.
- An oversold market situation is when the currency pair price trades much below its fair value. The oversold market corrects itself by reversing in an upward direction and provides traders with signals to long or buy the trade.
Parabolic moves
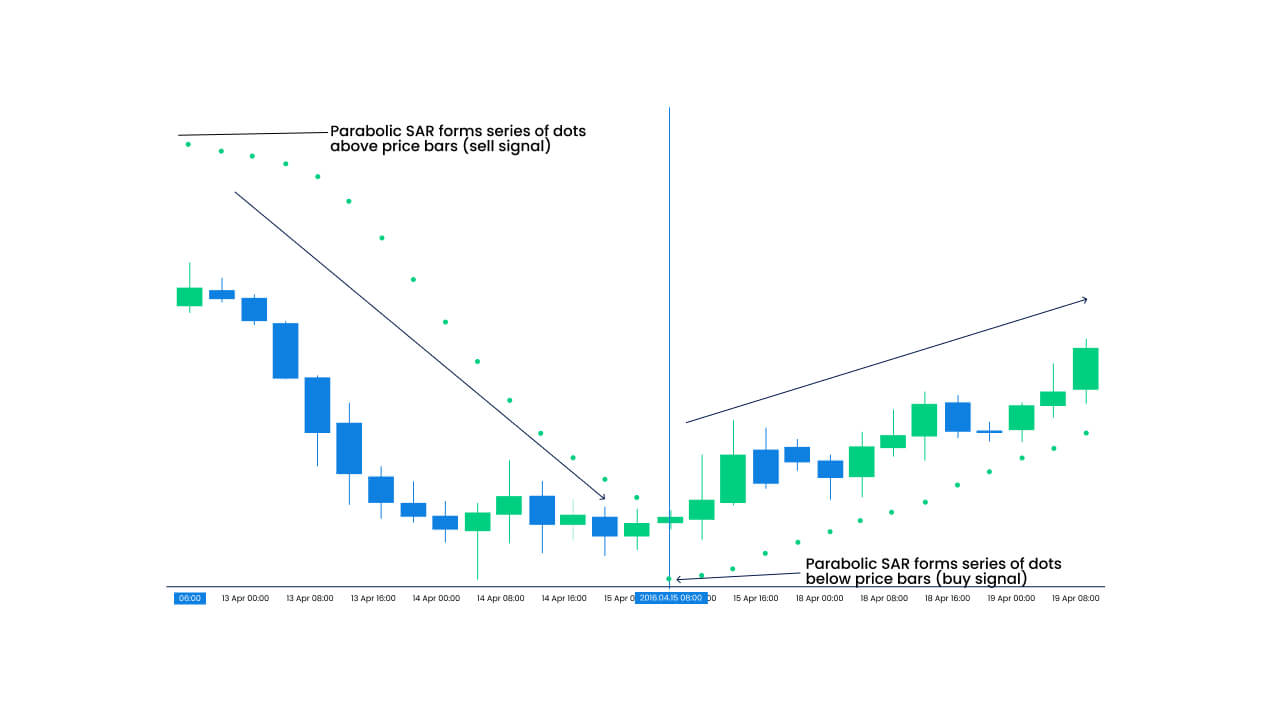
Parabolic moves in the forex market occur when currency pairs have been in an uptrend or downtrend for an extended period of time, like a few years.
During a long-term uptrend, the market rises even further for a temporary period, signalling that the uptrend might end soon. This happens because investors start exiting the market to take profits from high price moves, and this leads to a market reversal in the near future due to the decrease in the currency pair’s demand.
During a long-term downtrend, the market falls further for a temporary period, signalling that the downtrend might end soon. This happens because investors start entering the market to benefit from short selling, and this leads to a market reversal in the near future due to the increase in the currency pair’s demand.
Hence, markets that trend in a particular direction over a long period of time reverse and become parabolic (U or inverted U shape).
How to spot market reversals?
1. Identify if the current trend is weak
The strength of the market trend defines the probability of a market reversal. A strong uptrend means that there are more bullish candles in the market, and a strong downtrend means that there are more bearish candles in the market, which will continue in the same direction for some time and decrease the reversal probability. However, when the trend’s strength is weak, the bullish candles in an uptrend and bearish candles in a downtrend become smaller, signalling a strong market reversal.
- Bullish candles becoming smaller signal that the uptrend is becoming weak and buying pressure is falling, indicating a downtrend reversal.
- Bearish candles becoming smaller signal that the downtrend is becoming weak and selling pressure is falling, indicating an uptrend reversal.
2. Identify the strength of the reversal move
After a market reverses from an uptrend to a downtrend or from a downtrend to an uptrend, it is essential to identify the reversed market trend’s strength to confirm the reversal signal. The reversal trend moves against the initial trend, and so, if the bearish candles start becoming significantly larger after an uptrend, it confirms a downtrend reversal. On the other hand, if the bullish candles start becoming significantly larger after a downtrend, it confirms an uptrend reversal.
3. Spot the support or resistance level
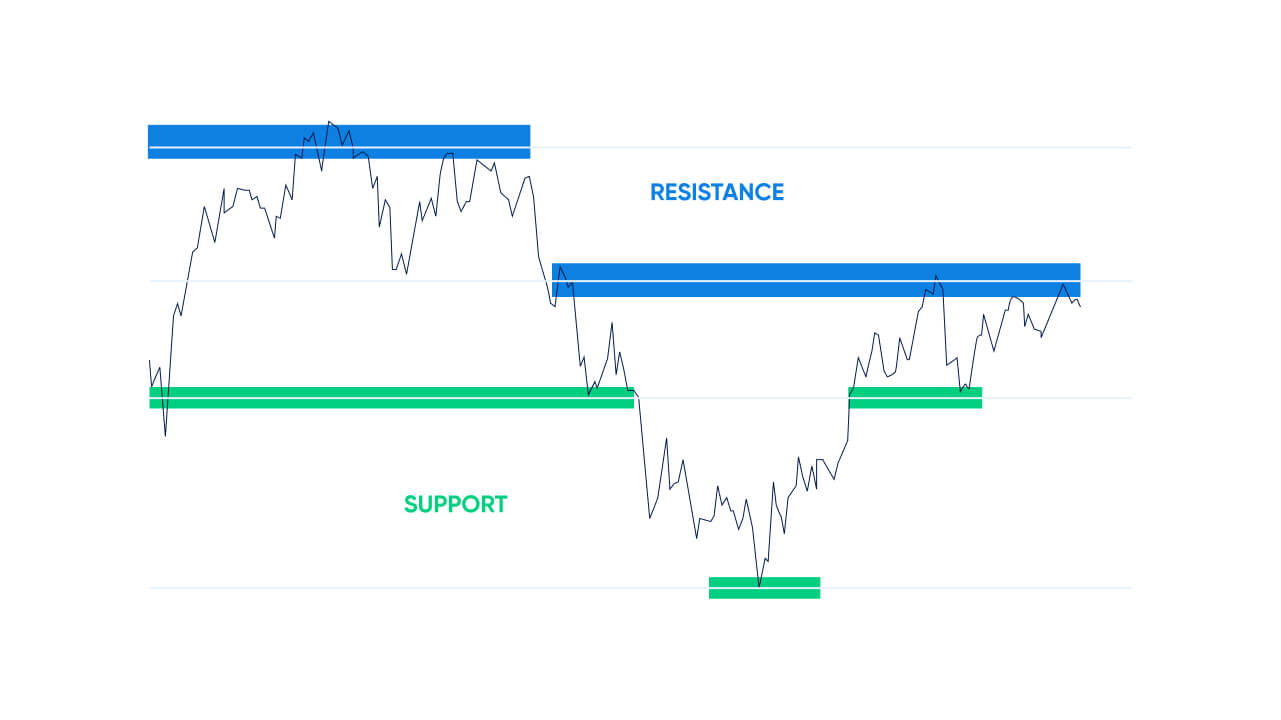
The support level is the price at which the falling prices stop falling and start increasing, whereas the resistance level is the price at which the rising prices stop rising and start falling.
Once you are able to spot the support level in a downtrend, as soon as the currency pair prices touch this level, it signals that the markets are now going to reverse upwards as prices cannot fall beyond the support price. This indicates an uptrend reversal and provides you with opportunities to long or buy the trade.
When you spot a resistance level in an uptrend, as soon as the currency pair prices touch this level, it signals that the markets are now going to reverse downward as prices cannot rise beyond the resistance price. This indicates a downtrend reversal and provides you with opportunities to short or sell the trade.
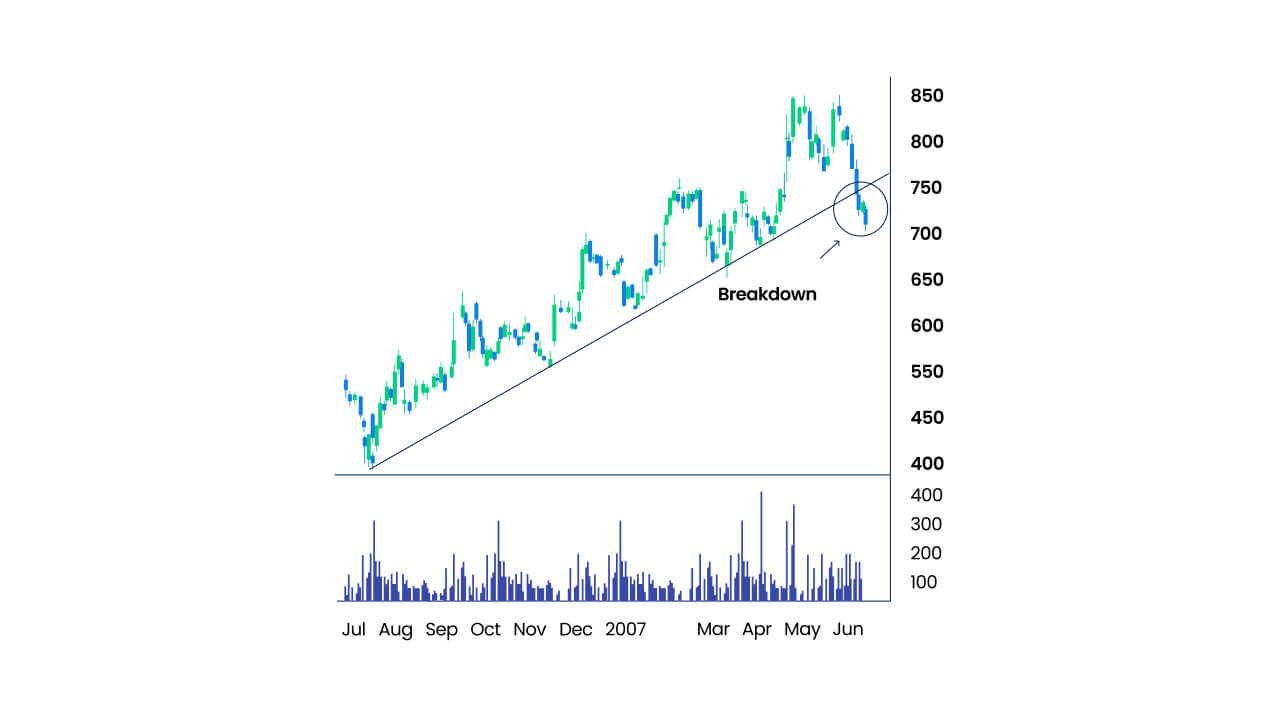
4. Spot any broken long term-trendline
When a long-term trend line breaks, it indicates that the current market pressure is falling and a reversal is about to occur.
- When a long-term upwards trendline breaks, it forms larger bearish candles and signals a downtrend reversal.
- When a long-term downwards trendline breaks, it forms larger bullish candles and signals an uptrend reversal.
Spot reversals and trade in the opposite trending market direction
Market reversals help identify market conditions that are going to change, allowing you to place long or short orders accordingly.
Start trading forex on Blueberry. to experience seamless trading and order executions.
Disclaimer: All material published on our website is intended for informational purposes only and should not be considered personal advice or recommendation. As margin FX/CFDs are highly leveraged products, your gains and losses are magnified, and you could lose substantially more than your initial deposit. Investing in margin FX/CFDs does not give you any entitlements or rights to the underlying assets (e.g. the right to receive dividend payments). CFDs carry a high risk of investment loss.


