


📈 Keeping tabs on USDCHF! With the Swiss National Bank cutting rates and robust US jobs data stirring inflation concerns, the dynamics of this pair are heating up. Stay informed, stay agile! 💼💰 #Forex #Trading #USDCHF #MarketInsights
Watch the video to learn more...
One currency pair that has recently captured the attention of traders is USDCHF, thanks to a convergence of factors impacting both the US dollar and the Swiss franc.
The Swiss National Bank (SNB) recently made headlines by cutting interest rates, signaling its intention to weaken the Swiss franc (CHF). This move was aimed at addressing the challenges posed by a strong currency, which can hinder economic growth and exports. For traders, this signals a potential shift in the dynamics of the USDCHF pair, as a weaker CHF could lead to upward pressure on the exchange rate.
On the other side of the equation, the United States has been experiencing robust job growth, as evidenced by the latest employment data. With the US adding a staggering 303,000 jobs, far surpassing expectations, the specter of inflation has been raised. Strong job numbers often translate to increased consumer spending, which can fuel inflationary pressures. In response, the Federal Reserve may feel compelled to not cut rates as anticipated, in order to keep inflation in check.
For traders eyeing the USDCHF pair, these developments present both opportunities and risks. The SNB's efforts to weaken the CHF could bolster the dollar's strength against the franc, potentially driving the pair higher. However, concerns about inflation and the Fed's response could introduce volatility into the equation, leading to unpredictable price movements.
USDCHF
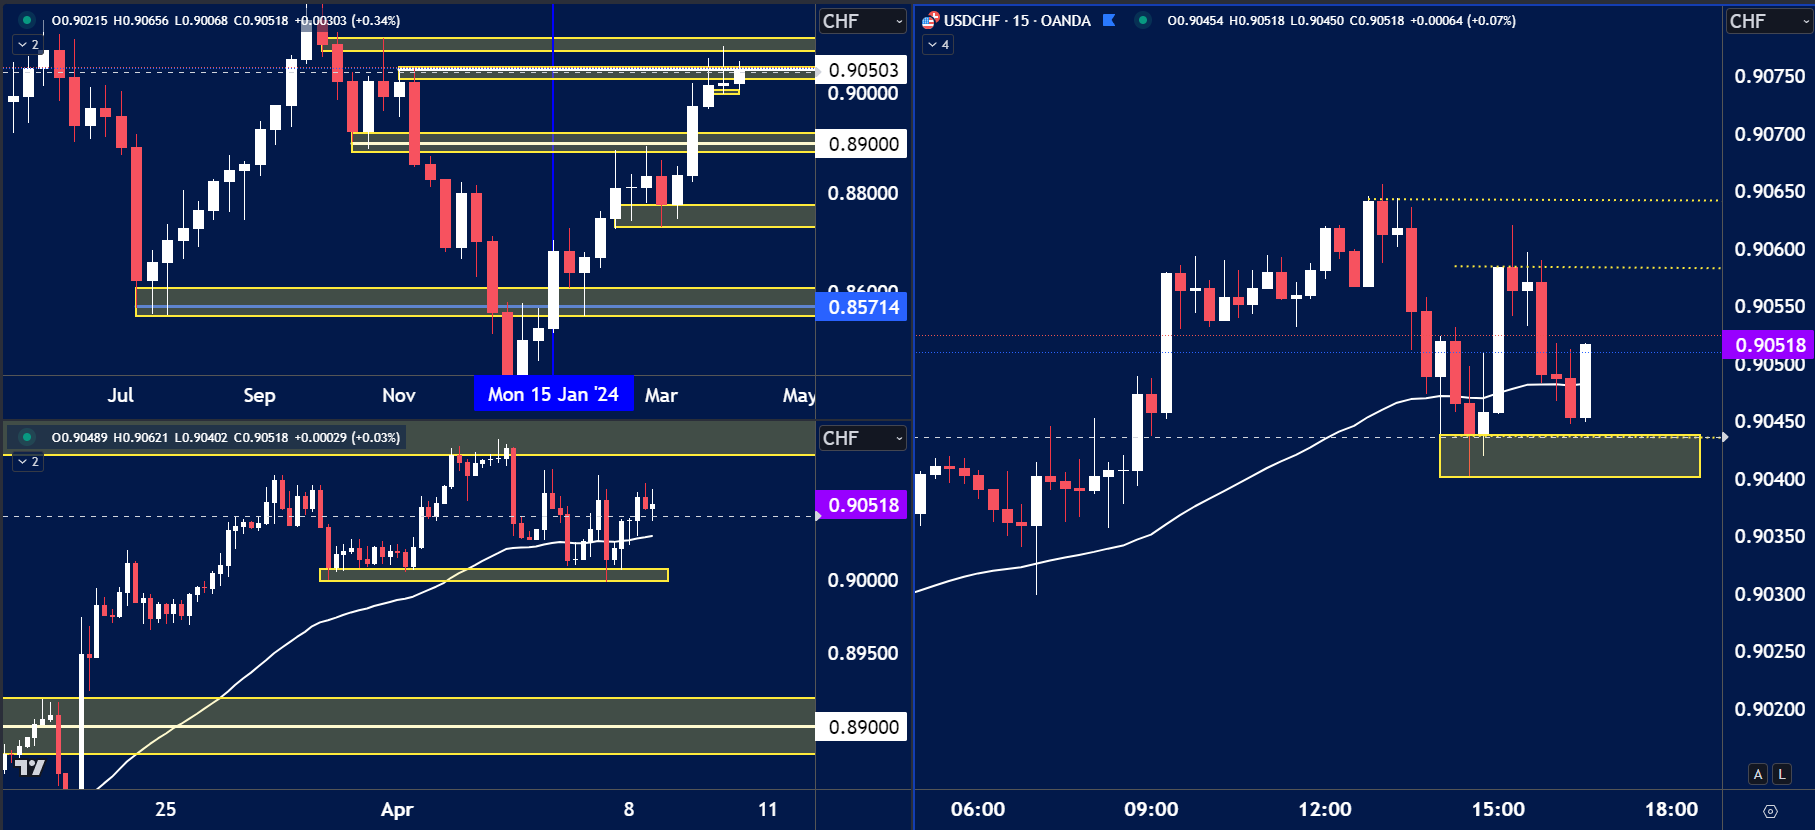
The price on the chart has traded through multiple technical levels and some observations included:
- USDCHF weekly time frame shows price is bullish, however we are seeing price test higher time frame support at 0.9050.
- The H4 chart is trading above the 50 EMA which could signal bullish momentum, a break below 0.9000 would be the point where we need to rethink strategy.
Have you watched our latest video update? You can see it here.
Enjoy low spreads and quick trade executions with a live account. Our highly committed customer support team will assist you with your quick account setup for any future concerns
Disclaimer: All material published on our website is intended for informational purposes only and should not be considered personal advice or recommendation. As margin FX/CFDs are highly leveraged products, your gains and losses are magnified, and you could lose substantially more than your initial deposit. Investing in margin FX/CFDs does not give you any entitlements or rights to the underlying assets (e.g. the right to receive dividend payments). CFDs carry a high risk of investment loss.