


The head and shoulders pattern is one of the most important Forex chart patterns that every trader should know. This is also known as a reversal pattern seen in uptrends.
A reversal pattern is one of the main groups of chart patterns where we predict that the current trend will change. If it forms on an uptrend where the currency is appreciating, a reversal pattern is a hint that the price will depreciate soon.
The pattern
The head and shoulders is a relatively simple chart pattern to spot, and since it's a trend reversal formation that hints at the change of trajectory on the chart, it's important to keep an eye out for it.
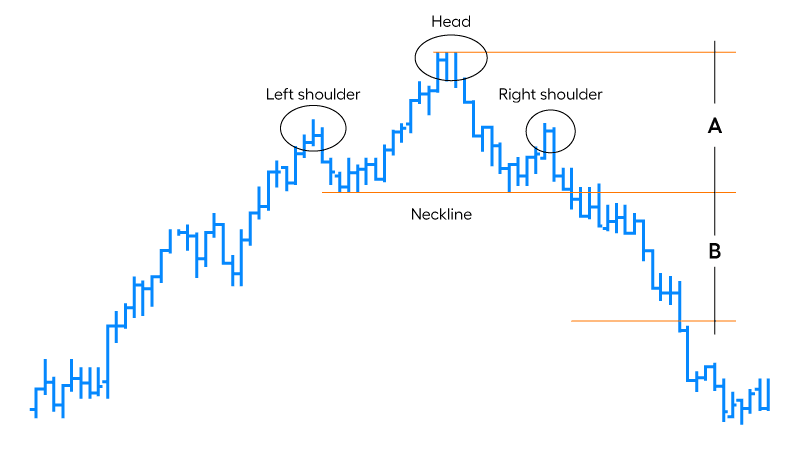
The pattern consists of three main peaks: one head and two shoulders. From left to right, a shoulder appears as a peak and goes into a trough or a valley. It goes on an uptrend again to form the highest peak in the pattern, the head. This half is mirrored after encountering the head to form another trough followed by a peak known as the other shoulder. By connecting the lowest points of the two troughs on either side of the head and between each shoulder and the head, you form an important line called the neckline. The signals tend to be more reliable when the neckline is sloping downwards instead of upwards.
Making the calls
The way to calculate where the price moves and how far it will move after breaking the neckline is by measuring the highest peak of the head and the neckline. This distance is how far down the trendline is expected to plummet after it moves beyond the neckline. Typically, an entry order is opened below the neckline to be able to profit later on.
Since we expect the price to go even further down the neckline, you should move far enough to cover the size of the distance you've measured between the neckline and the top of the head. Since Forex trading involves predictions, it's never going to be perfectly static, and it is possible that the chart keeps moving even after it reaches the target. Still, it is essential to be happy with the profit you make and know the risks before you decide to make a move to cut your losses.
Reading inversions
We can also encounter the head and shoulders pattern as an inversion. This means that it's upside-down, with the head and shoulders forming troughs instead of peaks. The head is the lowest among the three troughs and is still placed in between the shoulders. For the inversion, the neckline is drawn from the peaks between the head and either shoulder. Hence, the neckline is found on the upper part of the chart.
Unlike the head and shoulders, the inverse of it is seen on a downtrend instead of an uptrend. This formation is often observed following an extended downward trend. Since the inverse of the head and shoulders pattern occurs on a downtrend, this means that you expect the price to appreciate after you see the pattern.
Making the calls for inversions
Although they're opposites of one another, making calls for the inversion is similar to making calls for the head and shoulder pattern. The way to calculate the target is identical between the two except for the inverse – you measure downwards, instead of upwards, from the top of the head to the neckline.
After the projections have been made, you can place a long entry above the neckline because you need to cover the distance the price is expected to move once it breaks the neckline—which is the distance you've measured between the head and the neckline. Once the chart moves and your target is hit, you can enjoy the profits you've made.
Advanced techniques
There are more advanced techniques to eliminate most of the risks involved in going into an open position based on the presence of either a head and shoulders pattern or the inverse of it. This involves looking at the slope and how even the shoulders are or other indicators that may confirm a trend reversal. There's a wealth of information, both online and offline, as to the safeguards of making sure that the readings are reliable enough to make a reasonable projection.
The head and shoulders pattern and its inverse are two of the most basic Forex chart patterns that every trader will benefit from knowing how to spot — anticipating inversions or changes in the current trend by telltale signs such as this inversion pattern is important to assure profit and chase after the best value possible.
Disclaimer: All material published on our website is intended for informational purposes only and should not be considered personal advice or recommendation. As margin FX/CFDs are highly leveraged products, your gains and losses are magnified, and you could lose substantially more than your initial deposit. Investing in margin FX/CFDs does not give you any entitlements or rights to the underlying assets (e.g. the right to receive dividend payments). CFDs carry a high risk of investment loss.