


Reading crypto charts involves analyzing price movements, patterns, and indicators to understand market trends. Traders interpret chart data to identify entry and exit points, support and resistance levels, and potential price reversals.
Understanding crypto charts is essential for traders to assess market sentiment, predict future price movements, and manage risk effectively. By reading charts, traders can capitalize on trading opportunities, adapt to market dynamics, and improve their overall gains in the volatile cryptocurrency market.
In this article, we will discuss everything around crypto charts and how to read them.
What are crypto charts?
Top charts for crypto trading
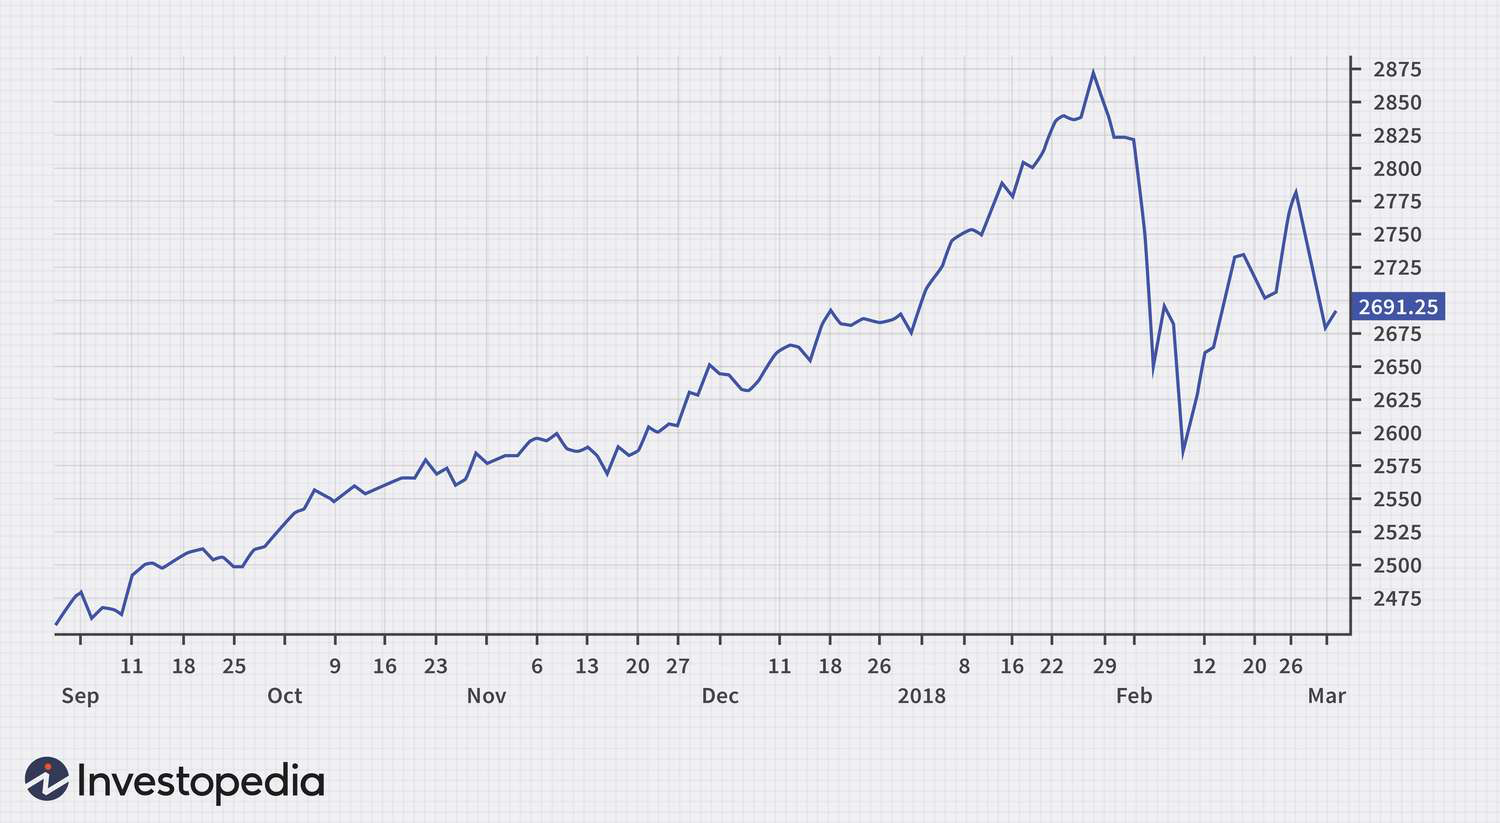
Line charts
Line charts visually represent a cryptocurrency’s price movements over time. They help traders identify long-term trends and key price levels. Line charts are useful for assessing overall market direction and making high-level trading decisions based on trend analysis.
Heikin-Ashi charts
Heikin-Ashi charts filter out the noise and emphasize trends by using modified candlestick calculations. They smooth out price fluctuations, making it easier for traders to identify trend reversals and potential entry or exit points. Heikin-ashi charts are helpful for trend-following strategies in crypto trading.
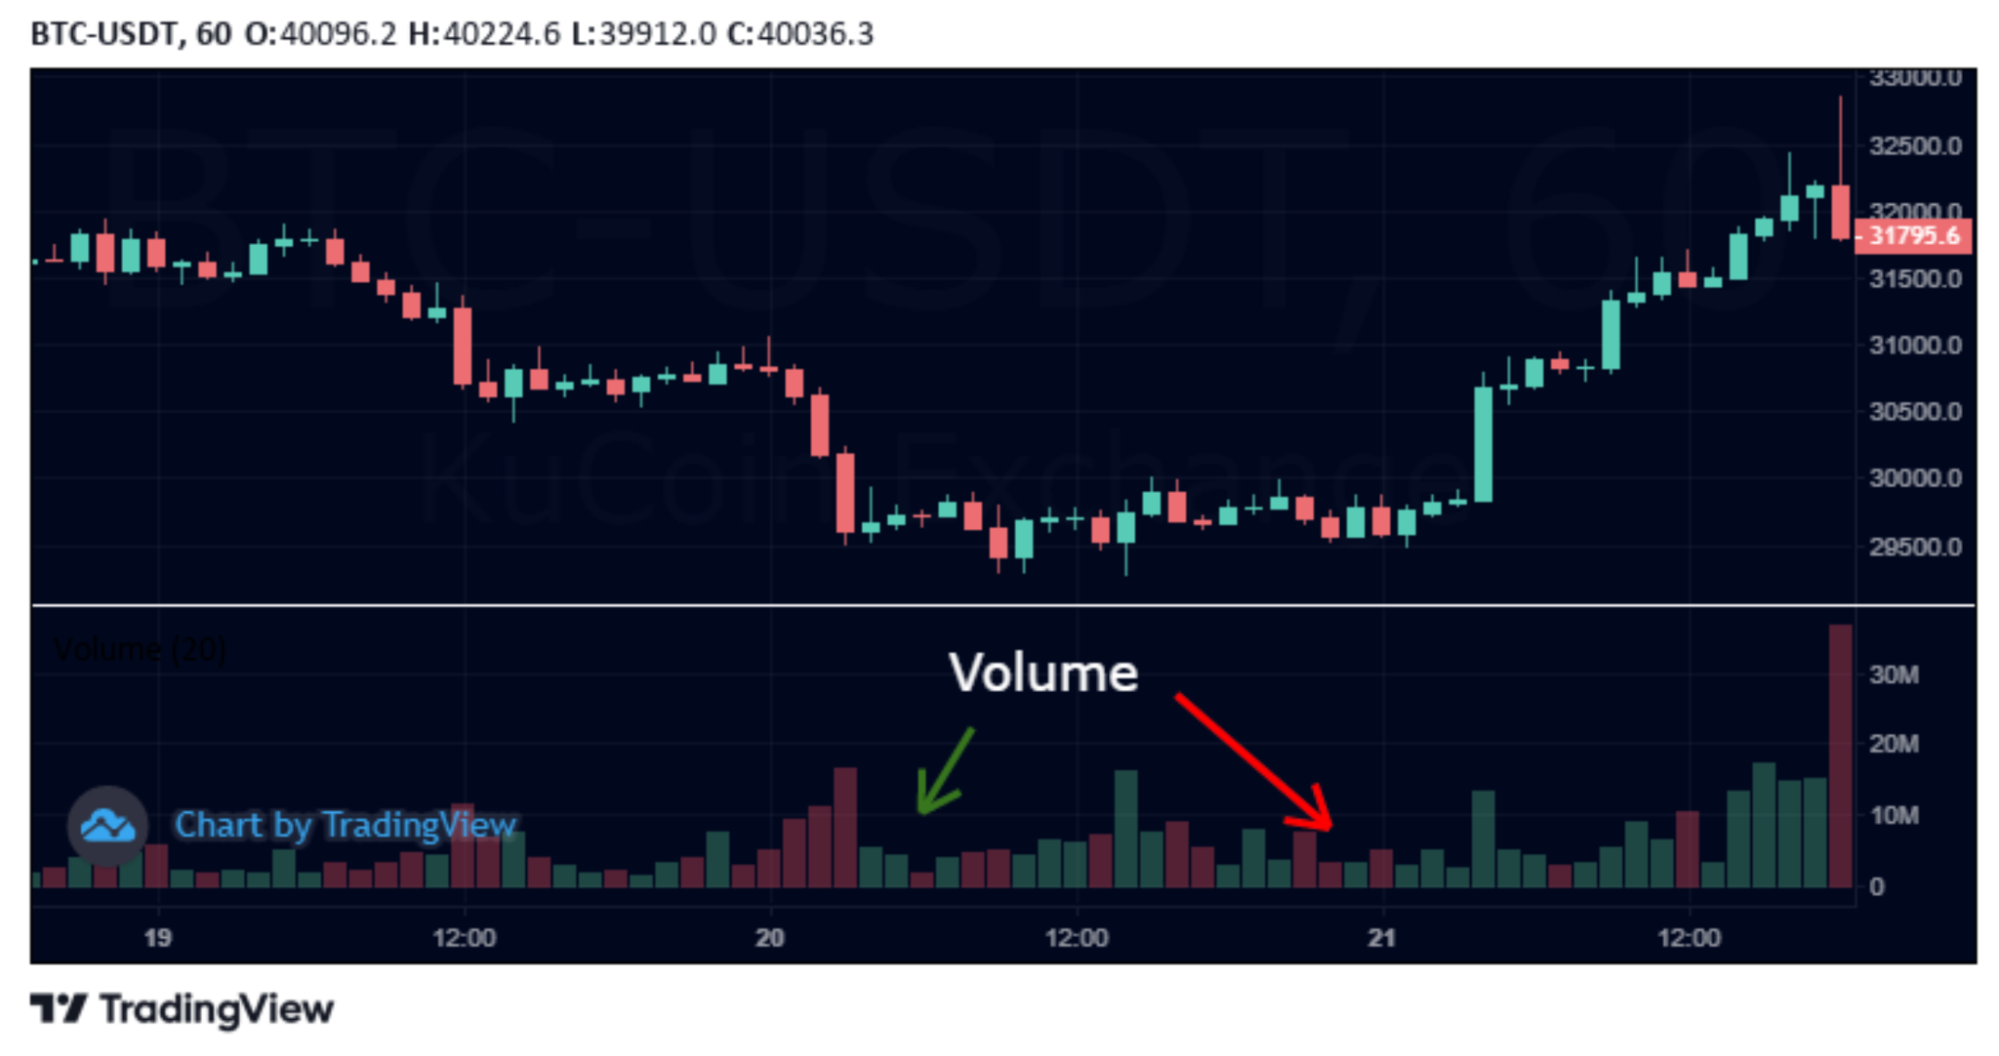
Volume charts
Volume charts display a cryptocurrency’s total trading volume over a specific time period. They help traders assess the strength of price movements and confirm the validity of trends. High volume during price increases or decreases suggests strong market participation, while low volume may signal weak interest or potential reversals.
Renko charts
Renko charts represent price movements using bricks only drawn when the price moves beyond a predefined amount. They filter out noise and focus on significant price movements, helping traders identify trends and potential reversal points more clearly. Renko charts are helpful for trend-following strategies and reducing market noise in crypto trading.
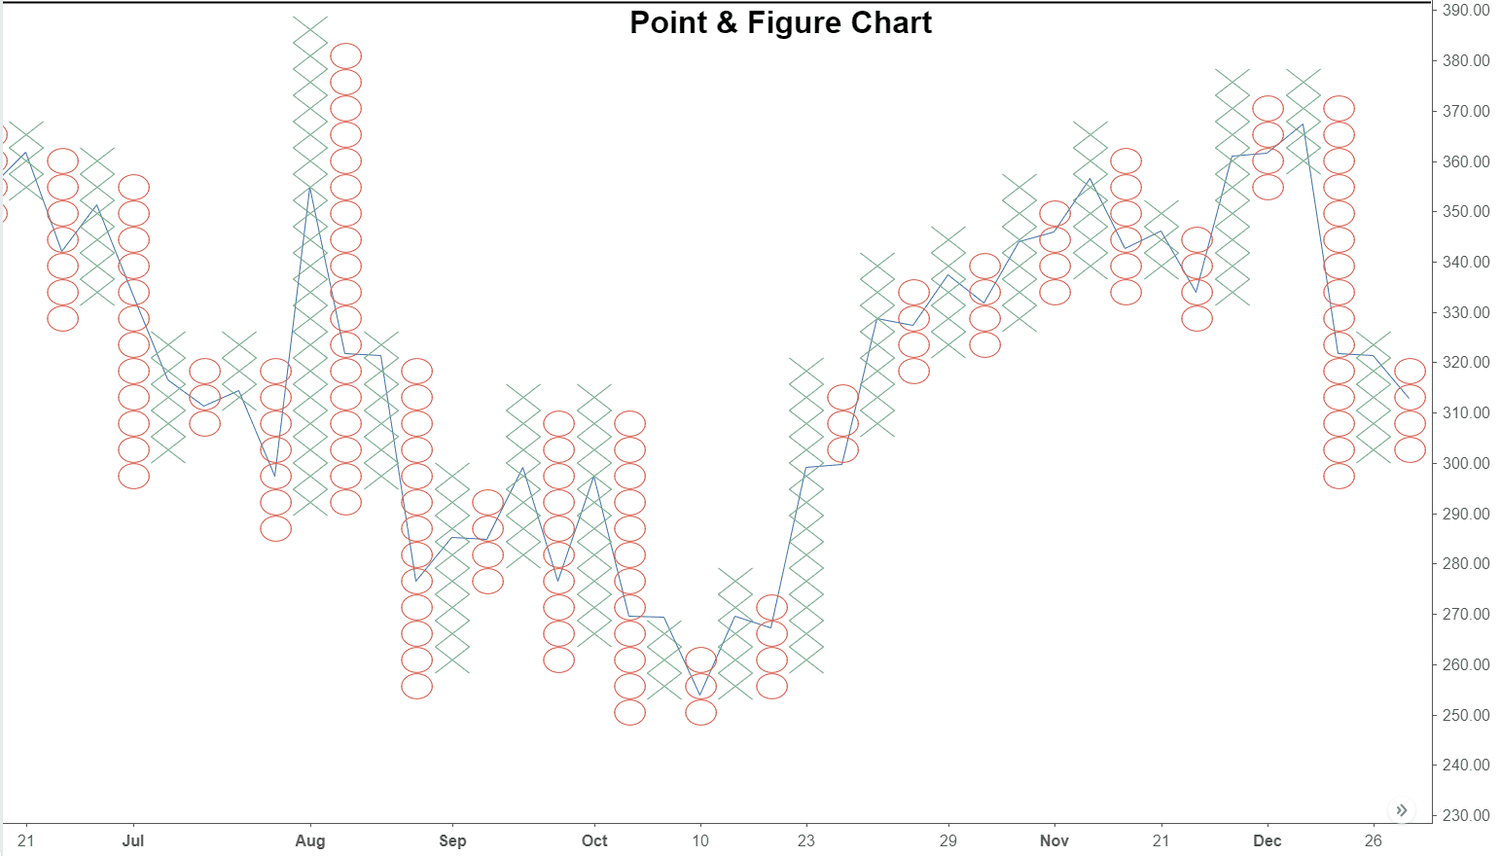
Point & Figure (P&F) charts
Point & Figure charts represent price movements using Xs and Os without considering time. They help traders identify support and resistance levels, trendlines, and chart patterns such as double tops or bottoms. P&F charts are useful for identifying key price levels and making decisions based on price action rather than time-based analysis.
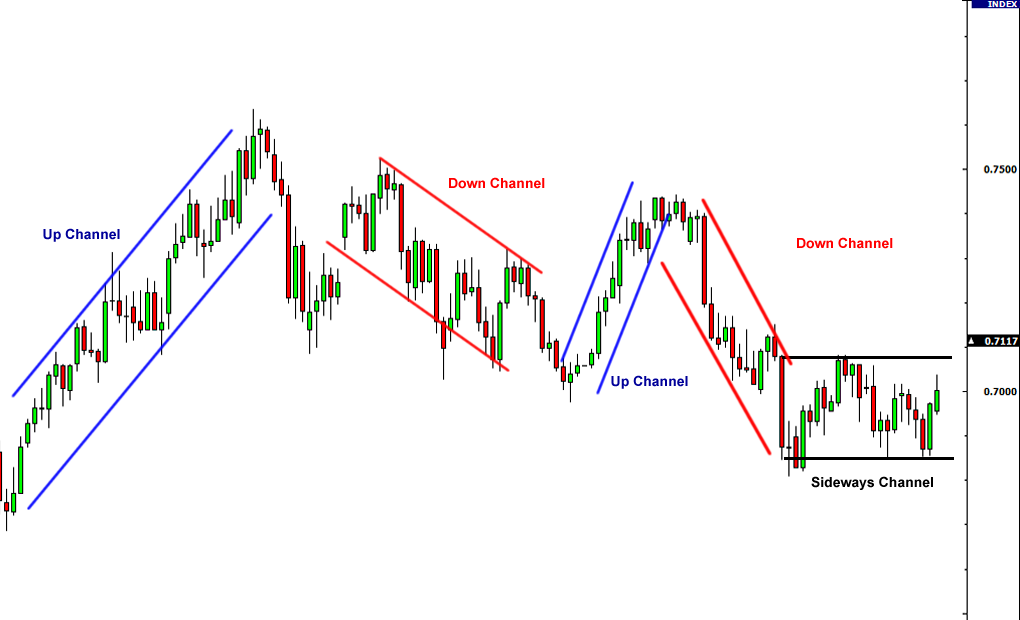
Channel down and channel up
Channel patterns, such as channel down (descending channel) and channel up (ascending channel), are formed by drawing parallel trend lines along the highs and lows of price movements. They help traders identify potential trading ranges and breakout opportunities and are useful for identifying trend continuation or reversal signals in crypto trading.
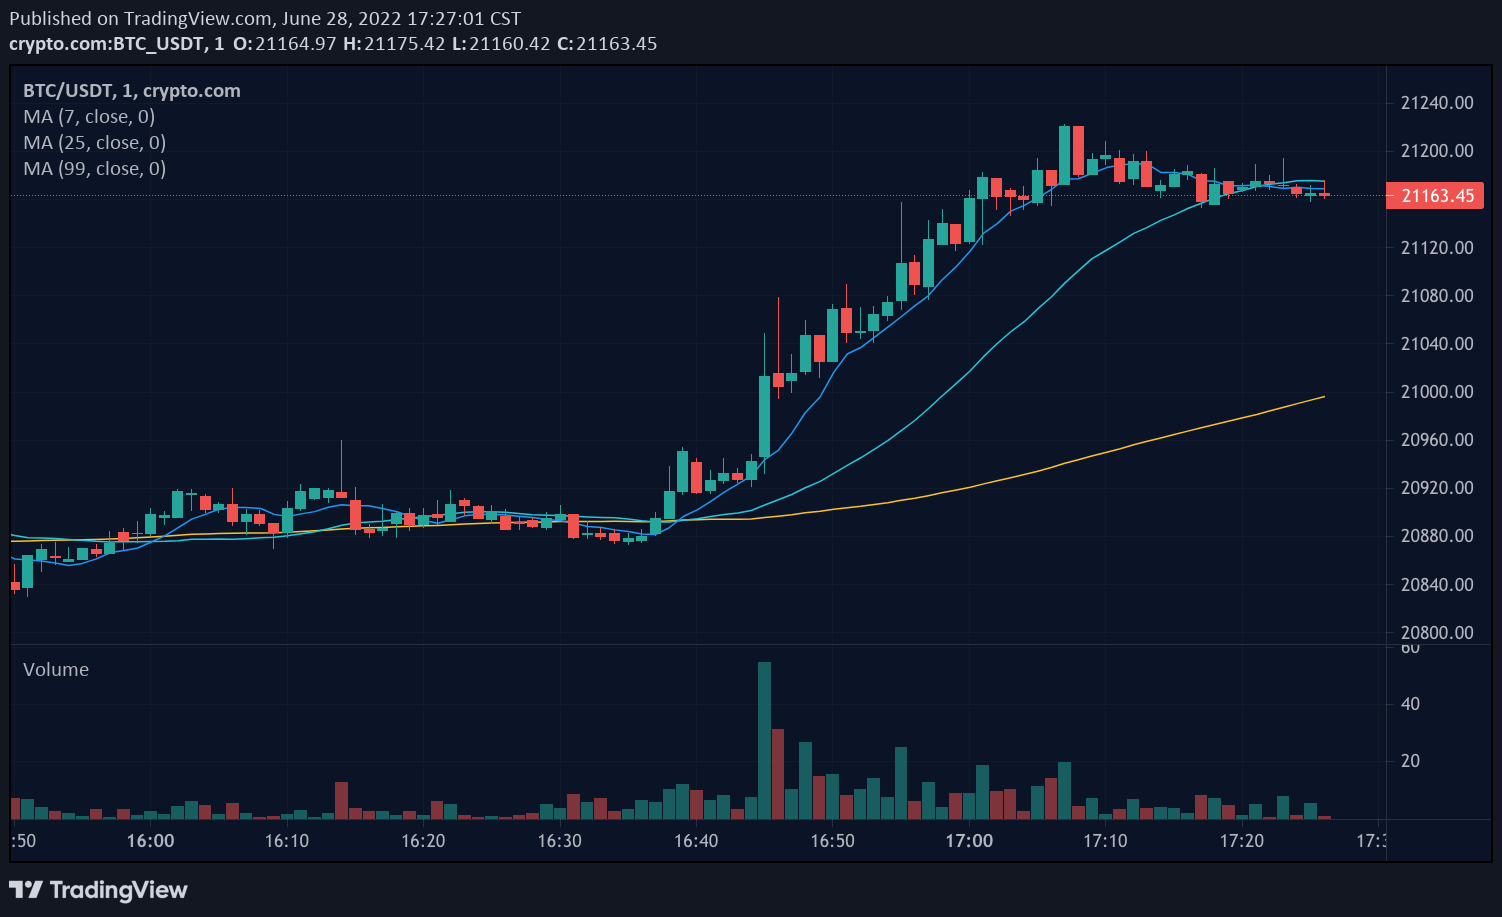
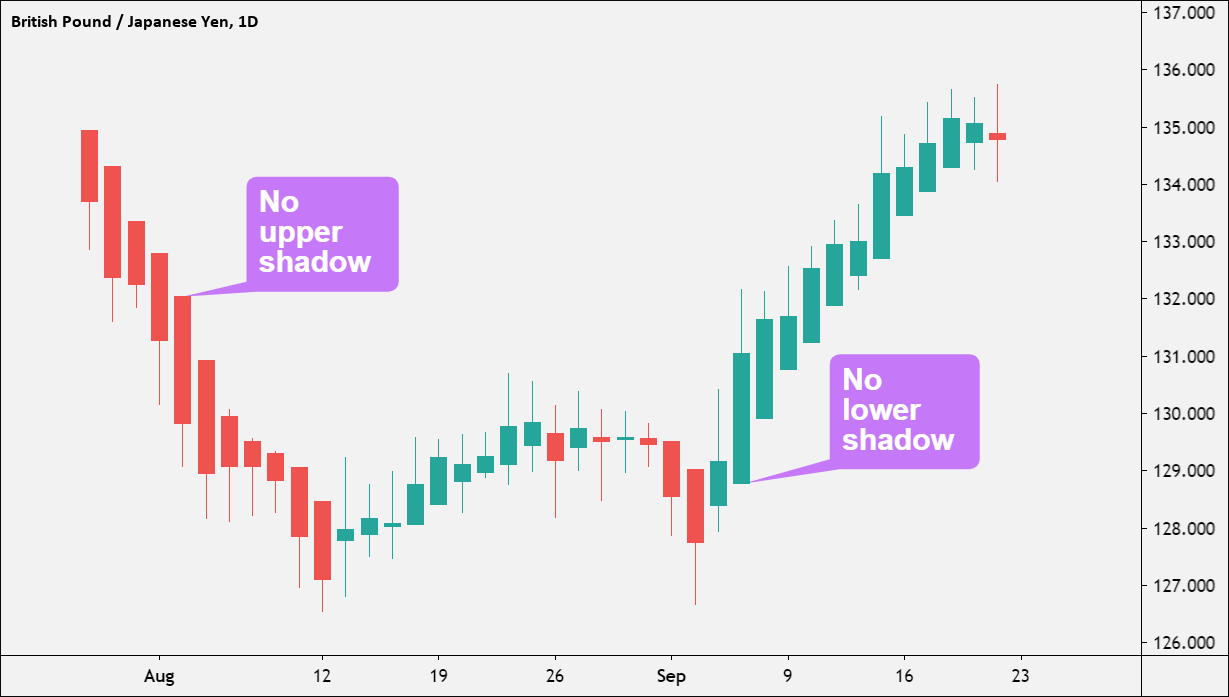
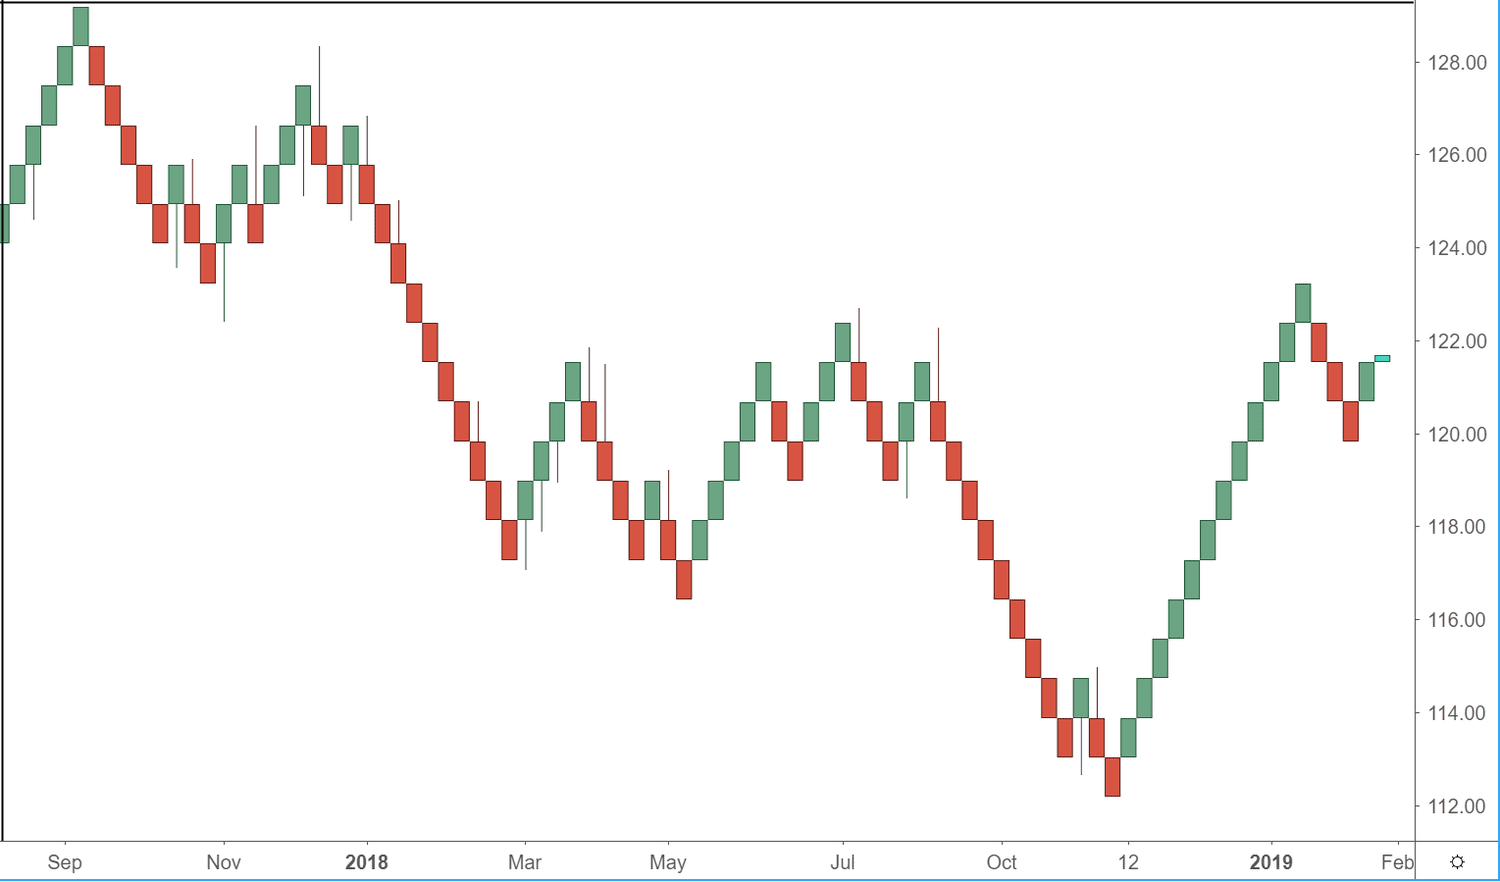
Candlestick charts
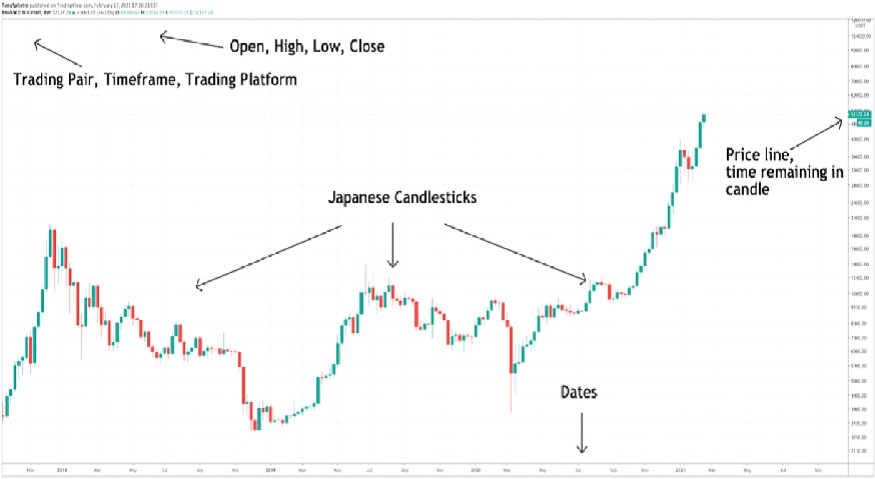
Candlestick charts display price movements within a specific time frame using candlestick shapes. They provide detailed information about the opening, closing, high, and low prices during the chosen period. Candlestick patterns, such as doji, hammer, or engulfing patterns, help traders identify potential trend reversals or continuation signals. Candlestick charts are widely used in crypto trading to provide insights into market sentiment and price action.
Top strategies to identify with crypto charts
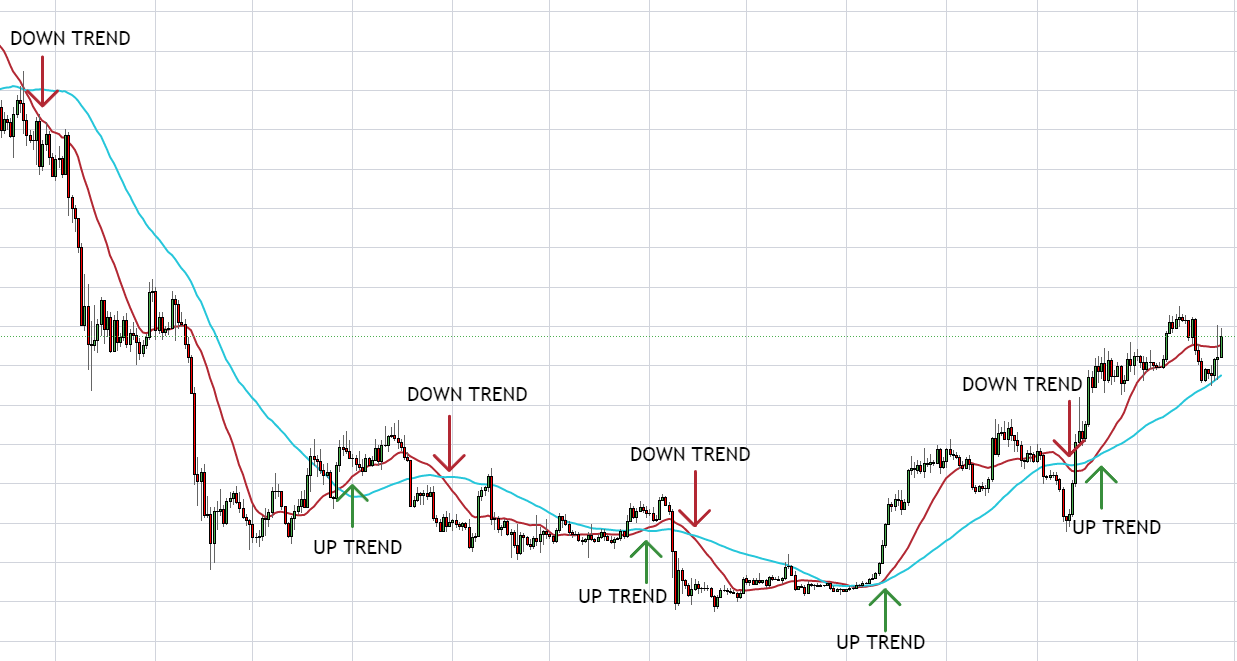
Trend following
A trend following strategy involves identifying and trading in the direction of already established trends. Traders look for cryptocurrencies that consistently make higher highs and higher lows in an uptrend or lower highs and lower lows in a downtrend.
For example, when the cryptocurrency price is consistently trading above key moving averages, such as the 50-day or 200-day moving average, it suggests a bullish trend and vice versa. Additionally, the moving averages’ slope can indicate the uptrend’s strength. Chart patterns like ascending triangles, bullish flags, or bull flags can be used in this strategy to signal uptrends. These patterns typically occur during consolidation phases within an uptrend and indicate a continuation of the bullish momentum.
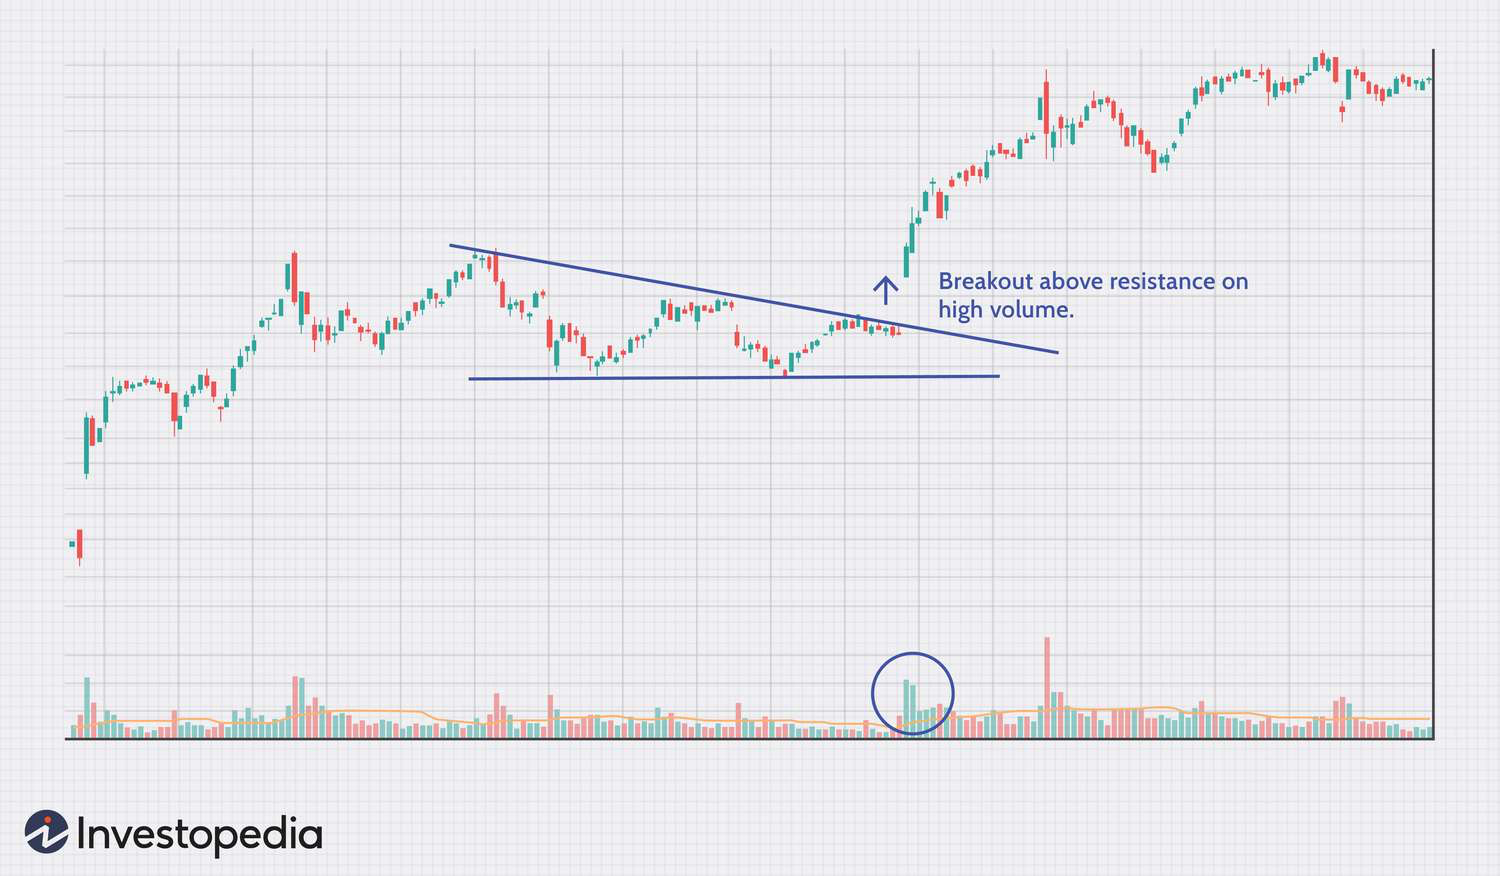
Breakout trading
Breakout trading involves entering a trade when the price breaks above resistance levels in an uptrend or below support levels in a downtrend. Traders aim to capitalize on the momentum created by the breakout.
Crypto traders can use technical indicators such as Bollinger Bands or Donchian Channels to identify periods of low volatility, which often precede breakouts. When a breakout occurs with high volume, it confirms its validity and provides a trading opportunity.
For example, a bullish breakout occurs when the cryptocurrency price breaks above a significant resistance level in an uptrend and vice versa.
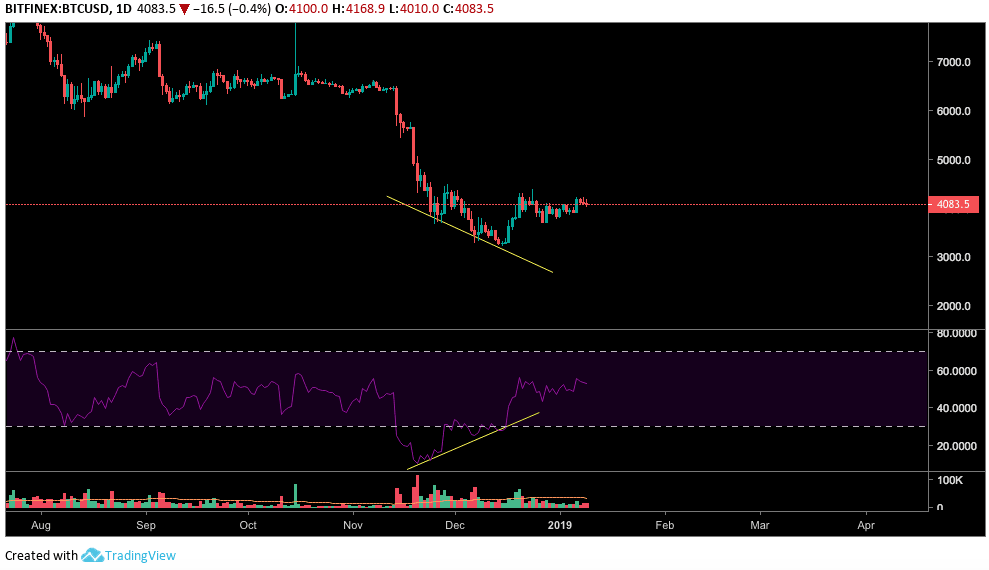
Divergence trading
Divergence trading is a strategy based on identifying discrepancies between a cryptocurrency’s price and a related technical indicator, such as the relative strength index (RSI) or the moving average convergence divergence (MACD). Divergence occurs when the cryptocurrency’s price moves in the opposite direction of the indicator, signaling a potential reversal or continuation of the trend.
Divergence suggests bullish sentiment when the cryptocurrency’s price forms lower lows while the corresponding indicator forms higher lows and vice versa. This indicates weakening exit pressure and potential upward momentum.
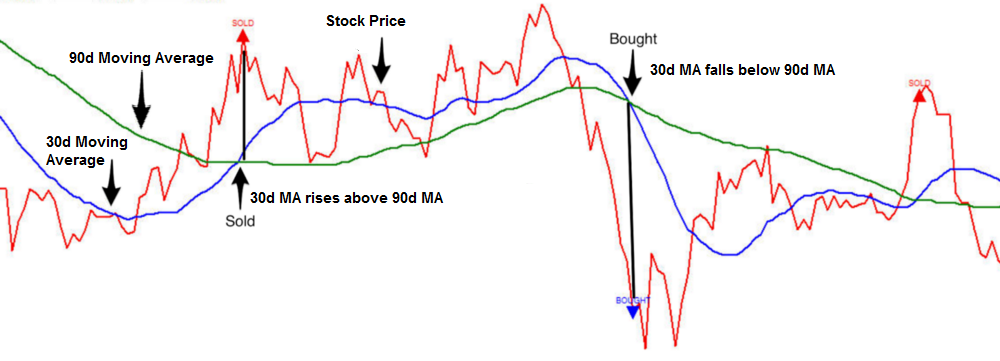
Mean reversion
Mean reversion trading involves identifying overbought or oversold conditions in the market and taking positions that speculate on a return to the mean (average) price. Traders look for cryptocurrencies that have deviated significantly from their historical price averages and expect them to revert to those levels.
Crypto traders can use oscillators such as the Relative Strength Index (RSI) or the Stochastic Oscillator to identify overbought or oversold conditions on crypto charts. When the RSI or Stochastic Oscillator reaches extreme levels (such as above 70 for overbought or below 30 for oversold), it may indicate a potential reversal in price direction. Traders can then seek confirmation from other indicators or chart patterns before entering a mean reversion trade.
Step wise guide to read a crypto chart
Choose the cryptocurrency chart
Start by selecting the cryptocurrency chart one wants to analyze. Focus on cryptocurrencies with high liquidity and trading volumes, as they tend to have more reliable price data. Look for reputable trading platforms or charting websites that offer a wide range of cryptocurrencies.
Determine the timeframe
Decide on the timeframe that aligns with the trading strategy and objectives. Shorter timeframes, such as minutes or hours, are suitable for day trading or scalping strategies, while longer timeframes, such as days or weeks, are better suited for swing trading or long-term investing. When choosing the timeframe, consider the volatility of the cryptocurrency and risk tolerance.
Identify the type of chart to use
Select the type of chart that provides the most relevant information for the analysis. Candlestick charts are widely used in crypto trading because they effectively convey price action and market sentiment. They display open, high, low, and close prices for each period, making identifying patterns and trends easier.
Analyze the overall trend direction
Determine the overall trend direction by examining price movements on the chart. Look for patterns of higher highs and higher lows in an uptrend or lower highs and lower lows in a downtrend. Use trendlines or moving averages to confirm the direction of the trend and identify potential entry or exit points.
Look for key support and resistance levels
Identify key support and resistance levels on the chart to determine potential price reversal or continuation points. Support levels act as floors where purchase interest is strong, while resistance levels act as ceilings where exit pressure is strong. These levels can help traders set gain targets and manage risk by placing stop-loss orders.
Evaluate any significant candlestick patterns present
Pay close attention to any significant candlestick patterns present on the chart. They can provide valuable insights into market sentiment and potential price reversals. Look for patterns such as bullish engulfing, bearish engulfing, hammer, or doji and consider their implications for the trading strategy.
Overlay relevant technical indicators
Overlay relevant technical indicators on the chart to enhance the trading analysis and identify potential trading opportunities. Common indicators used in crypto trading include moving averages, relative strength index (RSI), stochastic oscillator, MACD, and Bollinger Bands. These indicators confirm trends, identify overbought or oversold conditions, and generate trade signals.
Consider trading volume to confirm price movements
Analyze trading volume alongside price movements to confirm the validity of the price action. High trading volume accompanying price increases suggest strong purchase interest, while high volume accompanying price decreases indicate strong exit pressure. Low volume during price movements may signal a lack of conviction and potential trend reversal.
Factor in recent news or events
Stay informed about recent news or events that may impact the cryptocurrency’s price movements. News about regulatory developments, technological advancements, partnerships, or market sentiment can influence investor behavior and drive price volatility. Consider the potential impact of news events on the cryptocurrency’s price action and adjust the trading strategy accordingly.
Apply risk management principles
Finally, risk management principles should be applied to the trading strategy to protect capital and minimize losses. Based on the analysis, set clear entry and exit points, define risk tolerance, and use stop-loss orders to limit potential losses. Consider position sizing, diversification, and risk-reward ratios to ensure a disciplined approach to trading.
Tips to read crypto charts
- Use crypto-specific technical indicators: Utilize technical indicators tailored for cryptocurrencies, such as the crypto fear and greed index, which gauges market sentiment and helps identify potential trading opportunities based on investor psychology.
- Stay updated with crypto-related news: Keep abreast of news and events specific to the cryptocurrency market, as they can significantly impact prices. News about regulatory changes, technological advancements, or major market developments can influence market sentiment and price movements.
- Watch for crypto market manipulation: Be vigilant for signs of market manipulation, such as unusual price movements or suspicious trading activity. Manipulative practices, such as pump-and-dump schemes or spoofing, can distort price charts and mislead traders.
- Understand crypto market cycles: The cryptocurrency market is cyclical, characterized by periods of bull markets (rising prices) and bear markets (falling prices). Recognizing market cycles can help traders anticipate price trends and adjust their trading strategy accordingly.
- Use crypto market depth charts: Analyze market depth charts, which display a cryptocurrency’s supply and demand levels at various price points. They provide insights into liquidity levels, support and resistance levels, and potential price movements.
- Track crypto market order flow: Monitor market order flow to gauge the exit and entry pressure in the market. Tracking order flow data, such as the volume of entry and exit orders and order execution speed, can help traders identify market trends and assess market sentiment.
Analyze crypto charts for better price forecasting
Reading crypto charts allows traders to make informed decisions based on technical analysis, leading to potential gain opportunities.
However, reliance solely on chart analysis may overlook fundamental factors affecting cryptocurrency prices, increasing the risk of losses. Therefore, while reading crypto charts provides valuable insights, traders should supplement it with fundamental analysis and risk management strategies to mitigate drawbacks and make well-rounded trading decisions.
Disclaimer: All material published on our website is intended for informational purposes only and should not be considered personal advice or recommendation. As margin FX/CFDs are highly leveraged products, your gains and losses are magnified, and you could lose substantially more than your initial deposit. Investing in margin FX/CFDs does not give you any entitlements or rights to the underlying assets (e.g. the right to receive dividend payments). CFDs carry a high risk of investment loss.