Last week’s forex market volatility brought significant moves, offering traders numerous opportunities. Will this week deliver the same potential? Let’s explore the key data points forex traders should watch and some charts of interest, including EUR/USD, USD/JPY, and Gold.
Forex Week Ahead Analysis
USD in Focus: Will the Weakness Persist?
The US Dollar (USD) will be under scrutiny this week after weakening for a third consecutive week. The unexpected drop in the US Consumer Price Index (CPI) year-on-year to 3.0% has led the market to price in at least 50 basis points of cuts for this year. Federal Reserve Chairman Jerome Powell’s upcoming speech on Monday at the Economic Club in Washington could shed light on future monetary policy plans, potentially influencing the USD further. Additionally, this week’s unemployment claims are forecast to come in higher at 229,000, adding another layer of interest for traders.
ECB’s Rate Decision: Impact on the Euro
In Europe, the European Central Bank (ECB) is expected to maintain interest rates at 4.25%. With the inflation rate holding at 2.5%, well above the target of 2%, the probability of a rate hold is high. Despite the recent uncertainty surrounding the French elections, the Euro (EUR) has been one of the strongest currencies. This strength could persist if the ECB decides to keep rates steady until inflation approaches the target.
CPI Data: UK, New Zealand, and Canada
CPI data from the UK, New Zealand, and Canada will also be crucial this week. The Canadian Dollar (CAD) recently weakened against most counterparts, but any rise in inflation figures could reverse this trend. Currently, Canadian CPI year-on-year is expected to fall to 2.8% from 2.9%. In the UK, CPI year-on-year is forecast to drop below the 2% target range to 1.9%, sparking speculation that the Bank of England might consider cutting interest rates soon.
USD Index

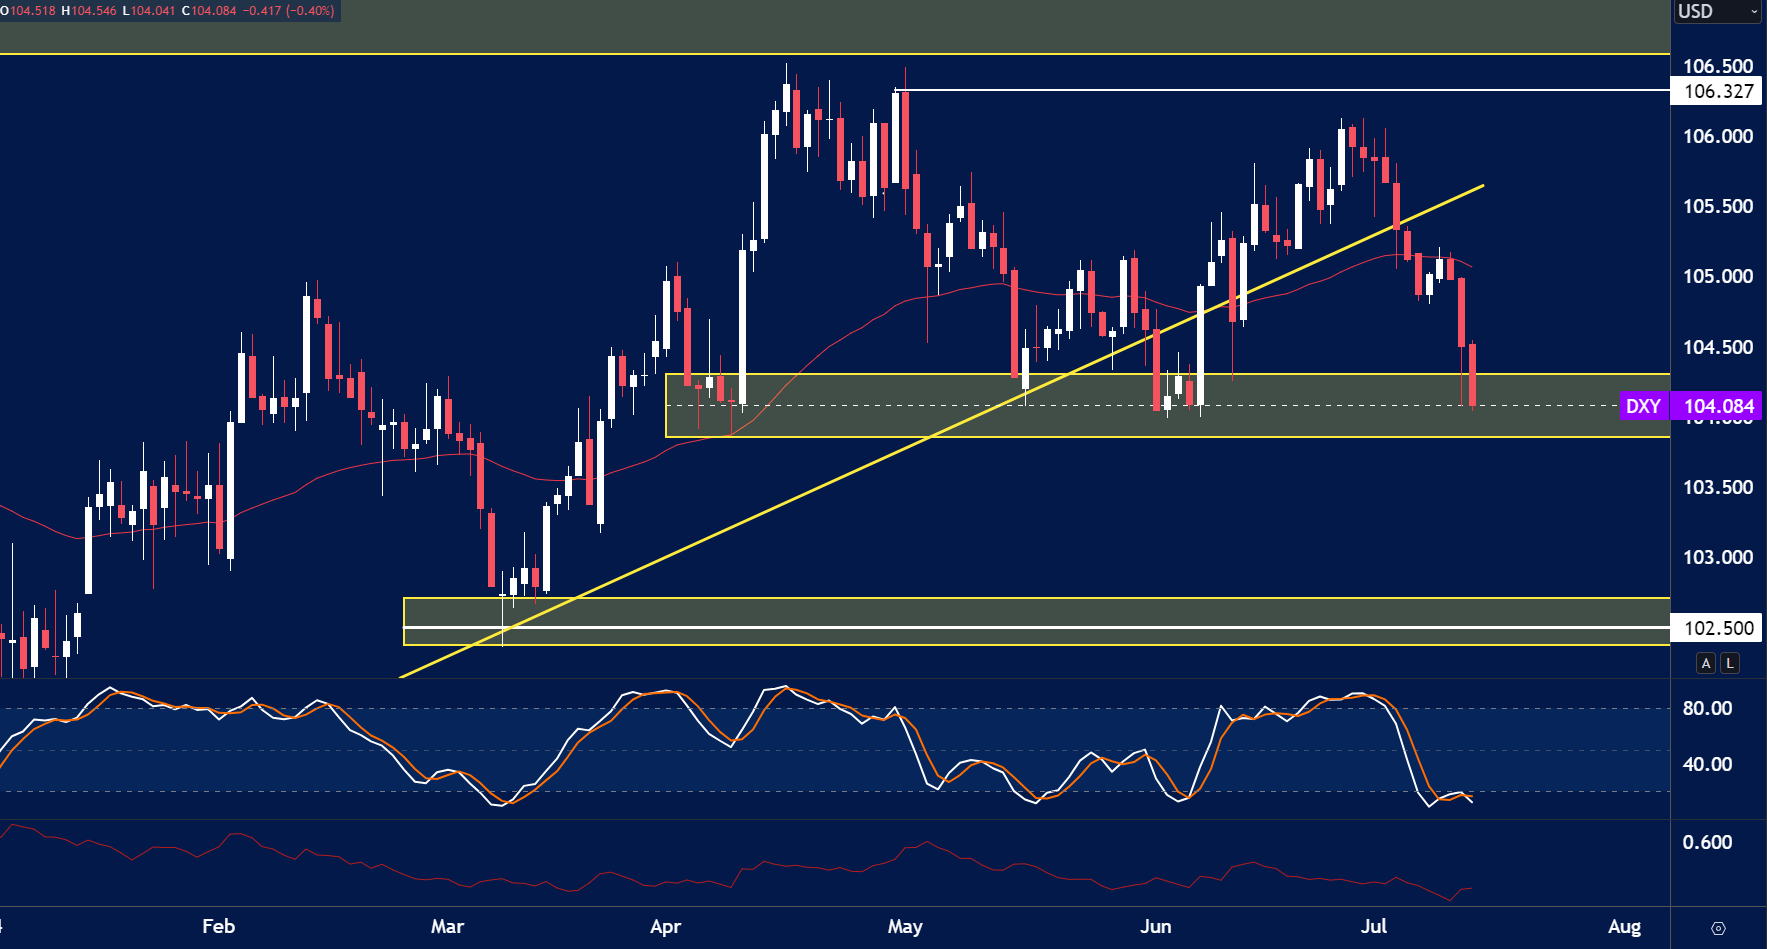
The price on the chart has traded through multiple technical levels and some observations included:
- The USD Index has fallen for a third consecutive week giving bears the control of the market.
- The price is now trading at the key support of $104.00, this level has been respected in the past and could offer the bears an opportunity to take profits.
A break below this zone would invite further selling pressure.
EUR/USD

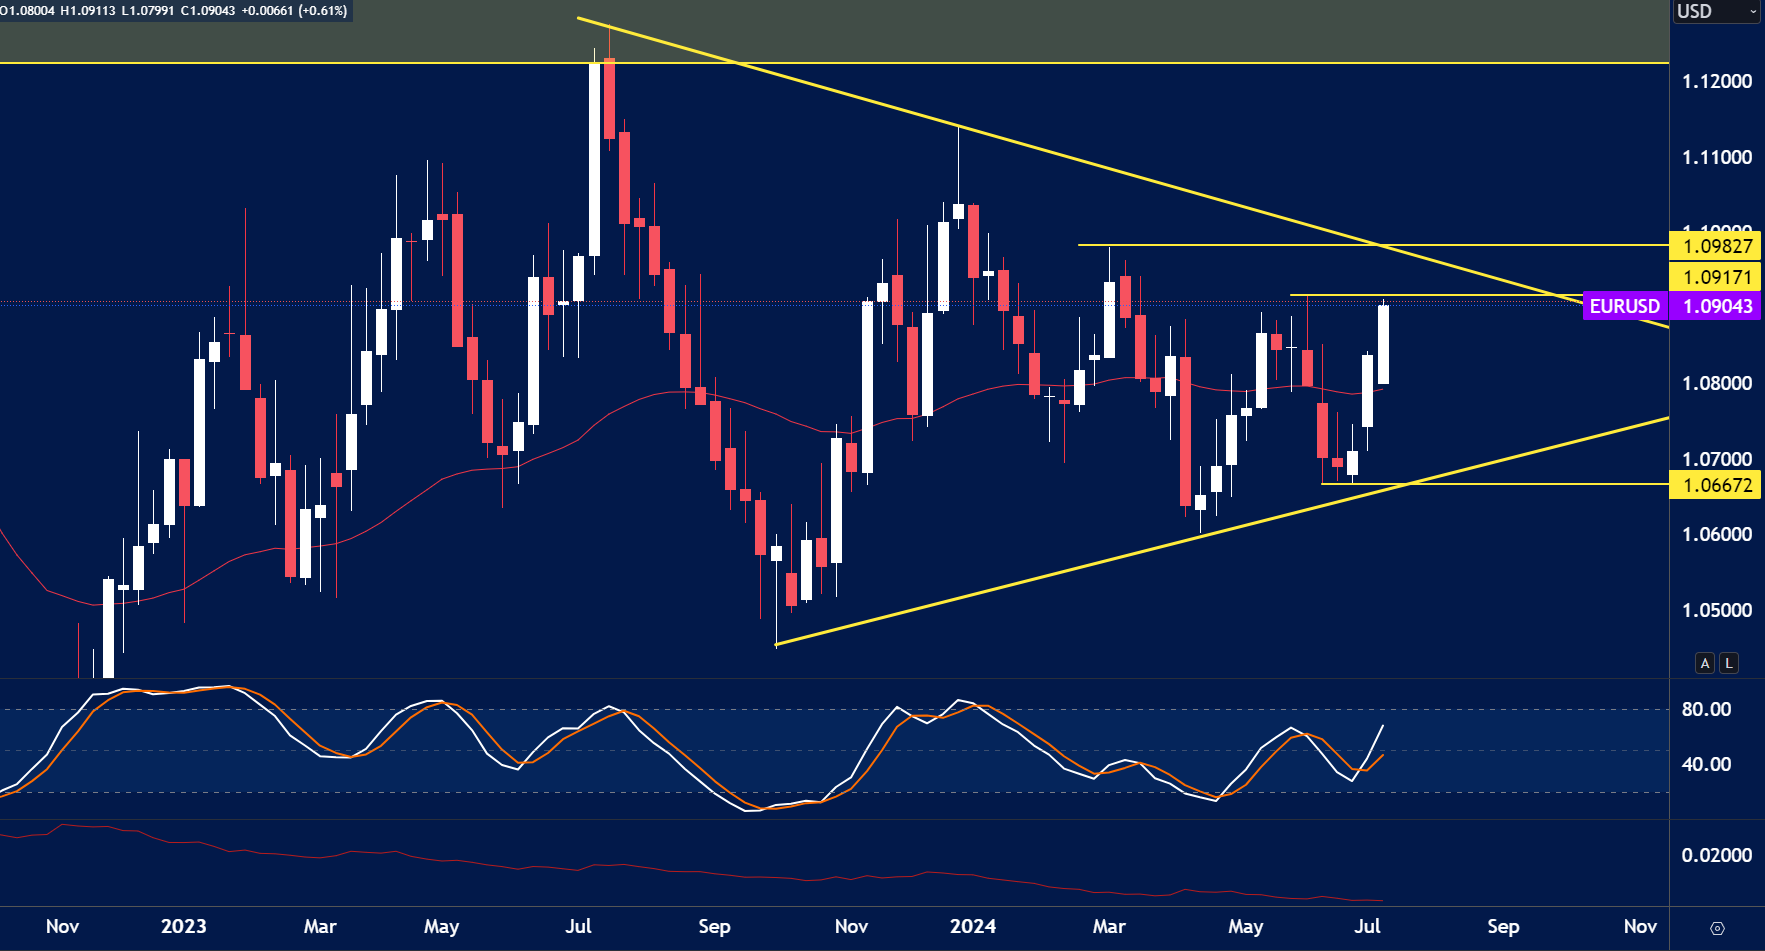
The price on the chart has traded through multiple technical levels and some observations included:
- EUR/USD is trading back at the key highs of 1.0900. If the price breaks through the highs we could expect a rally towards the trend line resistance of 1.1000.
- Buyers over the recent weeks could see these highs as a good level to take profits offering short term pullback opportunities.
USD/JPY

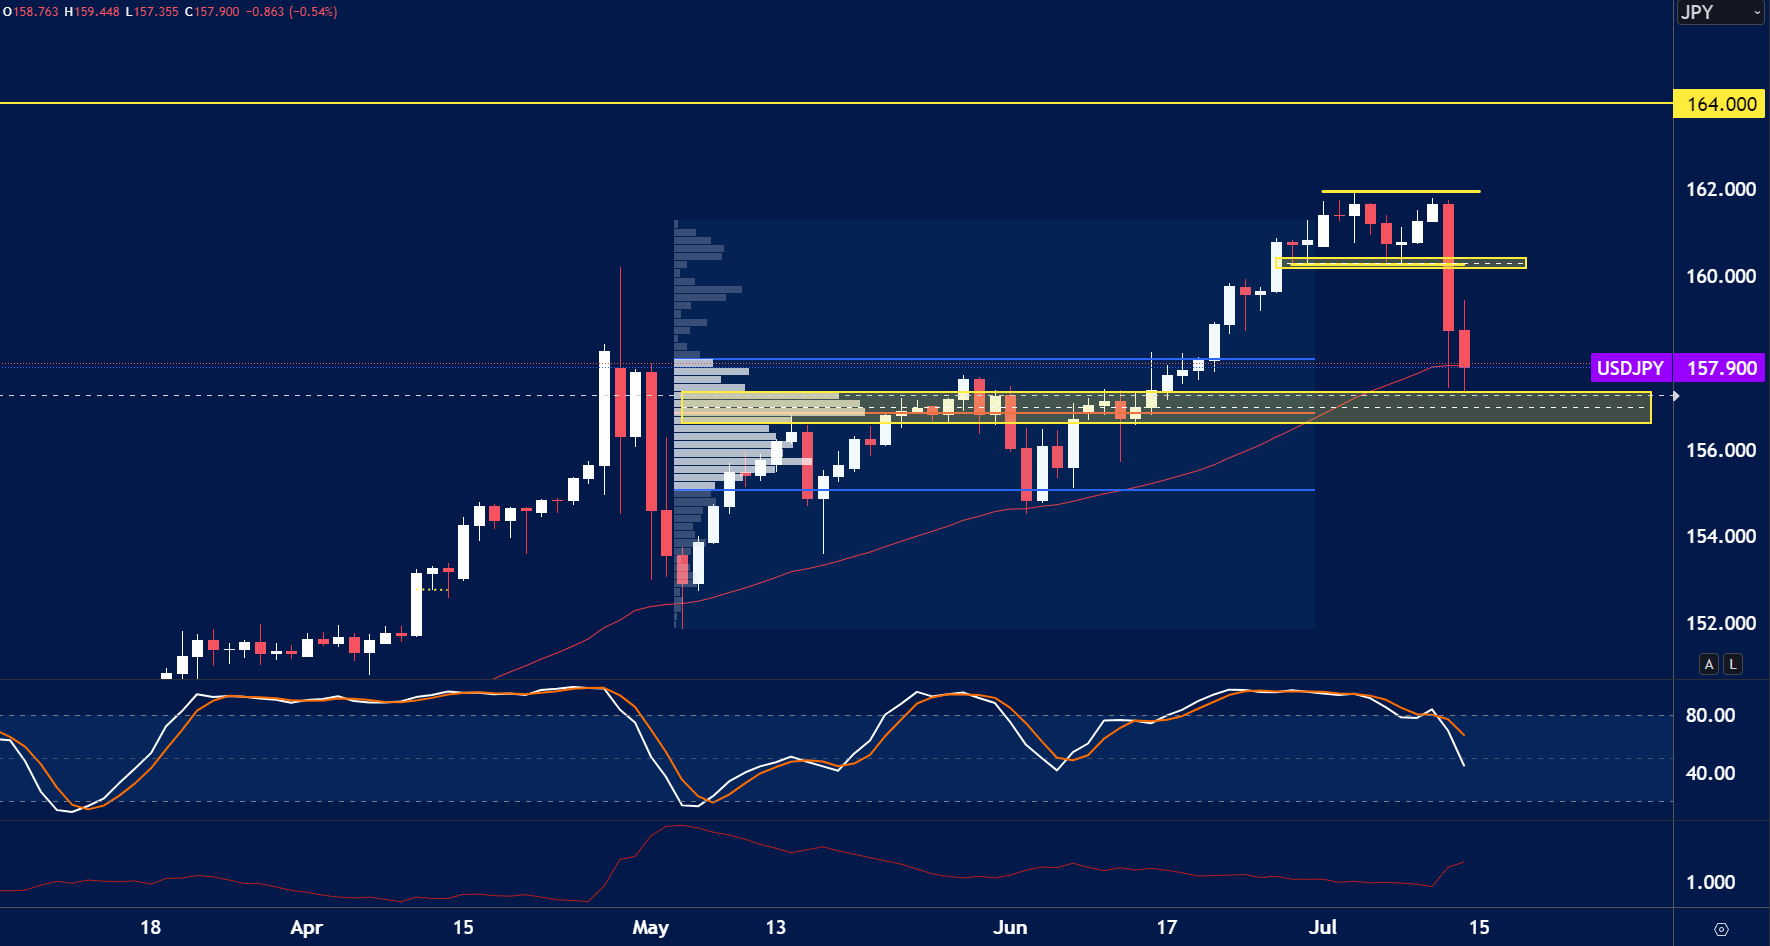
The price on the chart has traded through multiple technical levels and some observations included:
- The Bank of Japan last week intervened in the market after the US CPI data.
- JPY strength came in across the board driving USD/JPY prices lower towards the key support of 157.00.
- This level could be a strong level of support going into this trading week.
GOLD

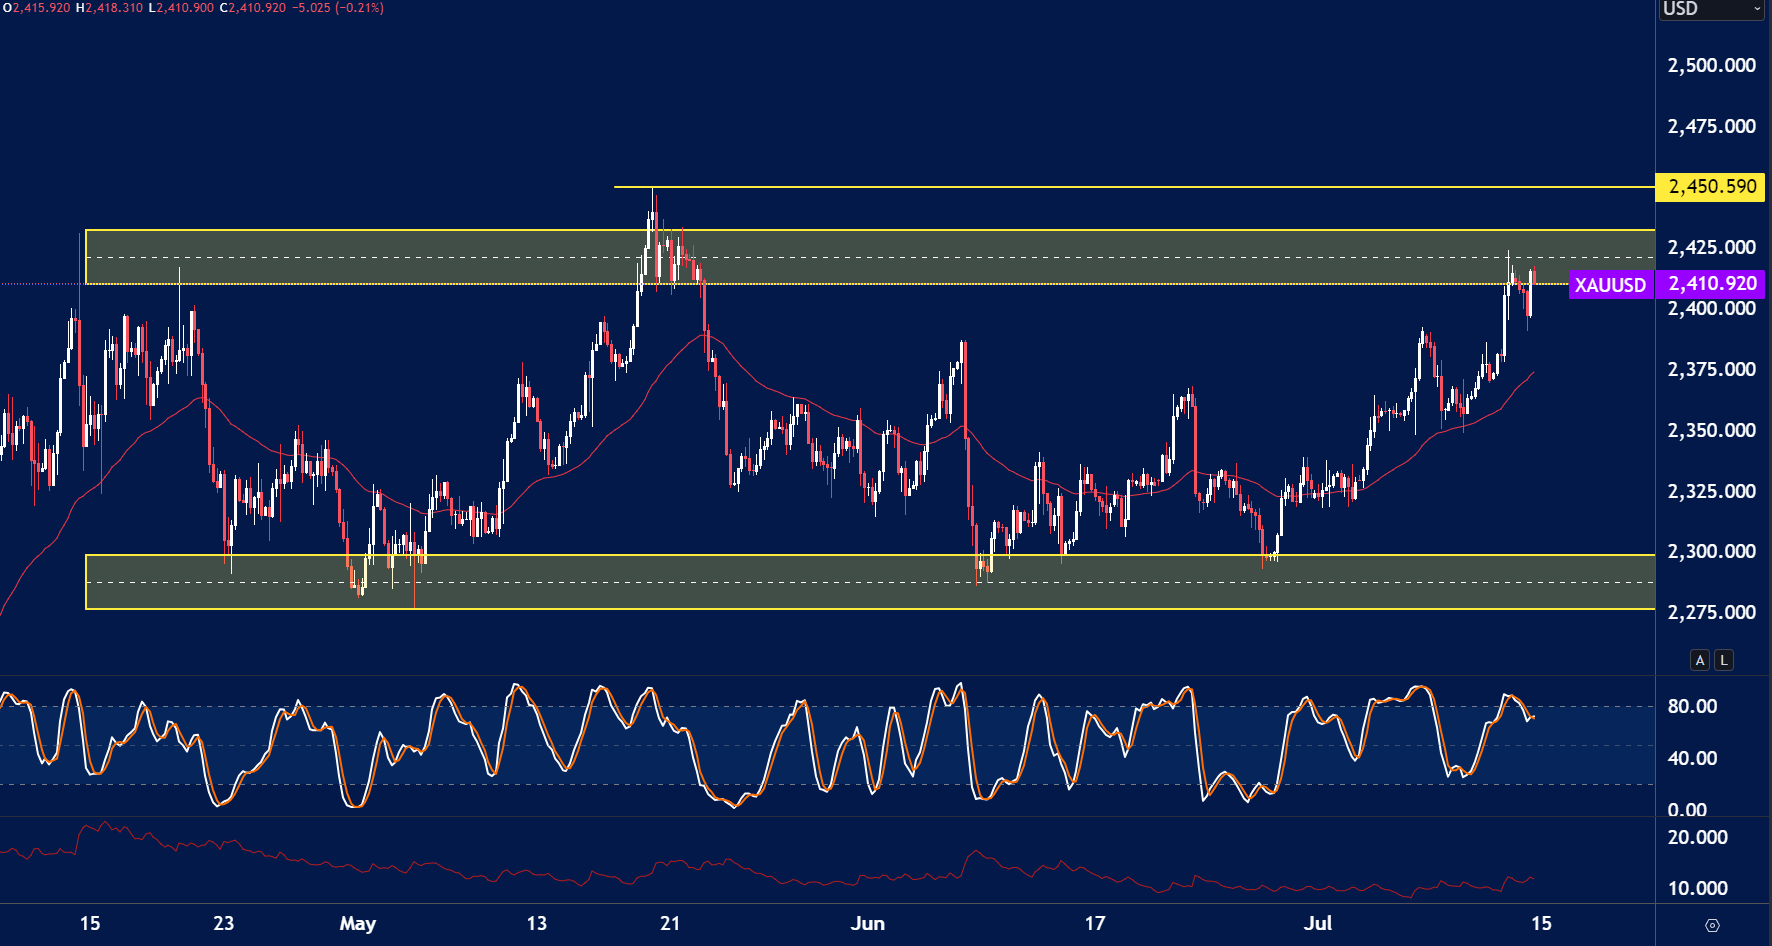
The price on the chart has traded through multiple technical levels and some observations included:
- The Gold prices traded higher last week as the USD declined. The price has now retested the range highs at $2420.00.
- If the price trades through this resistance we could see a significant breakout.
Have you watched our latest video update? You can see it here.
Enjoy low spreads and quick trade executions with a live account. Our highly committed customer support team will assist you with your quick account setup for any future concerns. Start trading with Blueberry.
Disclaimer: All material published on our website is intended for informational purposes only and should not be considered personal advice or recommendation. As margin FX/CFDs are highly leveraged products, your gains and losses are magnified, and you could lose substantially more than your initial deposit. Investing in margin FX/CFDs does not give you any entitlements or rights to the underlying assets (e.g. the right to receive dividend payments). CFDs carry a high risk of investment loss.


