


Understanding forex market cycles helps traders identify potential reversal points, and current market direction, and set gain targets accordingly.
This article will discuss forex cycle analysis and how it can be used to time market price movements.
What are market cycles?
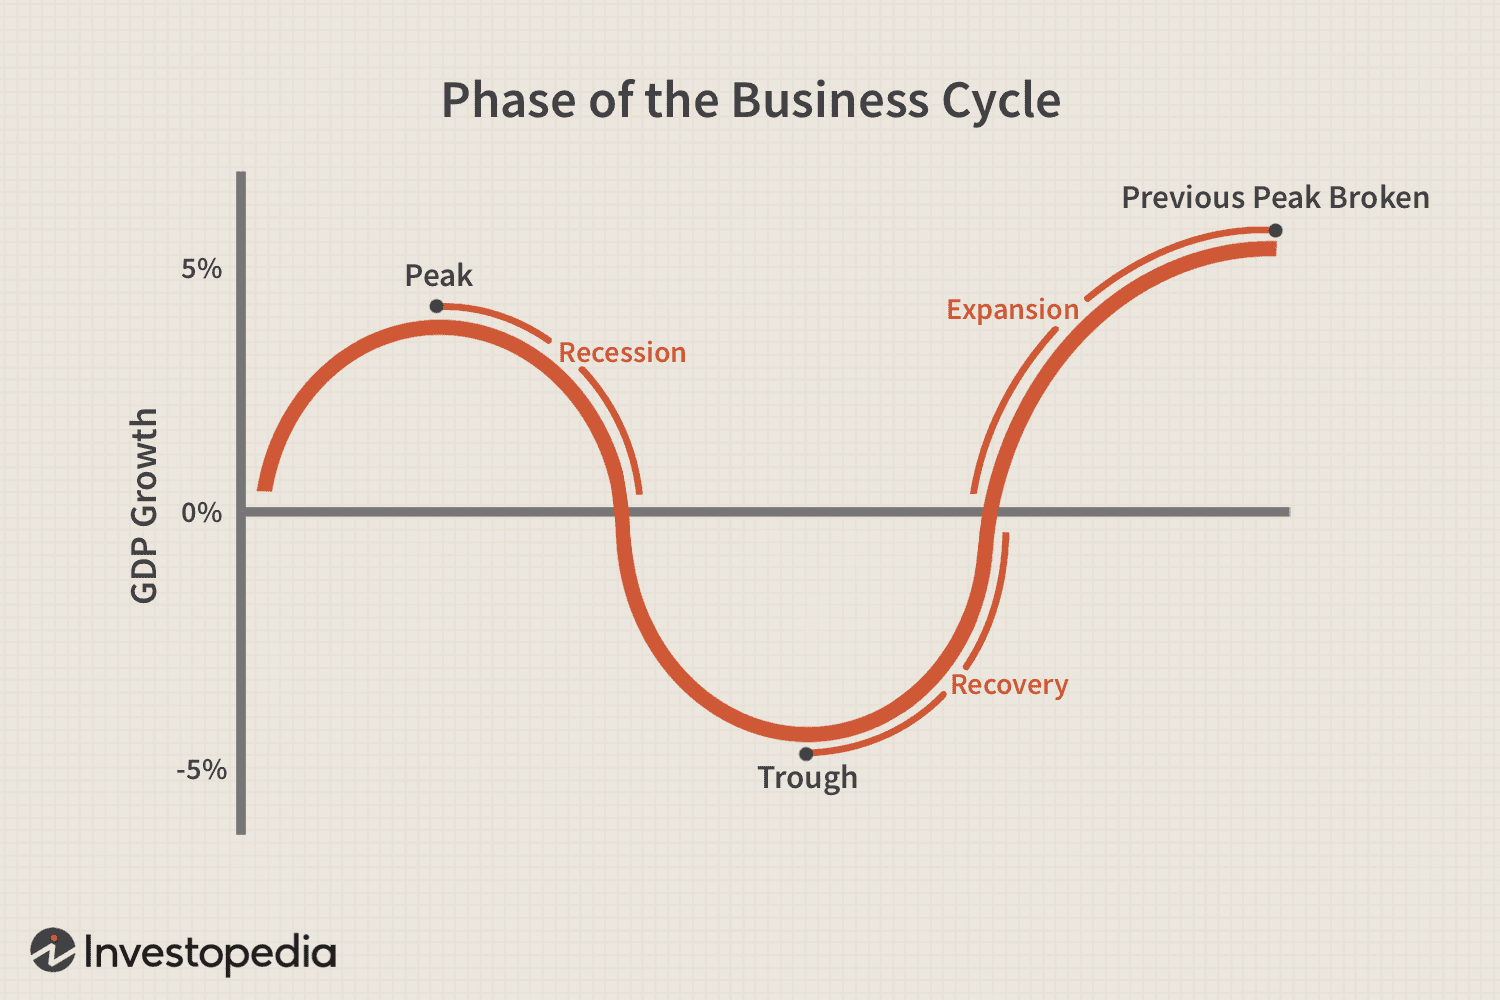
Market cycles are a financial market's recurring phases of decline or growth. The cycles can be affected by different factors such as investor sentiments, internet rates, etc. All market cycles differ in both length and intensity. Some cycles can last for only a few months (short-term cycle), while some also last for multiple years (long-term cycle). There are four main phases in any market cycle
1. Expansion: This is an economic growth period that witnesses rising prices, business activity, and employment.
2. Peak: This is the highest point in the expansion cycle where economic activities reach their maximum level. The prices begin to stabilize and decline in this phase.
3. Contraction: This is the period of major economic decline with decreasing prices, falling business activity, and increasing unemployment.
4. Trough: This is the lowest point of the contraction cycle, where economic activities reach their minimum level and prices start to bottom out.
What is forex cycle analysis?
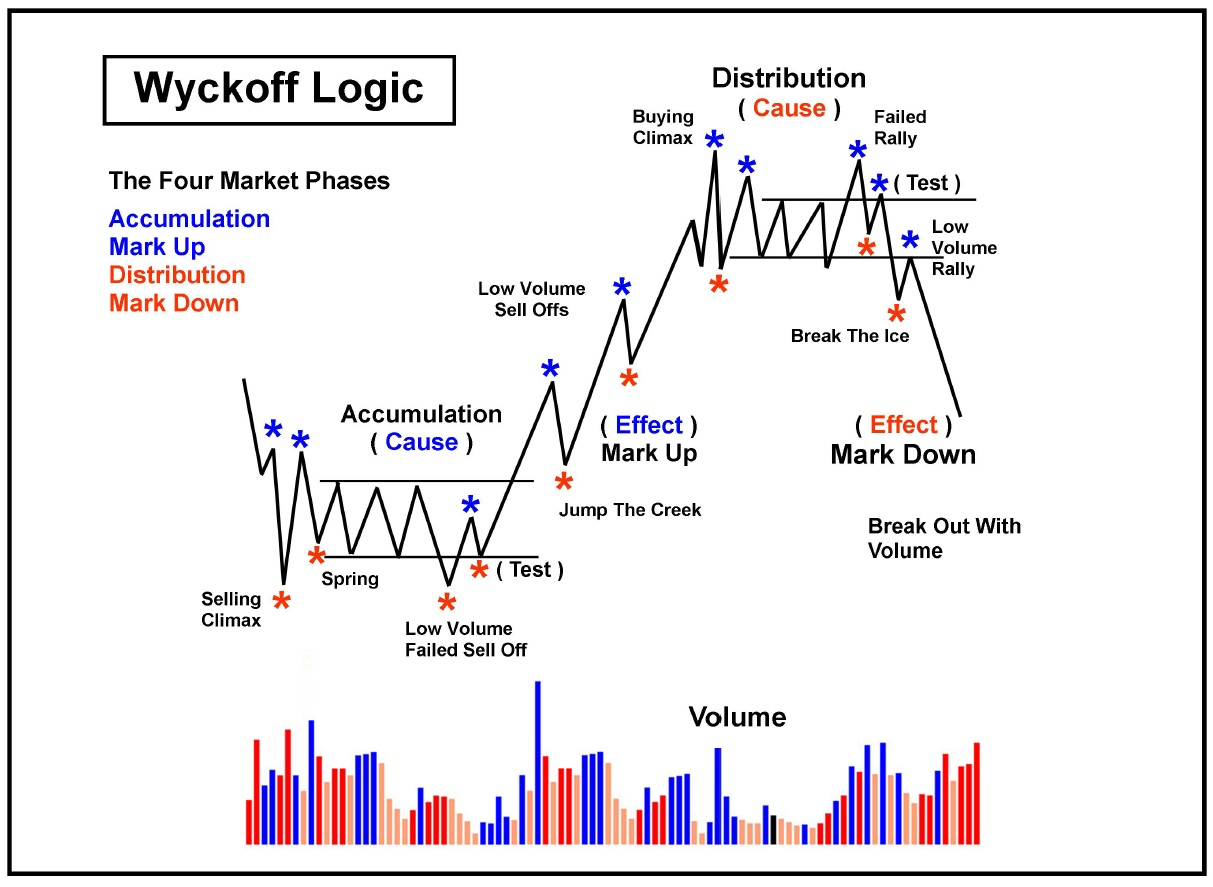
Forex cycle analysis is a technique that forex traders use to predict currency pair movements. This includes examining cyclical trends (short-term, medium-term, and long-term) in the market that currencies follow. Time period. When traders identify these cycles, they are able to make better entry and exit decisions. The forex market cycle analysis can be understood with a pattern of four points –
-
Accumulation phase, where the market consolidates after a downtrend and traders start entering long positions
-
Markup phase where the market starts trending upwards, and there is a consolidation breakout with steadily increasing prices
-
Distribution phase where the market reaches its peak market price and shows signs of reversals, with traders exiting long and entering short positions
-
Markdown phase where the market starts trending downwards, and exit pressure increases with sharp declines in prices
Commonly used indicators in cycle analysis
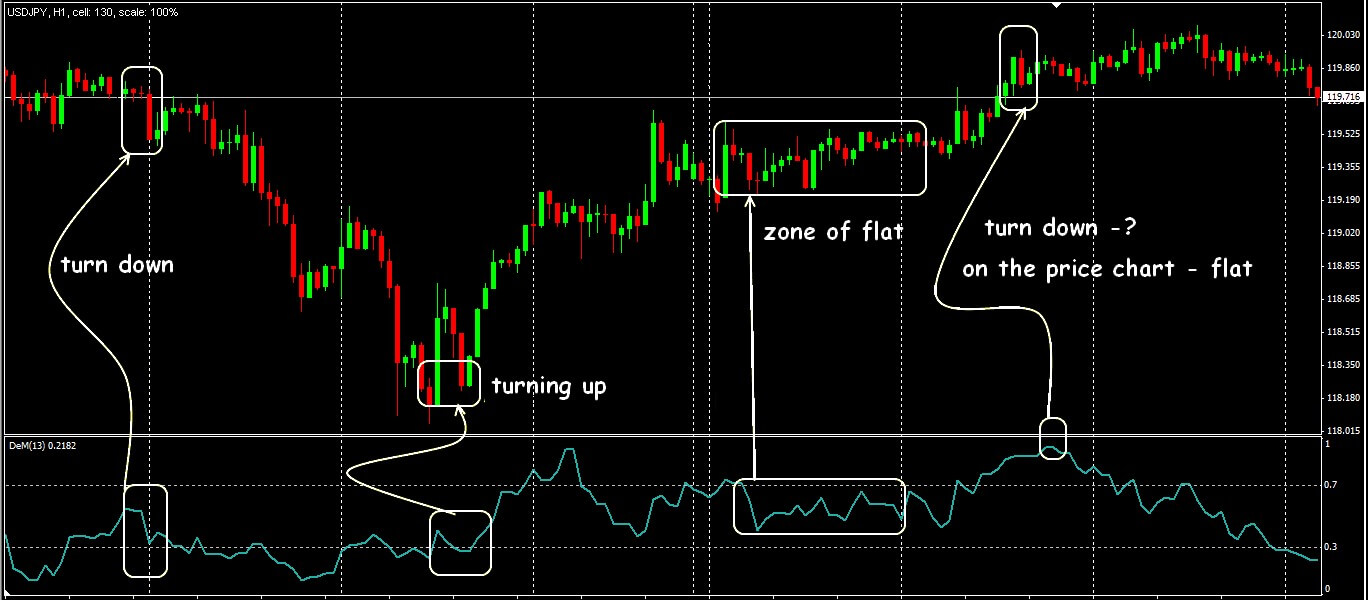
DeMark indicator
The DeMark indicator is used to identify reversal points in forex. It identifies exact price moments where exit or entry pressure exhausts, leading to a trend reversal. Different DeMark cycle indicators help in the market cycle analysis in the following ways –
-
The TD sequential is a tool that identifies exactly when the trend exhausted and reversal occurred
-
TD line identifies transitioning cycles by indicating breakout points for trend reversals
-
TD combo signals reversal points after analyzing the market price bars
-
TD range expansion calculates the trend strength within the current market cycles
-
TD range projection predicts price targets within the currency cycle
-
TD setup trend finally evaluates short-term trend analysis within the current cycle to provide traders with a reversal or continuation signal
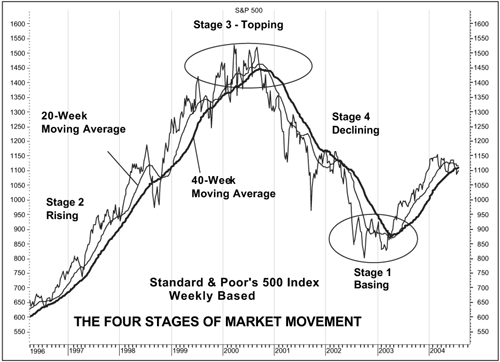
Moving averages
Moving average trading signals current trend momentum, strength, and entry/exit points. It is a trend-following indicator that helps traders determine the final direction of the trend. Here’s how moving averages can be used in forex market cycle analysis –
-
Multiple moving averages help identify different cycles within a larger trend. For example, a 20-day moving average indicates a short-term cycle, while a 100-day moving average signals a medium-term cycle
-
Moving average crossovers also confirm cycle reversal points. For example, bullish crossovers signal the end of a downtrend phase, and vice versa
-
Traders can measure a market length by calculating the distance between successive troughs or peaks of a moving average
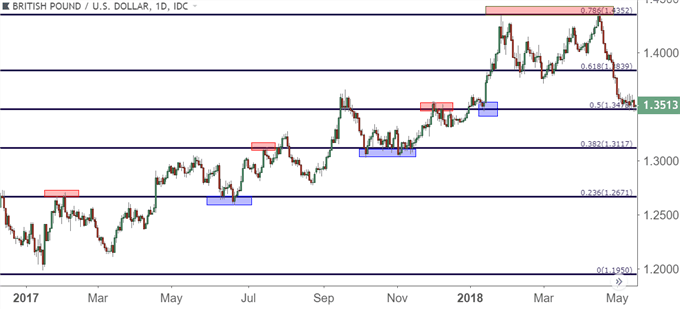
Fibonacci retracement
Fibonacci retracements help traders identify potential support and resistance levels in the forex market during market retracement and correction phases. Retracement levels such as 23.6%, 38.2%, 50%, 61.8%, and 78.6% identify the point where market correction ends and the original market phase resumes. Fibonacci retracement also helps with market cycle analysis in the following way –
-
Traders can measure the depth of correction with Fibonacci levels to understand the current trend’s strength. Deeper retracements suggest a stronger current trend and vice versa
-
If a forex pair price breaks above Fibonacci retracement levels, it can indicate the start of a new market cycle
How to time market movements with cycle analysis
Identify the currency pair and timeframe
Choose currency pairs to be traded and select the timeframe. Shorter timeframes are better for scalpers and day traders, while longer timeframes suit trading styles like swing and position trading.
Analyze historical price data
Analyze the past prices to identify recurring patterns in the market phases and predict future movements. Use technical analysis tools, such as moving averages and oscillators, to enhance your understanding of price trends. Pay attention to cyclical patterns, like seasonal effects and economic cycles, which can influence currency behavior. Correlate historical data with significant events to better anticipate potential market shifts.
Use cycle tools and indicators
Use specific cycle indicators like the Detrended Price Oscillator (DPO) to analyze market cycles and time entries accordingly. DPO removes the long-term trend component from the price data to focus on only the underlying cyclical patterns.
-
Positive DPO values indicate an uptrend within the current market cycle and vice versa
-
Any divergence between the DPO and forex prices can signal a market cycle fading
Identify cycle phases
Traders should combine technical analysis and pattern recognition to identify cycle phases. Price action technical analysis can help identify recurring price patterns, while momentum cycle indicators confirm cycle trends and reversals.
Confirm cycle signals with volume analysis
When trading volumes increase during a price breakdown or breakout, it signals a strong market phase move. Any divergence between forex prices and volume indicates that the market phase could dilute and reverse.
Determine entry and exit points
Traders should enter long positions during the accumulation phase and short positions during the distribution phase. Exiting long positions once the markup phase turns into distribution and short positions once the markdown phase goes back to the accumulation phase helps traders increase trade accuracy.
Integrate with fundamental analysis
Trades must combine cycle analysis with fundamental analysis to gain an overall understanding of market dynamics and validate cycle phases.
Implement risk management strategies
Traders should employ position sizing to mitigate risk exposure and improve trading within market cycles.
Monitor and adjust trading strategy
Monitor market conditions regularly and adjust the cycle analysis trading strategy to adapt to changing conditions. Review market trends and news and update technical analysis timeframes as the cycle duration changes.
Time market movements with cycle analysis
Forex cycle analysis provides forex traders with a structured approach to forex trading. Although cycles can be complex and sometimes overlap, they help identify if the current trend is going to continue or reverse. Traders should combine forex market analysis with other fundamental factors to ensure opportunities are not missed.
Market cycles are not always predictable and can be influenced by unexpected economic events and geopolitical tensions. Over-reliance on historical data may lead to inaccurate predictions. Forex trading involves significant risk due to market volatility, and traders may experience substantial financial losses. Robust risk management strategies and staying informed about global economic conditions are crucial to navigate these complexities effectively.
Disclaimer: All material published on our website is intended for informational purposes only and should not be considered personal advice or recommendation. As margin FX/CFDs are highly leveraged products, your gains and losses are magnified, and you could lose substantially more than your initial deposit. Investing in margin FX/CFDs does not give you any entitlements or rights to the underlying assets (e.g. the right to receive dividend payments). CFDs carry a high risk of investment loss.