


The megaphone pattern, or the inverted symmetrical triangle, is characterized by diverging trendlines and increasing volatility. It signifies growing uncertainty among traders and potentially hints at a trend reversal or continuation.
Let’s look at how to identify and trade the megaphone pattern.
What is a megaphone pattern?
The megaphone pattern helps identify trend reversals and continuations. It is characterized by two diverging trendlines: one connecting a series of higher highs (upper trendline of a bullish megaphone) and the other connecting a series of lower lows (lower trendline of a bearish megaphone). This creates a visual resemblance to a megaphone, hence the name. The price action is confined within the diverging trendlines, oscillating between the two trendlines.
- The bullish megaphone suggests a potential uptrend continuation
- The bearish megaphone suggests a potential downtrend continuation
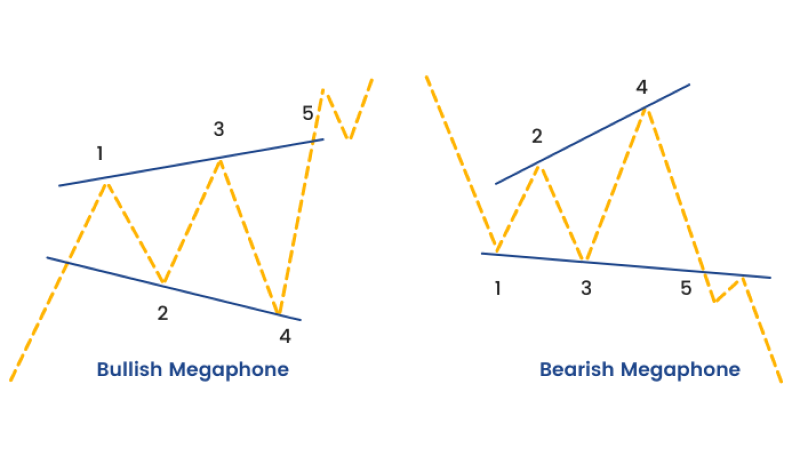
Key characteristics of the megaphone pattern are:
- Diverging trendlines: Megaphone patterns exhibit diverging trendlines, indicating increasing volatility and indecision amongst market participants
- Minimum of five swings: The pattern requires at least five price swings - two higher highs, two lower lows, and the connecting trendlines. The more swings, the more significant the pattern is considered
- Expansion in price range: The megaphone pattern signifies an expansion in the price range compared to the preceding trend. This expansion reflects growing uncertainty and the potential for a breakout
How to identify megaphone patterns
Charts
The following charts help in identifying megaphone patterns in forex:
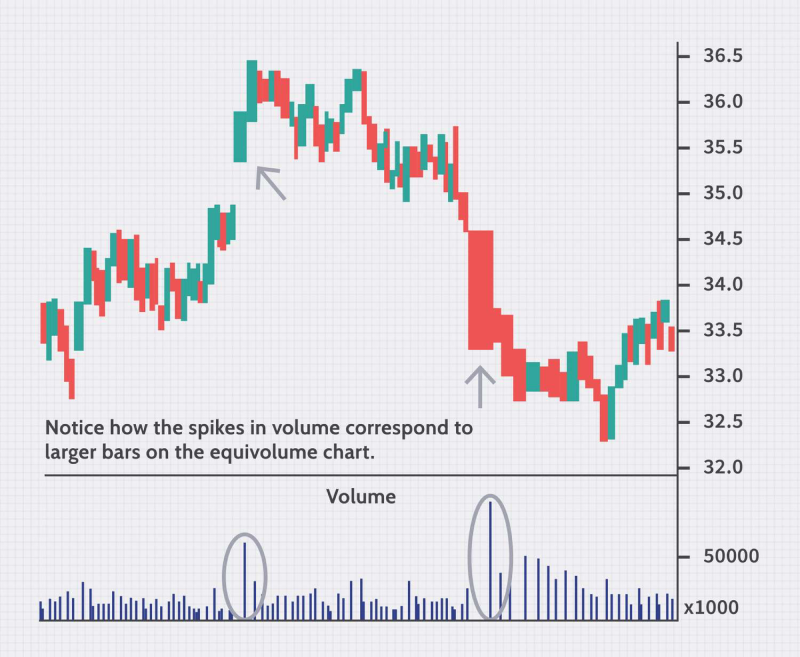
Equivolume chart
Equivolume charts represent each bar with the same width, regardless of price movement. This emphasizes trading volume rather than price fluctuations. Equivolume charts can highlight potential breakouts from the megaphone pattern by focusing on volume. Increased volume preceding a breakout towards the upper or lower trendline can signal a stronger directional move.
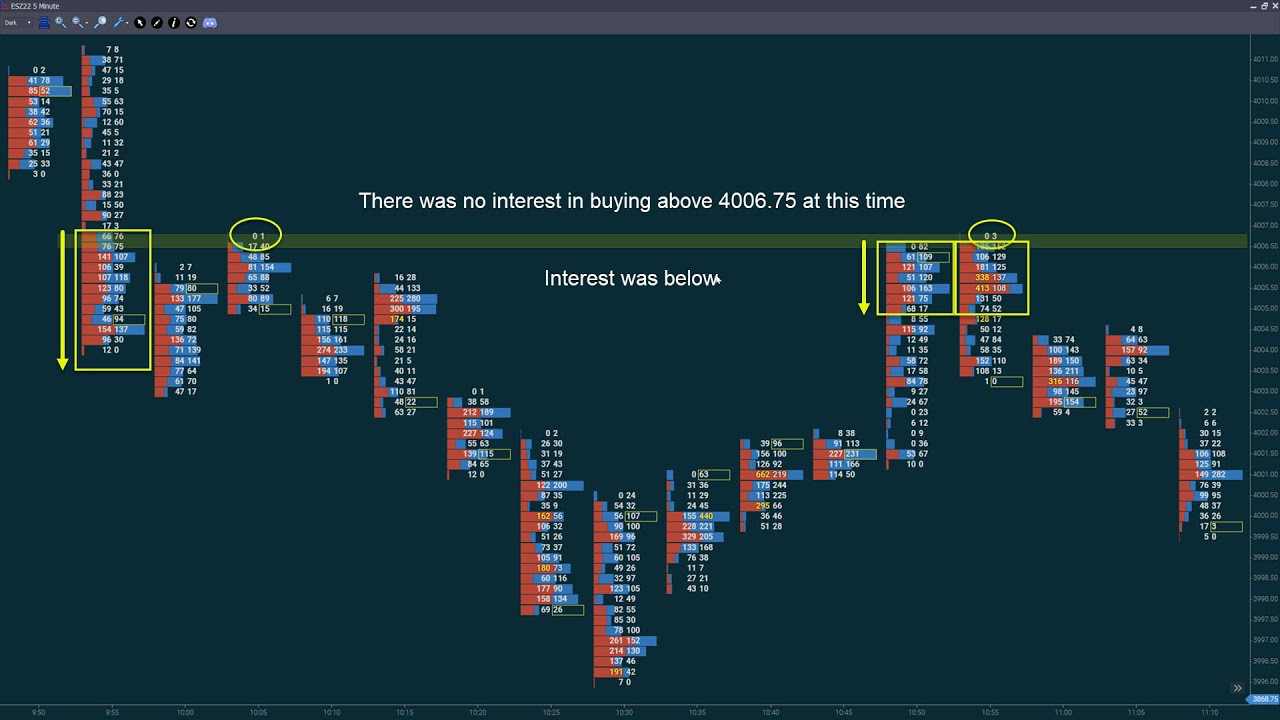
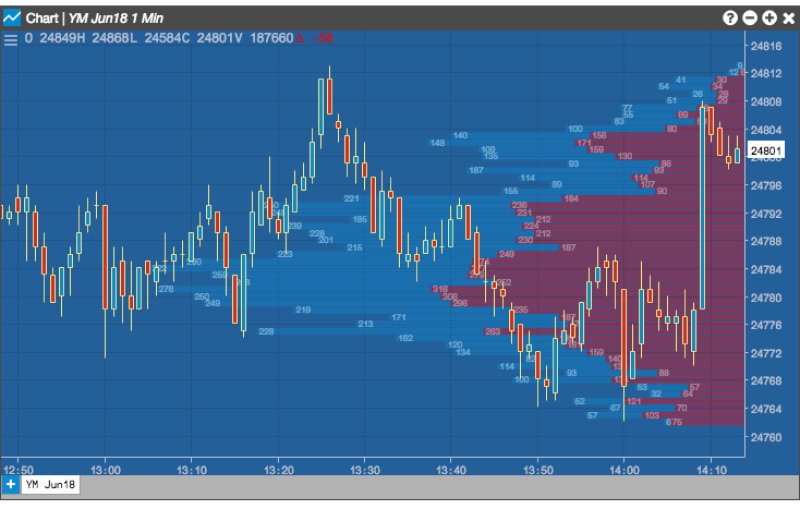
Footprint chart
Footprint charts depict the volume at different price levels within each bar, offering a detailed view of trading pressure at various points. These charts reveal imbalances between long and short pressure within the megaphone. For example, a cluster of high volume at the support trendline might indicate strong purchase interest, potentially leading to a bullish breakout.
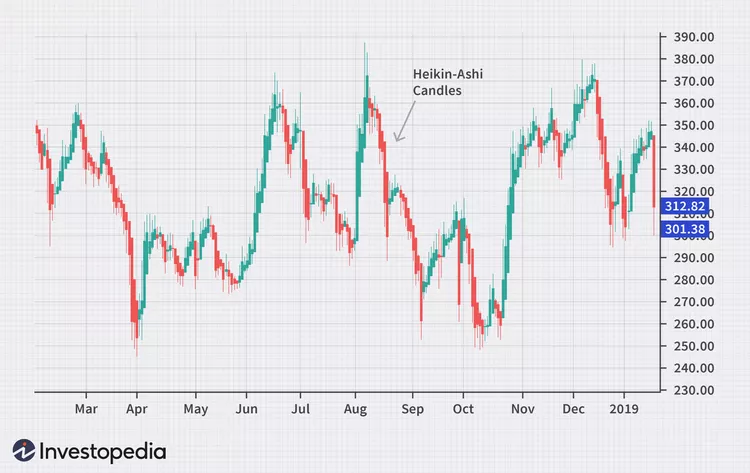
Heikin-Ashi chart
Heikin-Ashi bars modify the appearance of traditional candlesticks by smoothing out price action and focusing on the open-close relationship. These charts can help identify the underlying trend within the megaphone pattern by filtering out some of the noise from short-term price fluctuations.
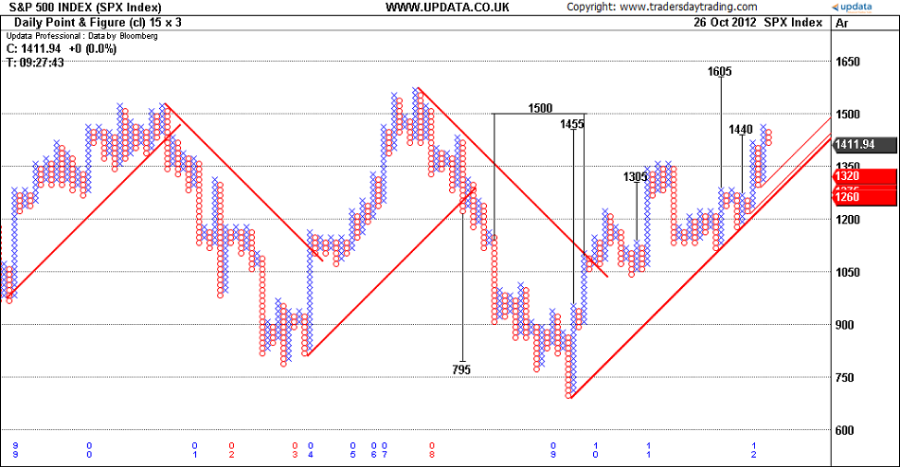
Point & figure (P&F) chart
P&F charts eliminate time, focusing solely on price movements that meet predetermined box sizes. This creates an abstract view of price action. P&F charts can help identify the megaphone pattern's overall structure, particularly the price range expansion. They can also help visualize potential support and resistance levels based on the P&F box size.
Indicators
The following indicators help in identifying the megaphone pattern in forex –
Volume at price (VAP)
The VAP indicator displays the volume traded at each price level. This provides a detailed picture of trading pressure at different points within the megaphone. VAP charts can pinpoint potential breakout zones. Look for clusters of high volume at the support or resistance trendlines. This signifies concentrated trading pressure that could lead to a breakout in that direction.
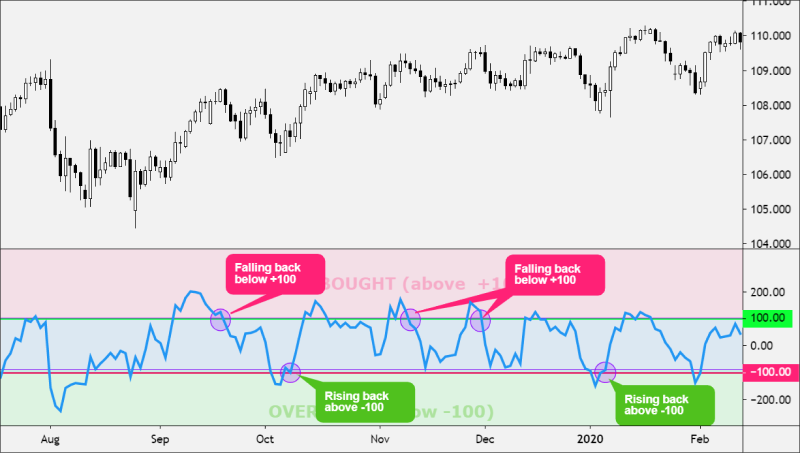
Commodity channel index (CCI)
The CCI is a momentum oscillator that compares the current price to the historical average price range. It can identify overbought or oversold conditions and potential trend reversals. The CCI's movement into extreme positive or negative territory can signal potential breakouts from the megaphone pattern. Look for a return from these extremes accompanied by rising volume for a stronger breakout confirmation.
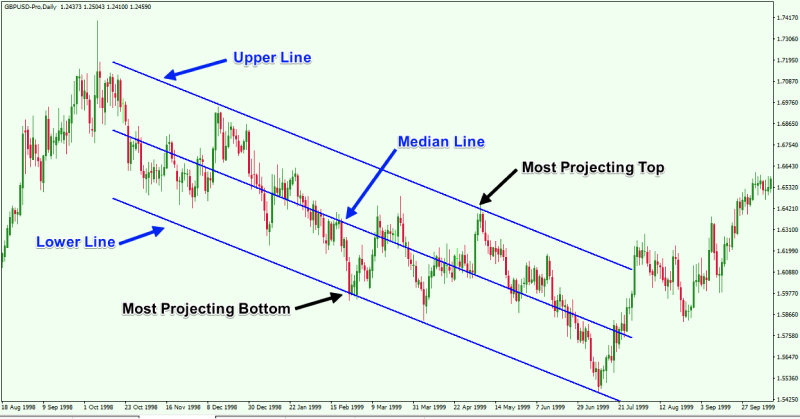
Linear regression channel
The linear regression channel indicator creates a channel based on a linear regression of historical price data. The channel slopes upwards for an uptrend, downwards for a downtrend, and flat for a sideways trend.
In a megaphone pattern, the linear regression channel will widen as price action deviates from the initially established trend. This widening channel confirms the expansion in price range characteristic of megaphone. Price touches at the upper or lower channel boundaries also can signal potential breakouts, especially if accompanied by rising volume.
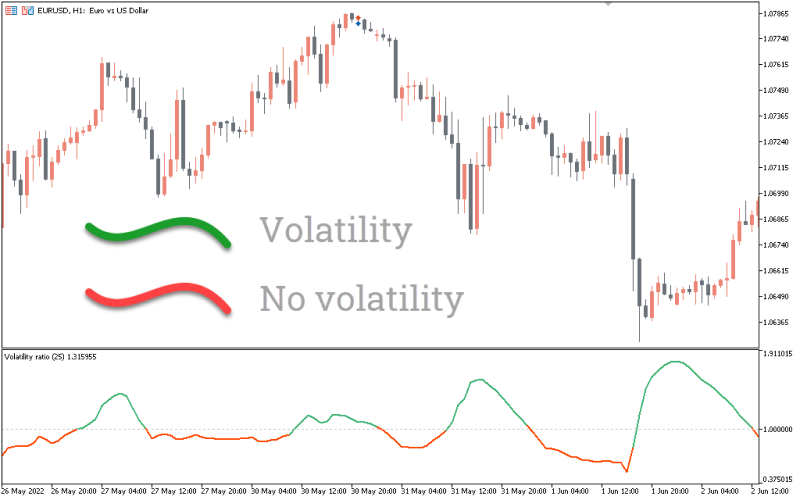
Volatility ratio (VR) with moving average
The VR compares the current volume to the average volume over a specific period, while the moving average smooths out the VR fluctuations.
By incorporating a moving average, this variation of VR can help identify sustained increases in volume. Look for a surge in VR on the moving average preceding a breakout towards the upper or lower trendline of the megaphone pattern, suggesting a stronger directional move with conviction from traders.
Interpreting megaphone patterns
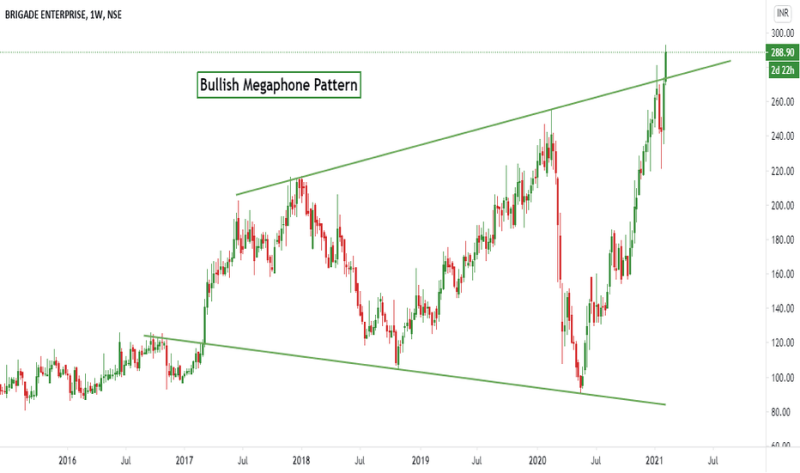
How to identify the bullish megaphone pattern?
- Preceding trend: Look for a preceding uptrend before the megaphone formation. This suggests a potential continuation of the uptrend after a period of consolidation.
- Price action: The price action oscillates between the diverging trendlines, creating a series of higher highs and higher lows (although not necessarily every swing will be higher).
- Volume: As the price approaches the upper trendline, the volume should increase compared to the lower part of the pattern. This signifies long pressure accumulating for a potential breakout.
- Breakout: A bullish breakout occurs when the price closes decisively above the upper trendline, ideally accompanied by a surge in volume. This suggests a continuation of the uptrend with increased momentum.
How to identify the bearish megaphone patterns?
- Preceding trend: Look for a preceding downtrend before the megaphone formation. This suggests a potential continuation of the downtrend after a period of consolidation.
- Price action: The price action oscillates between the diverging trendlines, creating a series of lower lows and lower highs (although not necessarily every swing will be lower).
- Volume: As the price approaches the lower trendline, the volume should increase compared to the upper part of the pattern. This signifies short pressure accumulating for a potential breakout.
- Breakout: A bearish breakout occurs when the price closes decisively below the lower trendline, ideally accompanied by a surge in volume. This suggests a continuation of the downtrend with increased momentum.
Impact of external factors on megaphone pattern in forex
- Changes in risk appetite: Investors' overall risk appetite can influence forex market movements and megaphone patterns. During periods of increased risk aversion, investors might flock to less risky currencies, which leads to a bullish breakout from a megaphone pattern and vice versa.
- Credit rating downgrades: A country's credit rating downgrade by major rating agencies can signify a decline in its creditworthiness and economic outlook. This can weaken its currency and potentially trigger a bearish breakout from a megaphone pattern, even if the pattern initially suggested a potential upside move.
- Global Liquidity Conditions: Changes in global liquidity conditions, often influenced by major central banks' quantitative easing or tightening measures, can impact forex market volatility and megaphone patterns both negatively and positively.
Trading strategies using megaphone patterns
Channel trading strategy
The strategy treats the megaphone pattern as a temporary expansion of a price channel. Traders aim to long near the support trendline and short near the resistance trendline, capitalizing on short-term price swings within the pattern. Traders can use trendlines to define the upper and lower boundaries of the megaphone pattern.
- To enter the market, long (short) near the support (resistance) trendline, ideally with a confirmation signal like a bullish (bearish) candlestick pattern or a bounce (rejection) off the trendline
- To exit the market, short (long) near the resistance (support) trendline or take gains based on a target gain level set above (below) the entry point
- Place a stop-loss order below (above) the support (resistance) trendline during a long (short) order
Mean reversion strategy
The strategy assumes the price will eventually revert towards the middle of the megaphone pattern after deviating towards the edges. Traders go long when the price reaches the support zone and short when it reaches the resistance zone. After identifying trendlines, calculate the average price between the support and resistance to visualize the middle of the pattern.
- For a market entry, enter a long (short) near the support (resistance) trendline, particularly when the price deviates below (above) the average price
- To exit a market, short (long) near the resistance (support) trendline or take gains based on a gain level set at the average price or slightly above (below) it
- For a long (short) order, place a stop-loss order below (above) the support (resistance) trendline or at some distance below (above) the average price level
Swing trading strategy
The strategy focuses on capturing large price swings within the megaphone pattern. Traders identify potential turning points and enter positions accordingly. Traders can use trendlines and price action to identify potential support and resistance zones within the megaphone. Look for swing highs and lows near these zones.
- To enter the market long (short) after a bullish (bearish) reversal signal near the support (resistance) zone, such as a double bottom (top) or bullish (bearish) engulfing pattern
- To exit a market, short (long) near the resistance (support) trendline
- For a long (short) order, place a stop-loss order below (above) the swing low (high) or at some distance below (above) the support (resistance) zone
Volume confirmation strategy
The strategy uses volume confirmation to identify strong breakouts from the megaphone pattern. Traders can use trendlines to define the upper and lower boundaries of the megaphone pattern and monitor volume levels throughout the pattern formation.
- To enter a market, wait for a decisive break above (below) the resistance (support) trendline accompanied by a surge in volume, suggesting strong long (short) pressure
- To exit a long (short) position, place an order when volume starts to decline (increase) after the breakout. This suggests weakening long (short) pressure and a potential downtrend (uptrend) reversal
- For a long (short) order, place a stop-loss order below (above) the resistance (support). This limits potential losses if the breakout fails and the price falls back within the megaphone pattern
Common risks with the megaphone pattern and how to avoid them
Whipsaws
The megaphone pattern's wide swings can lead to volatile price movements, resulting in whipsaws that can quickly reverse gains. Place stop losses strategically just outside the pattern boundaries to limit losses during sudden reversals.
Lack of clear directional bias
The alternating higher highs and lower lows within the megaphone pattern can sometimes obscure the overall directional bias, leading to indecision. Analyze the pattern on multiple time frames to gain a clearer perspective of the overall trend and directional bias.
False breakouts
The price might briefly touch or even slightly exceed a trendline without a significant increase in volume, leading to a false breakout. This can trick traders into entering a position that quickly reverses, resulting in losses. Use volume analysis to identify breakouts accompanied by a surge in volume. This suggests strong trading pressure, increasing the likelihood of a genuine breakout.
Psychological factors
Emotional trading, such as fear of missing out (FOMO) or reluctance to cut losses, can affect decision-making when trading the megaphone pattern. Stick to pre-defined trading rules and avoid deviating from the trading plan based on emotions.
Extended pattern formation
Megaphone patterns can take a long time to develop, and the price might oscillate within the trendlines for an extended period. This can lead to frustration and impatience, potentially causing traders to make impulsive decisions. Wait for a clear breakout confirmation with supporting volume and potentially other technical indicators and avoid chasing premature trades.
Trade forex in high-volatility markets with the megaphone pattern
With higher highs and lower lows, traders can identify potential trend continuations and reversals with the megaphone pattern. Some tips traders should follow while trading the megaphone pattern are:
- Don't overtrade; maintain discipline and focus on risk management
- Consider incorporating volatility filters into the strategy
- Don't chase losses or revenge trade after a failed breakout
By incorporating these practical tips alongside understanding the core principles of megaphone patterns, traders can identify proper entry and exit points in the forex market when trading these formations.
Disclaimer: All material published on our website is intended for informational purposes only and should not be considered personal advice or recommendation. As margin FX/CFDs are highly leveraged products, your gains and losses are magnified, and you could lose substantially more than your initial deposit. Investing in margin FX/CFDs does not give you any entitlements or rights to the underlying assets (e.g. the right to receive dividend payments). CFDs carry a high risk of investment loss.