


Gold (XAU) has been one of the most liquid assets for centuries now. In the early 1980s to 2000s, even when the interest in the Gold market was not high, it still consolidated about $300 to $500 per ounce.
With time, Gold’s interest grew slowly but steadily, year after year. Finally, it imploded during the Financial Crisis of 2007-2008 then rose to an all-time high of over $1900/ounce in 2011.
Since then, the price of Gold has seen a constant surge and has continuously yielded profits to traders and investors. Thus, making it a safe haven asset. In fact, 90% of the world’s total Gold is used to either make jewelry or is held for investment purposes by traders.
Trading Gold has progressed to the point where you no longer need to own or hold the underlying metal physically. Instead, you can make a profit through the rising and falling prices of Gold. This is possible through the use of CFDs or Contract for Differences.
In a falling XAU/USD market, you can go short to make a profit. On the other hand, you can purchase more assets in a rising market to make profits later as the price continues to rise.
There are endless trading opportunities when it comes to Gold. Let's take a look at the top Gold trading strategies and tips below:
*This is an example only to enhance a consumer's understanding of the strategy being described above and is not to be taken as Blueberry providing personal advice.
Top Gold Trading Strategies
1. Moving average crossover for a short-term trading strategy
A classic strategy for short-term traders is the moving average crossover which helps you profit from the frequent price changes of Gold.
A moving average (MA) is a technical indicator that depicts the smoothening in price trends by filtering out random price fluctuations in a certain period. A moving average crossover takes place when a fast-moving average line crosses a slower one.
When a short-term moving average line crosses over a long-term moving average, it indicates that the market is witnessing an upward trend. Traders take this as a sign to go long on Gold. In case the opposite happens, traders short Gold instead.
It is best suited to figure out moving average crossovers in a 1-hour chart if you are a short-term trader. This is because it allows you to successfully trade the middle of the trend, which in turn, cancels out any noise in the chart.
Let's discuss it with an example:
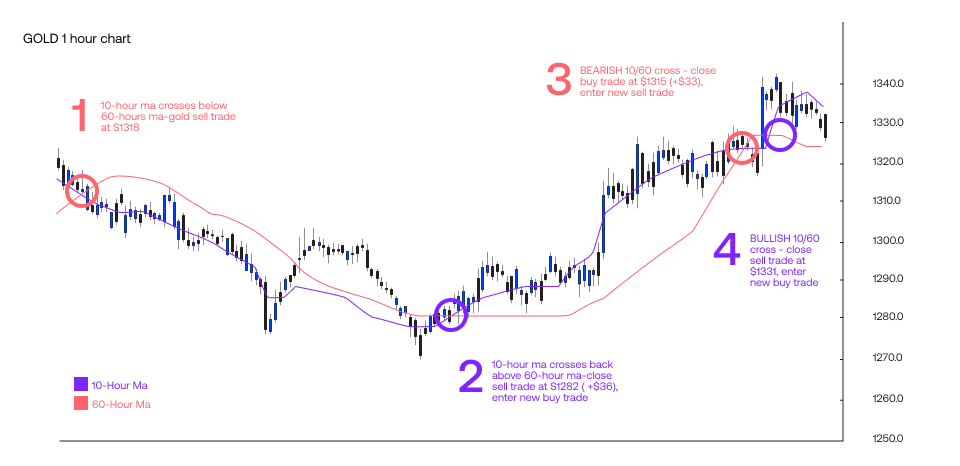
- Point 1 where the short-term 10-hour MA crosses the long-term 60-hour MA. This suggests that a bearish market is forming. The MAs cross again at Point 2 a couple of days later when Gold goes down to around $1,200 per ounce.
- At Point 2, the initial Gold trade is closed for a huge gain. In this situation, you could buy Gold as the trend shifts to the upper end of the chart again.
- Once the price consolidates, Gold rallies up to around $1,300 per ounce. The trade is closed again when you sell the Gold in a bearish MA at this point.
It should be noted that no strategy comes with a full-proof plan of mitigating risks and losses. It can make you lose money as well. In this case, the spike near Point 4 could push some traders to sell at Point 3, resulting in a missed opportunity for a bigger profit.
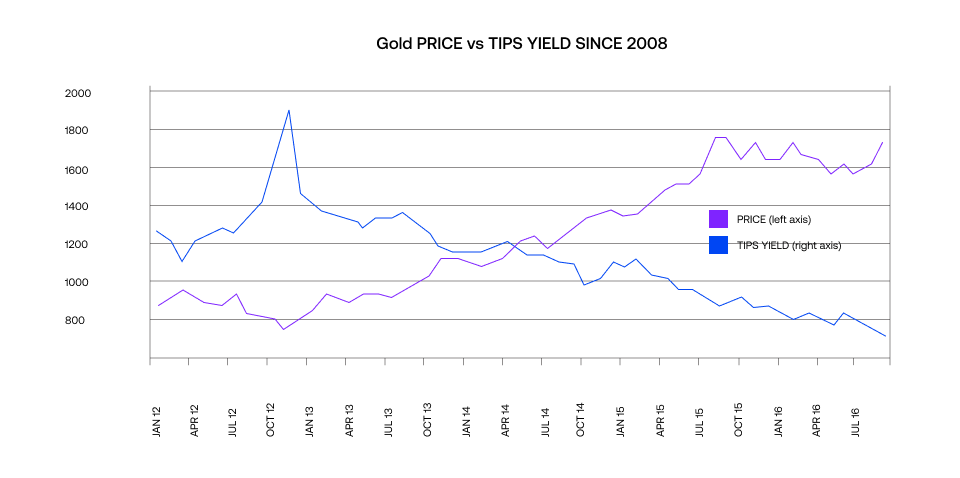
2. Real interest rates for a long-term strategy
If you are a long-term trader, this strategy perfectly suits your trading decisions. The level of real interest rates in Gold trading drives its prices in the long term.
As the rate of Gold returns rise, so do its interest rates. This move eventually results in a bullish market, bringing higher profits for long-term Gold investors and traders.
You can consider buying more Gold if the yields are below 1%, as that has always been a supportive Gold price. A lower than 1% yield depicts that the earnings generated are not that high and there is still scope for it to increase in the future.
However, if the real yields go beyond 2%, selling might be a wise move. This is because the return on Gold investment does not generally go beyond 2% in the short-medium term and it tends to decrease after the 2% level.
3. Fibonacci Retracements
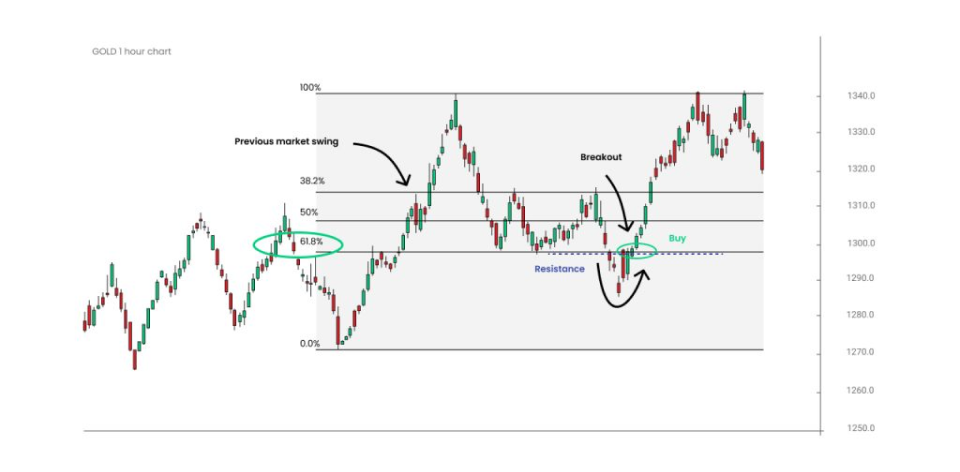
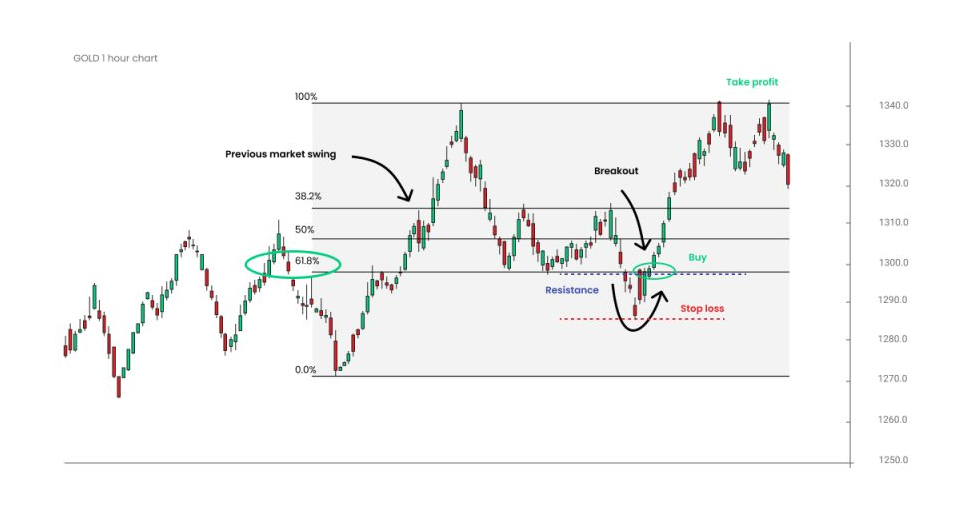
Fibonacci retracements are a technical indicator created by taking extreme price points on a chart with one point at a peak and one at the trough. It is then divided by the vertical distance of Fibonacci ratios such as 23.6%, 38.2%, 50%, 61.8%, and 100%.
Traders who enter XAU/USD use it as it shows the points where you can place an entry order or a stop-loss order for your trade. It can also help you set price targets for Gold when you expect the market to be bullish.
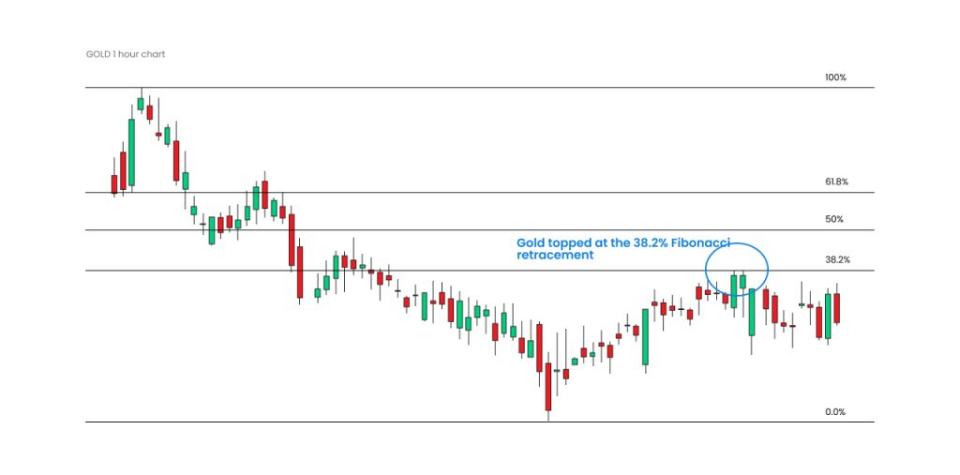
The Fibonacci retracement tool can be used in confluence with seasonal patterns of Gold prices to confirm trend patterns. This means that if the market saw an increase in the past, you can wait for it to retrace back to 61.8% to make a successful trade. 61.8% is considered as the ideal turning point level because the price only moves upwards from that point, allowing you to have better long opportunities.
4. Buying the support level
The support level is the level at which the price stops falling and rallies back up instead. This works as a powerful trading strategy as it gives you the buy and sell points of any asset, including Gold. Buying Gold at the support level means that the prices will only increase after this point.
5. Placing stop-losses below the previous low swing
When trading XAU/USD with a stop-loss strategy, you can place the order below the last low. This way, you can mitigate potential losses should the market decides to dip lower. Further, you only lose the amount you can afford to lose and protect yourself against hefty risks and losses.
Gold-silver ratio strategy
The gold-silver ratio strategy involves trading based on the price relationship between gold and silver. Historically, the ratio reflects how many ounces of silver are needed to purchase one ounce of gold.
When this ratio deviates significantly from historical norms, it presents trading opportunities. For instance, when the ratio is unusually high, it might suggest that gold is overvalued relative to silver, prompting traders to consider shorting gold and shifting to silver and vice versa.
This strategy is favored by those who prefer a cross-commodity approach to trading. It is essential to manage risk by sizing positions appropriately, as the ratio may take time to revert, and separate factors can influence the underlying market dynamics of both metals.
Seasonal trading strategy
The seasonal trading strategy takes advantage of historical patterns in gold prices that repeat at certain times of the year. Over decades, data has shown that gold prices often rise during specific periods, such as early in the year and September, due to increased demand for jewelry during holidays and cultural festivals in key gold-consuming nations like India and China.
Traders can use these seasonal trends to plan their trades, entering long positions in anticipation of price increases during these times.
To implement this strategy, traders should combine seasonal insights with technical indicators like moving averages and momentum oscillators for better timing. It’s also important to monitor macroeconomic factors that could disrupt these typical patterns.
News trading strategy
The news trading strategy capitalizes on the volatility that follows significant economic and geopolitical news releases. Gold, often viewed as a less risky asset, reacts strongly to global economic indicators and geopolitical events.
Key economic data, such as the US Federal Reserve interest rate decisions, inflation reports, and employment statistics, can heavily influence gold prices. Gold strengthens when the market anticipates or reacts to negative economic news as investors shift to the asset.
Conversely, positive economic data can lead to a decline in gold prices as risk appetite grows and investors move towards higher-yielding assets. Traders adopting this strategy must stay updated with an economic calendar and be prepared for rapid market movements.
Gold and US Dollar inverse correlation strategy
Gold has an inverse relationship with the USD, meaning that when the Dollar strengthens, gold prices often fall, and vice versa.
Traders can use this correlation to inform their strategies by tracking the US Dollar Index (DXY). When the DXY shows signs of weakening, traders may anticipate an increase in gold prices and consider taking long positions.
Conversely, if the DXY is strengthening, it might be a signal to short gold or close long positions. This strategy works well with technical analysis tools, such as RSI and MACD, to confirm trends.
Gold futures hedging strategy
A hedging strategy using gold futures can be effective for traders or investors who want to protect their positions from adverse price movements. This strategy involves taking an opposing position in the gold futures market to offset potential losses in physical gold or related holdings.
For example, if a trader holds physical gold and is concerned about a potential price decline, they could take a short position in gold futures. This way, if the spot price of gold falls, the gains from the futures position help offset the losses. While this strategy is valuable for risk management, it requires understanding margin requirements and potential roll costs.
Top Gold trading tips for beginners
Here are the top 8 tips for you to make informed and better decisions as you start your Gold trading journey:
1. Focus on small trades
Since you are fairly new to trading XAU/USD, it is best to keep the size of your trades small. You should focus on trades that could give you decent profit and protect yourself from big losses. However, if you are aiming for a long-term investment, you can choose to extend the position size.
2. Pay attention to Gold charts
Gold price charts witness cycles and turning points that tell you a lot about the current Gold market. When a market is cyclical in nature, cycles are a great help for both short and long-term trades. It also helps in understanding the future position of the market, which can affect your buy and sell decisions altogether.
3. Combine the strategies together
As we have discussed the major Gold trading strategies above, it is best to use them in confluence. When you combine a few strategies together and put them to use accordingly, they give you better and more accurate results. A strategy on its own is not enough for you to survive in the market in the long run.
4. Use trendlines
Trendlines are useful tools to predict the price movement in the future by connecting price points. The two types of trendlines are an upward and a downtrend. Trendlines are often used to predict patterns as they extend in the long run and serve as support for an uptrend or resistance for a downtrend.
5. Use previous highs and lows as support and resistance levels
The support level is the point at which the price stops falling and start rising. On the other hand, the resistance level is the point at which the price stops rising and dips instead. The strength of either the resistance level or the support level is also the strength of the same levels created as an increasing or decreasing trendline. The more significant the low or high is, the stronger the support or resistance level is.
6. Pay attention to the volumes
Paying attention to trade volumes is extremely important especially in the XAU/USD market. If a rally is followed by a rising volume of Gold, it is likely to extend the rally even more.
Alternatively, a decline accompanied by a rising volume suggests that the decline will continue. However, when a lower volume accompanies the decline, the implications stand invalid and should not be taken into consideration while making trading decisions.
7. Don’t make hasty decisions
It is best advised to wait for market breakdown confirmations before you take any actions. When the closing price is below or above the critical price level before the breakdown happens, the breakdown is confirmed. When a breakout is invalidated, it means that the market is still bearish. Meanwhile, when a breakdown is invalidated, the market is bullish.
8. Analyze other markets
The world economy is highly interlinked. With globalization and transportation becoming seamless over the years, no market is independent. Gold and other precious metal industries move hand in hand. Their price movements are mostly linked to movements in the stock market, Forex market, and more. Hence, it is important that you check other markets that may influence the Gold market before making any huge decisions.
An example is if Gold prices move in the exact opposite to the US Dollar Index (USDX) while you consider opening a long position. If you see the USDX close on a resistance level, being overbought, it is most likely that the currency will trigger a dip. In such a situation, you should sell your Gold as soon as possible to avoid any losses.
Pros and cons of gold trading
Pros
- Diversification: Adding gold to an investment portfolio can help spread risk across different asset classes
- Liquidity: Gold is easily traded, providing access to capital when needed.
- Inflation hedge: While not a perfect hedge, gold can offer some protection against the eroding effects of inflation.
- Universal value recognition: gold’s intrinsic value is accepted globally, making it a reliable investment across regions.
Cons
- No yield: Unlike income-generating investments like stocks or bonds, gold does not provide dividends or interest payments.
- Volatility: gold prices can fluctuate significantly in the short term, influenced by various economic and geopolitical factors.
- Opportunity cost: Investing in gold means potentially missing out on higher returns from other asset classes.
- Limited upside: Historically, gold has not consistently outperformed other investments over the long term.
Ideal indicators for gold trading
Commodity Channel Index (CCI)
The CCI is another momentum-based indicator that helps traders identify cyclical trends in gold trading. A CCI above +100 indicates overbought conditions and potential price reversals, while a reading below -100 signals oversold conditions, suggesting an upward price correction. The CCI is effective when combined with other indicators, such as moving averages, to confirm trends or reversal points.
Volume indicators
Volume indicators, such as On-Balance Volume (OBV) and Volume Weighted Average Price (VWAP), provide insights into the strength of a price trend in gold trading.
For example, a price increase accompanied by high volume can indicate strong long pressure, confirming the uptrend. Conversely, low volume during price movements can signal a lack of commitment from traders, suggesting potential trend weakness.
Bollinger Bands
Bollinger Bands help measure market volatility and indicate potential overbought and oversold conditions.
Gold often trades within these bands, with the upper and lower bands acting as resistance and support. When gold prices touch the upper band, it can signal overbought conditions, while the lower band suggests oversold conditions.
This can help traders anticipate pullbacks or rebounds, especially during sideways markets. In trending markets, a breakout beyond the bands often signals the start of a stronger trend.
ADX (Average Directional Index)
The ADX measures the strength of a trend, regardless of its direction, on a scale from 0 to 100. In gold trading, an ADX reading above 25 often suggests a strong trend, while a reading below 25 indicates a weak or sideways market.
Using ADX alongside other indicators, like RSI or MACD, can help traders confirm the strength of a bullish or bearish movement in gold. This can prevent premature trades by ensuring the trend is strong enough to warrant an entry.
Start trading Gold today
The XAU/USD market is one of the most popular markets for traders and investors alike. It is widely considered a safe investment asset in the long run and it can also help you profit through short-term trades.
At Blueberry, we make it easy for you to start trading Gold. Gold is traded against the US Dollar using only CFDs, which means you don’t need to purchase real Gold to start trading it. As a regulated broker, we can help you trade in MT4 and MT5 platforms safely. There are even demo accounts available for you to practice before you go in with real money.
Disclaimer: All material published on our website is intended for informational purposes only and should not be considered personal advice or recommendation. As margin FX/CFDs are highly leveraged products, your gains and losses are magnified, and you could lose substantially more than your initial deposit. Investing in margin FX/CFDs does not give you any entitlements or rights to the underlying assets (e.g. the right to receive dividend payments). CFDs carry a high risk of investment loss.