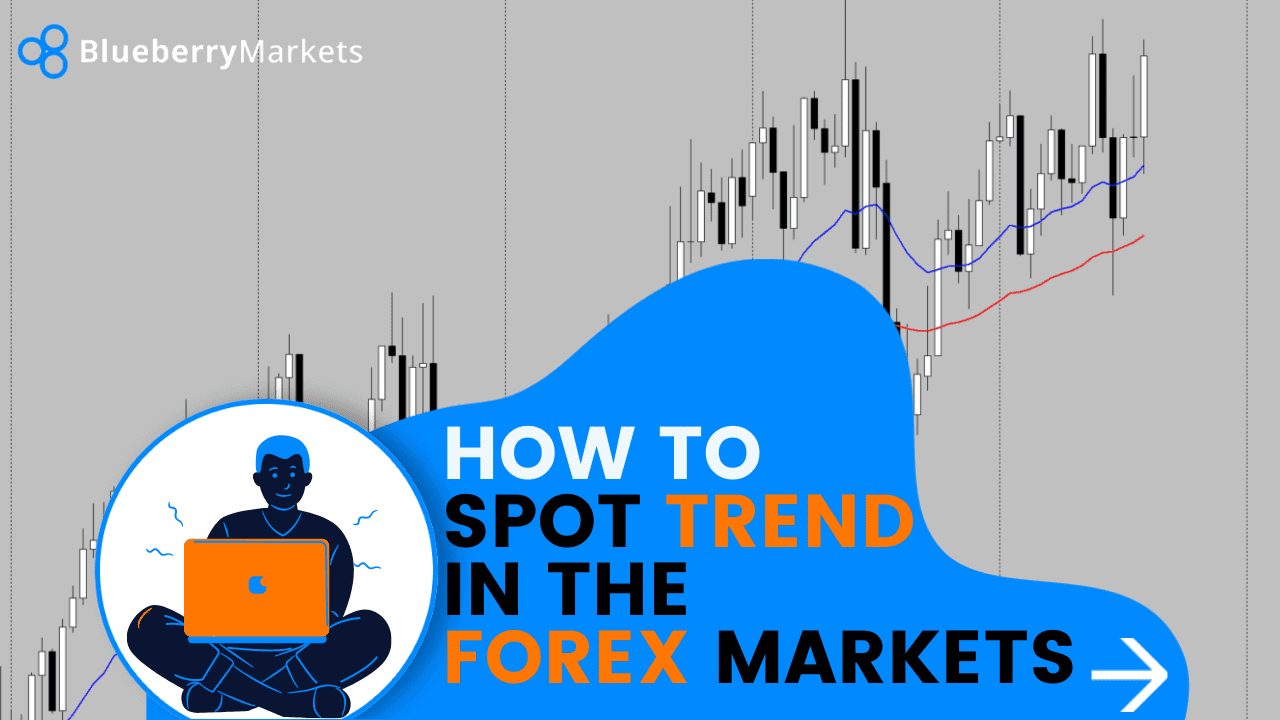
Do you find it difficult to read price action?
Sometimes the markets provide false breakout making it difficult to identify the trend.
In this video, we show you one way to be able to identify the trend of a market.
Watch the video to find out more...
Hi, and welcome to this Blueberry Markets video update with me, John Kibbler, Head Currency Analyst.
In this video, I'm going to show you how you can spot a trend without using the price action. Typically, how I like to view trends is by looking at their highs and lows. If the market starts to make higher highs, as we do get here, the market is in an uptrend. If the market starts making lower lows, then we look for the downtrend. But some people find it hard to identify the highs and the lows in the market, and that's absolutely fine. One way we can get around that is by adding a couple of indicators to our chart.
So if I go to insert indicators on the trend – we have all these indicators to pick from – now my two favorites are the moving averages [simple and exponential].
If I go into the moving average set up, I'm actually going to choose a 20-period moving average. The method is going to be exponential and we're going to apply that to the close. I'll make that a blue color, so we can see clearly on our charts that there's the 20 moving average. And I'm going back to the moving average, which usually appears back in here. But just in case it doesn't go back to indicators trend moving average, this time I'm going to choose a 50 EMA, and I'm going to make this red here. Click okay, and you'll see the 50 EMA on the screen, there. Now typically, when the 20 EMA – which is the blue line – is above the 50 EMA, the market is in an uptrend. So this is a quick way of identifying that uptrend scenario.
Now, if I go back on the charts now and I just drag back, we can see that the market is in an uptrend, continues to remain in an uptrend, and it starts down through here. If we actually look at the price action as well at this point, we can see that the market makes a lower low, here. So the market is saying that it's in a downtrend mode because we have the blue 20 EMA below the 50 EMA and they're starting to come together, which is usually a sign of consolidation. What happens here is the market breaks out and forms a new high. What happens at that point is that the 20 EMA crosses the 50 EMA in an upward direction, we then get this nice upward move, and the market trends higher ever since.
Let's go to the downtrend scenario, through here. So, the market crosses over from a bullish mode. You can see the average is getting nice and tight, crosses over, then we get the 20 EMA below the 50 EMA. The market makes a lower low and we continue to do that until the two averages cross over.
So, that is a quick and simple way to identify a trend in the Forex Markets, this works very much the same on lower timeframes too.
So if you were looking at your daily timeframe or the four-hour timeframe for your direction and you were saying to yourself: “Well, I want to be bullish if the 20 and the 50 is bullish.” So in that bullish mode 20 above the 50, I want to be a buyer on my hourly chart. When the 20 and the 50 cross over and continue that trend to the upside or look for 20 moving average bounces, as long as that four-hour trend continues. You have lots of different trading opportunities, through here, when the market bounces from the averages.
One quick way to identify trends is by using moving averages.
Disclaimer: All material published on our website is intended for informational purposes only and should not be considered personal advice or recommendation. As margin FX/CFDs are highly leveraged products, your gains and losses are magnified, and you could lose substantially more than your initial deposit. Investing in margin FX/CFDs does not give you any entitlements or rights to the underlying assets (e.g. the right to receive dividend payments). CFDs carry a high risk of investment loss.


