


Learning from trading mistakes with technical analysis is vital for improving decision-making, enhancing strategy effectiveness, and avoiding emotional pitfalls. Technical analysis provides an objective framework to analyze past errors, enabling traders to refine their approaches, fine-tune risk management, and identify patterns in their mistakes.
In this article, we will discuss how traders can learn from their trading mistakes and utilize technical analysis indicators.
What are the top types of trading mistakes?
Emotional trading
Allowing emotions like fear or greed to drive decisions can lead to impulsive actions. Emotional trading often results in irrational choices, causing traders to deviate from their strategy and make poor investment decisions.
Overtrading
Excessive trading beyond one's risk tolerance or financial capacity is known as overtrading. It can deplete capital and increase transaction costs. Overtraders often react impulsively to market movements rather than sticking to a well-defined plan.
Chasing the market
Chasing the market involves entering trades late, often after a significant price movement. Traders succumb to the fear of missing out (FOMO) and enter positions at less favorable prices, increasing the risk of losses if the trend reverses.
Herd mentality
Following the crowd without conducting an independent analysis is a common mistake. Herd mentality can lead to buying or selling based on popular opinion rather than market fundamentals. This behavior often results in crowded trades and increased vulnerability to market shifts.
High leverage misuse
Using excessive leverage can amplify both gains and losses. Traders who over-leverage their positions may face margin calls or significant losses, especially in the highly volatile forex market.
Chasing interest rates
While interest rate differentials can impact currency values, blindly chasing higher interest rates without considering other factors can lead to suboptimal trading decisions. A broader analysis is necessary to gauge overall market conditions.
Failure to diversify
Putting all funds into a single currency pair exposes traders to concentrated risk. Diversification across multiple currency pairs can help spread risk and provide a more balanced trading portfolio.
Top technical analysis indicators that minimize trading mistakes
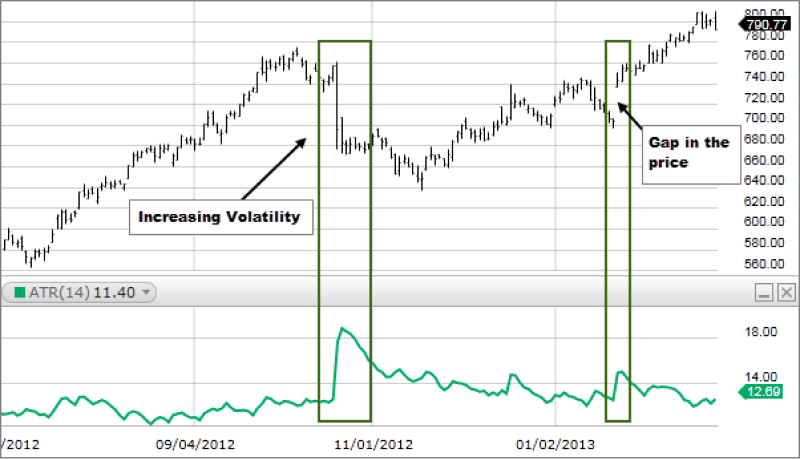
ATR (Average True Range)
ATR is a technical analysis indicator that measures market volatility by calculating the average range between high and low prices over a specified period. By considering volatility, traders can set appropriate stop-loss levels relative to current market conditions, helping to prevent overexposure during highly volatile periods. It minimizes the mistake of inadequate risk management, ensuring that stop-loss orders are dynamically adjusted based on the prevailing market volatility.
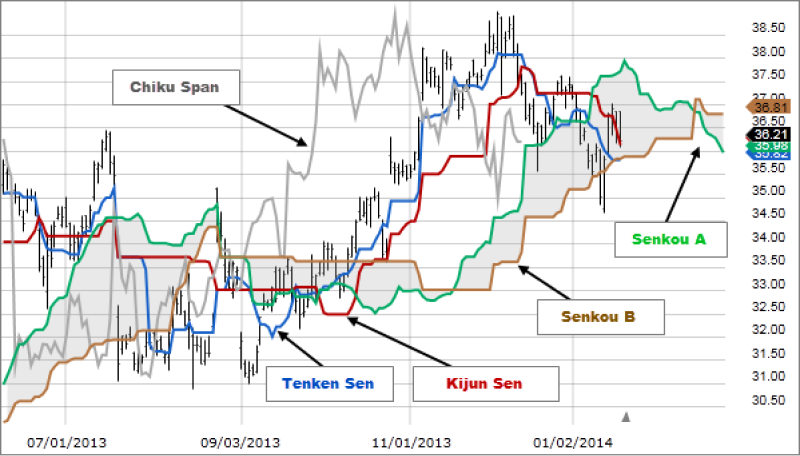
Ichimoku Cloud
The Ichimoku Cloud is a comprehensive technical indicator that visually represents support, resistance, and trend direction. Offering a holistic view of the market, it assists traders in identifying trends and potential reversal points. It minimizes the mistake of chasing the market or misinterpreting the overall direction of the market, as traders can make more informed decisions based on a broader analysis of key price levels.
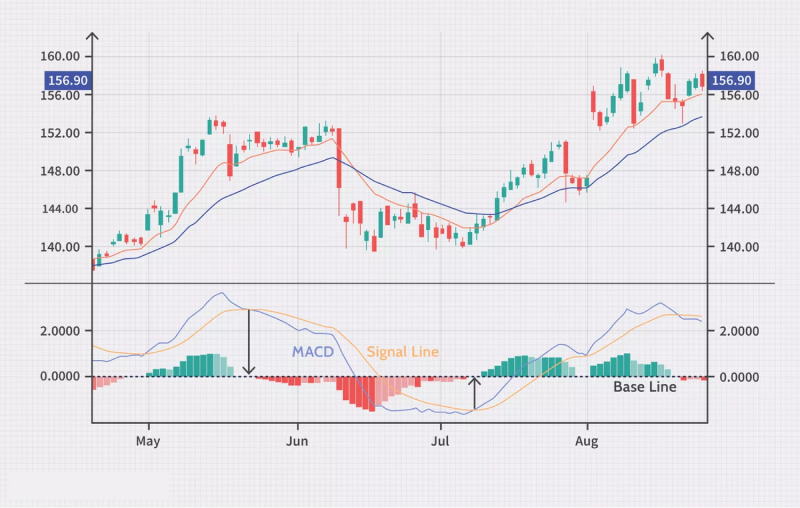
MACD (Moving Average Convergence Divergence)
MACD is a momentum and trend-following indicator that helps traders identify potential trend reversals and confirm trend strength. By offering insights into market momentum, MACD reduces the likelihood of impulsive trading decisions and minimizes mistakes associated with misreading market direction. Traders can make more informed decisions about the strength and sustainability of prevailing trends.
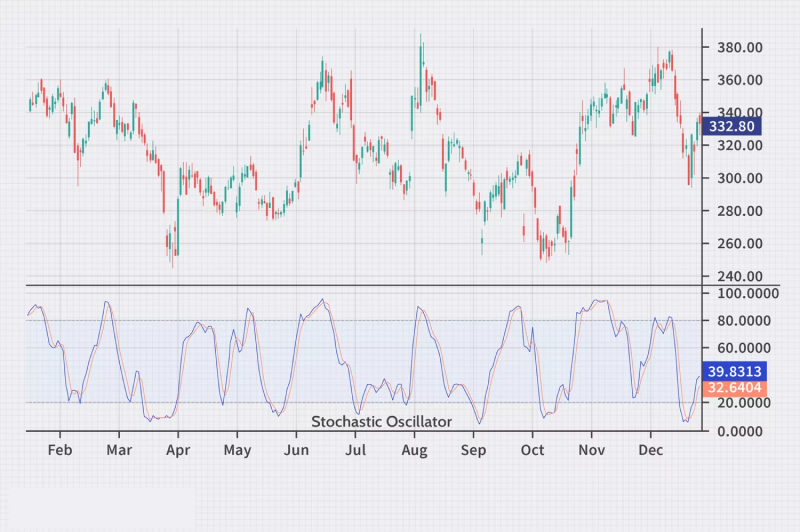
Stochastic Oscillator
The Stochastic Oscillator measures the relative position of a closing price within a specified price range. This indicator helps identify overbought or oversold conditions in the market. By recognizing extreme levels, traders can avoid entering trades at unfavorable points due to emotional reactions. Stochastic Oscillator promotes disciplined trading by signaling potential reversal points based on market conditions.
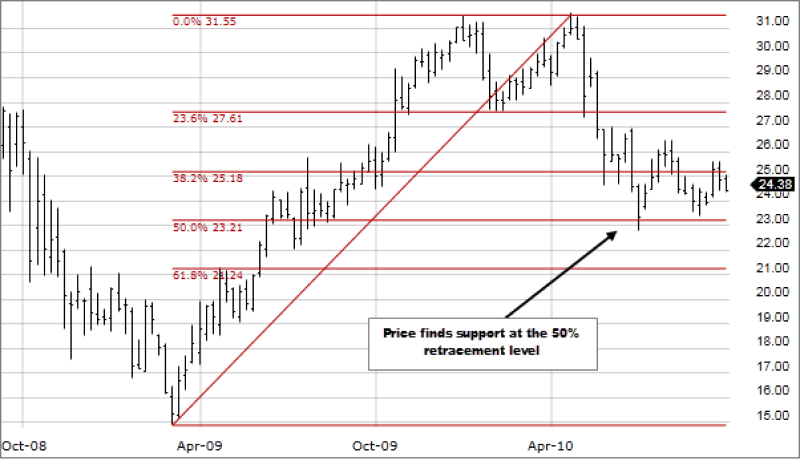
Fibonacci retracements are a technical analysis indicator identifying potential reversal levels based on key Fibonacci ratios. With these retracement levels, traders can set gain targets and identify entry points more precisely. It minimizes mistakes related to impatience and chasing the market without proper consideration of key price levels, promoting a more strategic and disciplined approach to trading.
Volume Analysis
Volume analysis tools such as the Chaikin Money Flow examine trading volume to gauge market strength and confirm price trends. By analyzing the relationship between price movements and volume, traders can identify potential trend reversals and confirm the strength of existing trends. It minimizes mistakes associated with neglecting critical market information, ensuring that traders have a more complete understanding of the market dynamics.
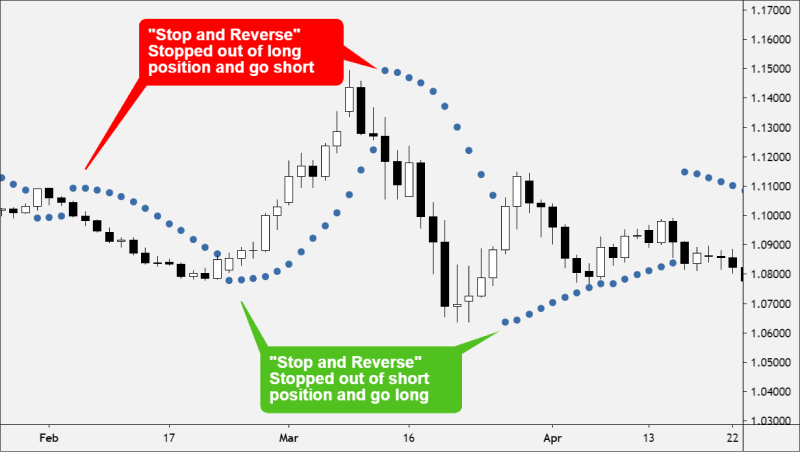
Parabolic SAR (Stop and Reverse)
Parabolic SAR is a trend-following indicator that provides signals for entry and exit points. Offering clear signals helps traders stay on trend until signs of reversal emerge. It minimizes mistakes associated with premature exits, allowing traders to ride trends for longer periods and reinforcing a disciplined and systematic approach to trading.
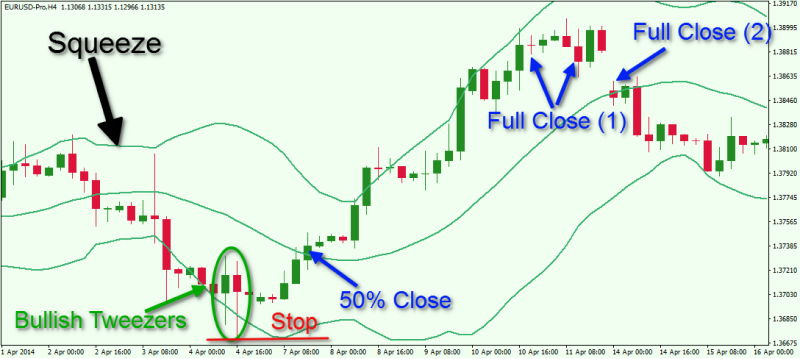
Bollinger Bands
Bollinger Bands are volatility indicators that consist of a moving average and two standard deviation bands. These bands expand and contract based on price volatility. Traders use Bollinger Bands to identify overbought or oversold conditions, helping minimize mistakes in entering or exiting positions at extremes. This indicator visually represents price volatility, aiding in more informed decision-making.
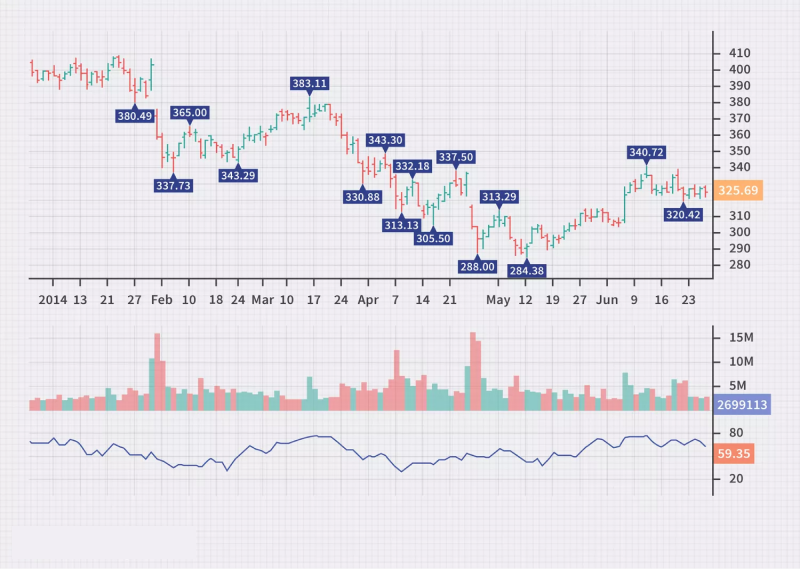
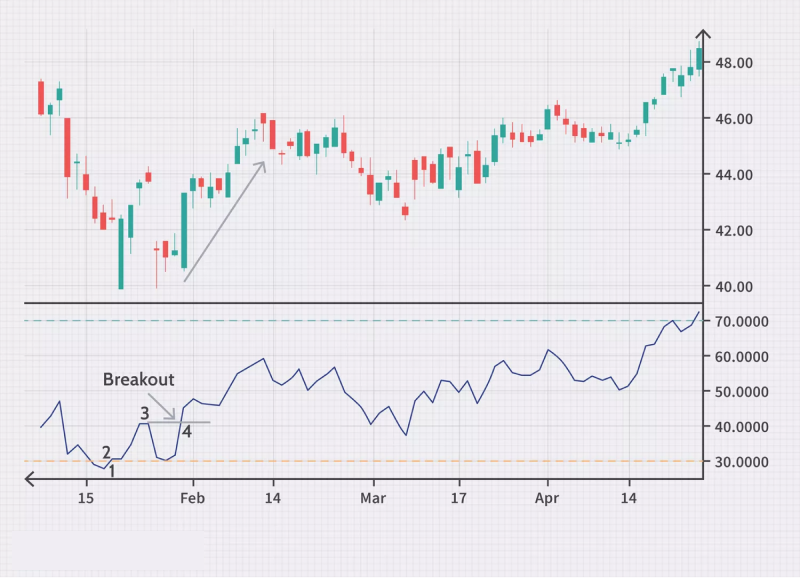
Relative Strength Index (RSI)
The Relative Strength Index is a momentum oscillator that measures the speed and change of price movements. RSI ranges from 0 to 100 and is used to identify overbought or oversold conditions while confirming the strength of a trend and anticipating potential reversals. By incorporating RSI into their analysis, traders minimize mistakes associated with entering trades during unsustainable price movements, promoting a more balanced approach to market dynamics.
Protect trades by identifying inaccuracies
Failing to address trading errors jeopardizes decision-making, exposes traders to emotional decision-making, and hinders strategic effectiveness. Without a systematic approach facilitated by technical analysis, traders may succumb to cognitive biases, compromise risk management, and struggle to adapt to evolving market conditions. In forex trading, continual learning from errors is indispensable for navigating risks and fostering long-term trading.
Disclaimer: All material published on our website is intended for informational purposes only and should not be considered personal advice or recommendation. As margin FX/CFDs are highly leveraged products, your gains and losses are magnified, and you could lose substantially more than your initial deposit. Investing in margin FX/CFDs does not give you any entitlements or rights to the underlying assets (e.g. the right to receive dividend payments). CFDs carry a high risk of investment loss.