


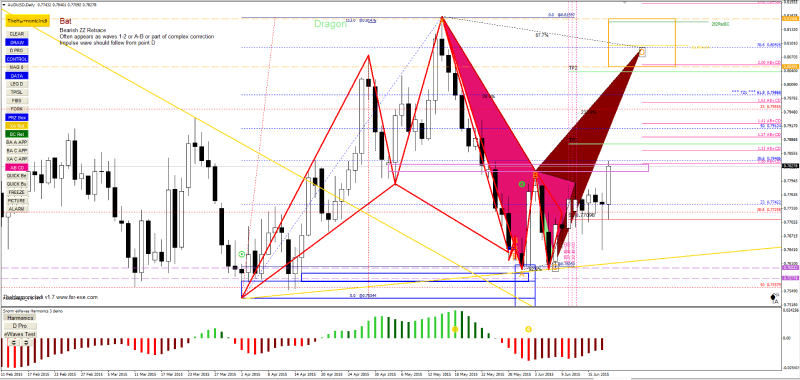
The dragon pattern is a candlestick formation that signals trend reversals and continuations. It also acts as a filter, helping traders identify potential trading opportunities within established trends. By focusing on breakouts after a dragon pattern within a trending market, traders can potentially increase the odds of a trade.
In this comprehensive guide, we will discuss everything about the dragon pattern.
What is a dragon pattern?
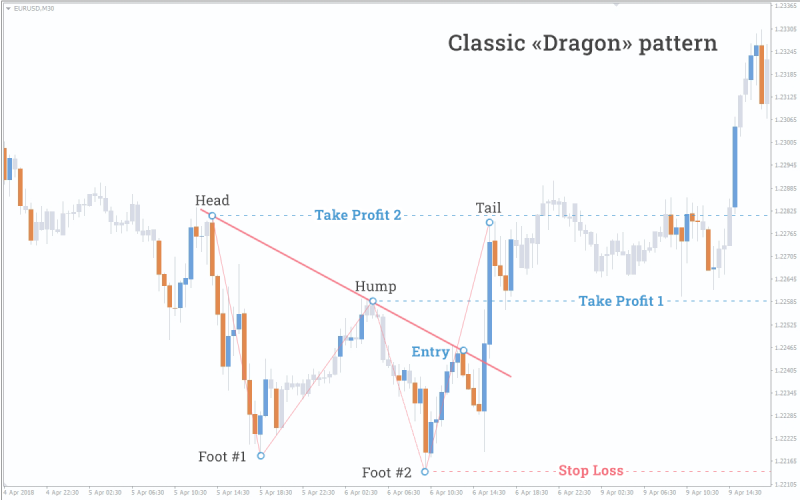
The dragon pattern is a five-point reversal pattern utilized in technical analysis to signal a potential shift in the prevailing trend direction within a currency pair. It is composed of five distinct elements: the head, two feet (left and right), a hump between the feet, and a tail.
- Head formation: The head is formed by a prominent price swing, either a local high (bullish pattern) or a local low (bearish pattern), within the established trend
- Hump and feet: The hump represents a corrective price movement where the price deviates from the initial trend but does not necessarily breach established support or resistance levels. Two price swings, flanking the base of the hump, form the feet of the dragon
- Tail extension: The tail extends lower (bullish pattern) or higher (bearish pattern) than the head, signifying a potential reversal of the prevailing trend
Identifying dragon patterns
Charts
The following charts help in identifying dragon patterns in the forex market –
Candlestick chart
Candlestick charts are the most popular choice for identifying dragon patterns due to their clear visualization of price movements (open, high, low, close) within a specific timeframe. The head of the dragon pattern is identifiable as a prominent candlestick with a high wick (bullish) or low wick (bearish), depending on the pattern direction.
The hump and feet are visible through price retracement within the body of candlesticks, with the feet formed by distinct swings. Additionally, the tail extends beyond the head's high/low, ideally with a clear closing price movement in the opposite direction of the initial trend.

Three line break charts
Three line break charts utilize vertical lines to represent price changes exceeding a predefined threshold. White lines depict rising prices, while black lines represent falling prices. The head of the dragon pattern is visible as a change in line color (white to black for a bearish head, black to white for a bullish head).
The hump and feet are less distinct due to the focus on price direction changes and not specific price points. However, traders can observe a series of black or white lines representing the corrective movement. The tail extension is identifiable when the price direction changes again, ideally surpassing the initial reversal point.
Line charts
A line chart is a basic visual representation of price movements in a financial instrument over a chosen time period. Look for a downtrend followed by a head (high point) and a left foot (low point) on the line.
A corrective hump forms next, not exceeding a certain level. Finally, a smaller "right foot" bump appears before a trendline (neckline) is drawn, connecting the head and hump peak. Remember, the dragon pattern alone is unreliable.
Tick charts
Tick charts don't directly display price movements but rather the volume of trades (ticks) that occur within a specific timeframe. They plot bars with varying widths every time a pre-defined number of trades (ticks) occur, regardless of the time elapsed.
The head of the dragon on this chart is visible as a cluster of bars representing a surge in trading activity at the initial high/low. While the hump and feet might not be very visible, a lower trading activity period suggests a corrective phase along with the tail extension near another cluster of bars surpassing the initial head level.
Indicators
The following indicators help in identifying dragon patterns in forex –
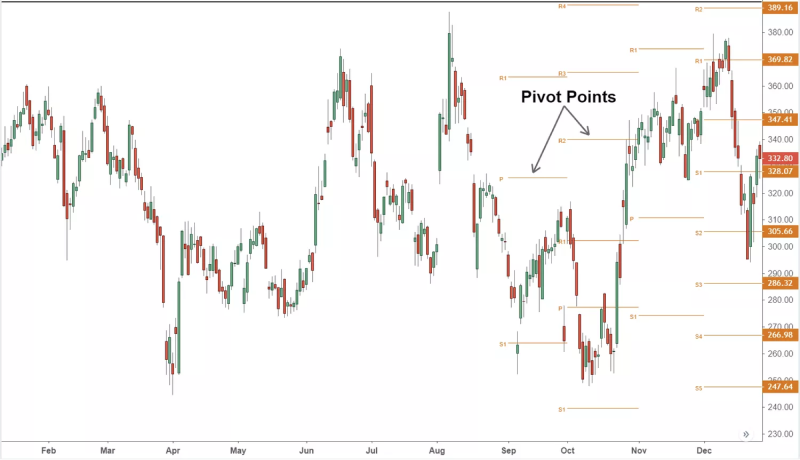
Pivot points
Pivot points are calculated based on the previous day's trading range and can act as potential support and resistance levels. The head of the dragon pattern finds support or resistance near a calculated pivot point, adding some weight to the potential reversal zone. This strengthens the potential reversal zone, but the price can still break out without touching the pivot.
Traders should wait for a bullish (bearish) breakout when the price moves above (below) the resistance (support) level formed by the head and hump.
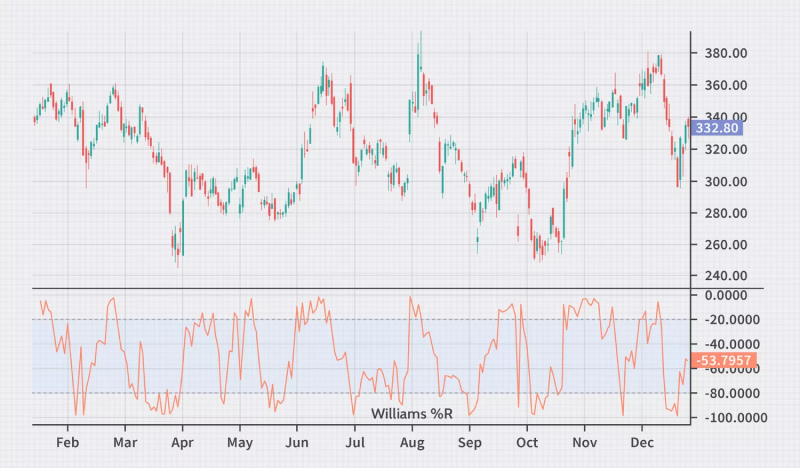
Williams %R
The Williams %R is a momentum oscillator that measures the closing price relative to the trading range of the past n periods (usually 14). It oscillates between 0 and -100, with values below -20 indicating oversold conditions and above -80 indicating overbought conditions and vice versa.
Similar to the CMO, a divergence between the Williams %R and price action potentially foreshadows a trend reversal, aligning with the corrective phase of the dragon pattern. For example, a bullish dragon pattern might see the Williams %R form a higher low while price forms a lower low, suggesting a potential reversal despite the price downtrend and vice versa.
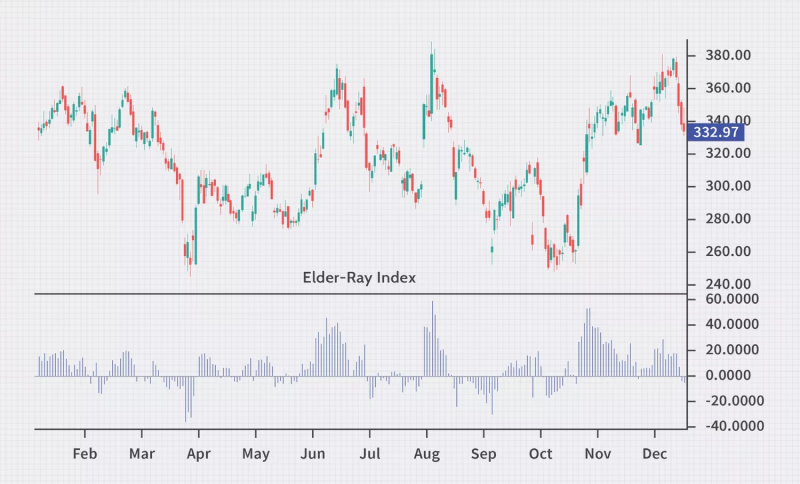
Elder-Ray index
The Elder-Ray indicator assesses market strength through Bull Power (comparison of current high to 13-period EMA of highs) and Bear Power (comparison of current low to 13-period EMA of lows). It aids in confirming dragon patterns by showing bullish or bearish moments.
The divergence between Elder-Ray components and price action, like higher highs and lower lows indicative of a dragon pattern, suggests potential reversals.
Traders can also use the ERI to visually confirm the price swings that form the dragon pattern's head, feet, and tail. Traders can use the Elder-Ray indicator to confirm increasing Bull Power or decreasing Bear Power, aligning with the bullish reversal suggested by the dragon pattern.
Step-by-step guide: How to spot dragon patterns
- Identify initial trend: Start by identifying the prevailing trend. dragons typically form after a prolonged move in one direction
- Look for broadening price swings: Watch for price swings that widen over time, creating higher highs and lower lows
- Spot candlestick formations: Look for specific candlestick formations within the broadening swings, such as long lower shadows and small bodies near highs or lows
- Confirm the pattern: Ensure the pattern meets the criteria of broadening swings with at least two highs and two lows that diverge from each other
- Draw trendlines: Draw trend lines connecting the highs and lows of the pattern to visualize the expanding price range
- Wait for confirmation: Wait for a breakout or breakdown from the pattern's boundaries to identify the direction of the potential trend reversal or continuation to ensure it is a confirmed dragon pattern
Interpreting dragon patterns
Bullish dragon patterns
The bullish dragon pattern resembles a W on the chart, indicating a potential bullish reversal after a downtrend. The components for the same are –
- Head: The initial high point before the price dips
- Feet: Two lows, with the second one slightly lower than the first
- Hump: A small price rise between the feet, but not exceeding a key retracement level (often 38.2% or 50% Fibonacci retracement of the move from the head to the first foot)
- Tail: The price breaks above the neckline connecting the head and the right shoulder (second foot)
The pattern suggests purchasers are regaining control after a decline. The second low (right foot) is lower, which indicates some short pressure, but the inability to break below support and the price rise signals a potential trend reversal.
Bearish dragon patterns
The bearish dragon pattern resembles an M on the chart, indicating a potential bearish reversal after an uptrend. The components are somewhat the same as the bullish dragon pattern. The head is a low point, feet are high with the second slightly higher, and the hump dips below a key retracement level before a price break below the neckline.
The pattern suggests sellers are gaining strength after a rise. The second high (right shoulder) being higher indicates some entry pressure, but the inability to break above resistance and the price dip signal a potential trend reversal.
Trading strategies using dragon patterns
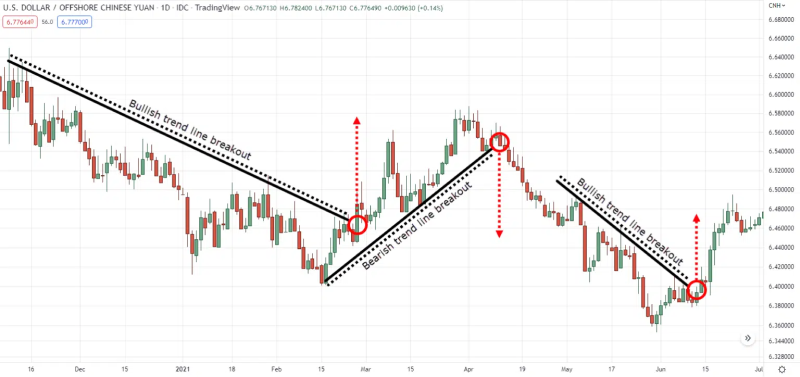
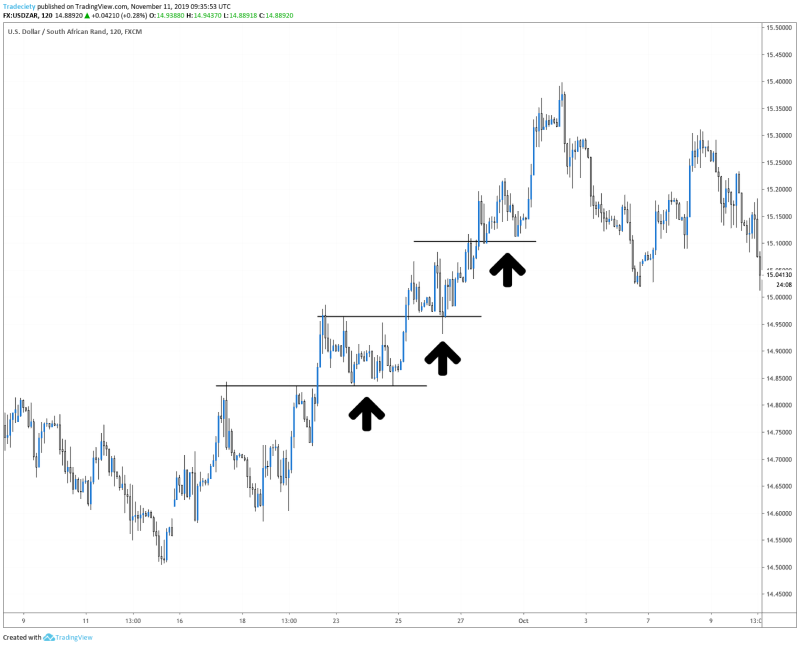
Trendline breakout strategy
The trendline breakout strategy involves identifying and trading when the price of an asset breaks above or below a trendline, indicating a potential change or continuation in trend direction.
Draw a trendline connecting the highs (downtrend) or lows (uptrend) during the prevailing trend leading up to the dragon pattern. Look for a price break above the trendline (bullish dragon) or below (bearish dragon) to signal a potential trend reversal. Trendline breakout following a dragon pattern strengthens the reversal signal. It suggests a confirmed break in the previous trend's momentum.
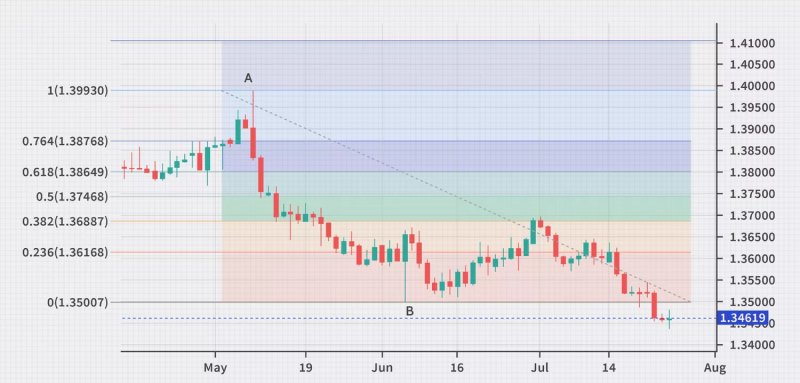
Fibonacci retracement strategy
This strategy uses Fibonacci levels (23.6%, 38.2%, 50%, 61.8%, and 100%) to identify potential support or resistance levels where a price reversal or continuation may occur. Ideally, the hump of the dragon pattern should respect these retracement levels, not exceeding them significantly (especially for the bullish dragon). This indicates trading pressure emerging at these key support/resistance zones.
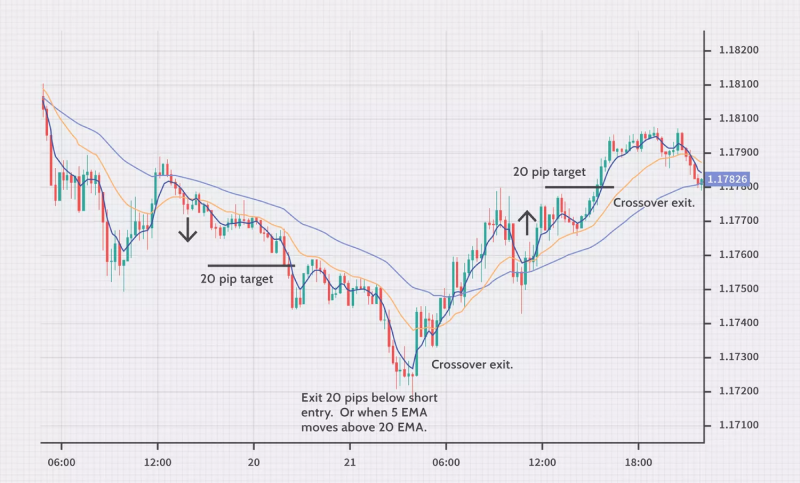
Moving average crossovers
The MA crossover strategy involves using two different moving averages (50-day and 200-day) and trading based on their crossover. Moving average crossovers aligned with the dragon pattern's reversal direction provides further confirmation of a potential trend change.
Look for a bullish crossover (shorter-term average moving above the longer-term average) after a bullish dragon or a bearish crossover (shorter-term average moving below the longer-term average) after a bearish dragon for confirmation.
Pullback entry strategy
The pullback entry strategy involves entering a trade after a brief counter-trend movement (pullback) within an overall trend, aiming to capitalize on the resumption of the dominant trend direction.
After a breakout above the neckline (bullish) or below the neckline (bearish) of the dragon pattern, wait for a slight pullback in price before entering a trade in the direction of the breakout. This pullback can be seen as an opportunity for a better entry price. The pullback strategy can help traders avoid entering a trade immediately after the breakout, which can sometimes be a false signal.
Common risks and how to avoid them
- Unreliable pattern formation: As discussed above, the dragon pattern relies on specific price points. Identifying these points can be subjective, and the pattern might not form perfectly on the chart, leading to misinterpretations. Analyze the dragon pattern on different timeframes (daily, weekly) to see if it appears consistently
- Ignoring market volatility: The dragon pattern might not be effective in highly volatile markets caused by external factors like news events or economic data releases. Erratic price movements can disrupt the pattern's formation. Be aware of major news events or economic data releases scheduled during the time one is analyzing the dragon pattern
- Overfitting: Overfitting occurs when a strategy is optimized to historical data and might not perform well in new market conditions. Rely on statistical measures like win rate, average win/loss ratio, and Sharpe ratio when evaluating the dragon pattern's performance in backtesting and not just historical data
- Lack of risk management: Poor risk management practices can lead to substantial losses. Determine stop-loss based on technical levels and volatility, ensuring it aligns with one's risk tolerance and trade timeframe
Identify confirmed market reversals with the dragon pattern
Forex traders can use the dragon pattern to identify potential trend reversals. It can be combined with other technical indicators to confirm market trends. Look for the dragon pattern forming near trendline breaks and respecting Fibonacci retracement levels for increased confidence. Test the understanding of the dragon pattern and how it interacts with other indicators.
Disclaimer: All material published on our website is intended for informational purposes only and should not be considered personal advice or recommendation. As margin FX/CFDs are highly leveraged products, your gains and losses are magnified, and you could lose substantially more than your initial deposit. Investing in margin FX/CFDs does not give you any entitlements or rights to the underlying assets (e.g. the right to receive dividend payments). CFDs carry a high risk of investment loss.