


The butterfly pattern is a harmonic pattern relying on Fibonacci ratios and specific price movements that combine to form a unique butterfly shape on the chart. The pattern signals exhaustion in a trend, potentially leading to a price swing in the opposite direction.
Let’s discuss how to recognize and use the butterfly pattern for forex trading.
What is a butterfly pattern?
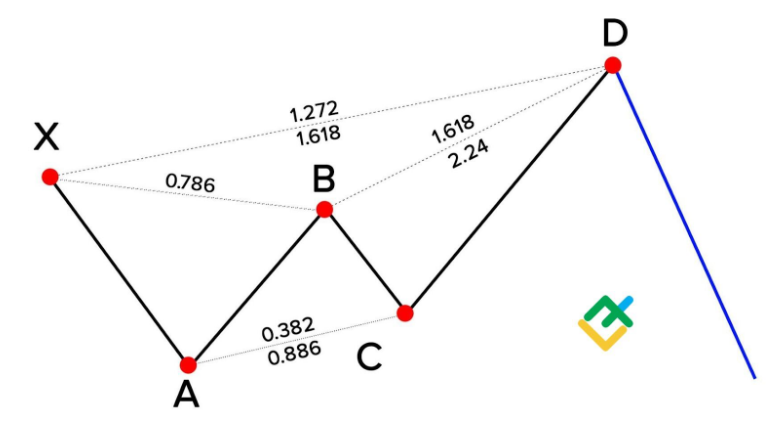
The butterfly patterns are Fibonacci retracement lines that can identify potential trend reversals in the forex market. It is formed by four key points (X, A, B, C, and D) that connect to create a specific geometric structure in the shape of a butterfly. Here's a breakdown of the points:
- XA: This is the initial leg, representing a strong directional move.
- AB: This is a retracement leg, typically following a Fibonacci ratio (often 0.786) of the X-A leg.
- BC: This is a corrective leg, with a variable length but often shorter than A-B.
- CD: This is the final leg, ideally reaching a specific Fibonacci extension zone (often between 1.618 and 2.618) of the B-C leg. This projected zone is the potential reversal area.
The price movements between X-A and C-D form the butterfly wings. Point B acts as the body, with the A-B and B-C legs forming the wings. In a bullish butterfly pattern, the C-D leg extends upwards, potentially signaling a reversal to an uptrend and vice versa for a bearish butterfly pattern.
The butterfly pattern is based on three important characteristics –
Fibonacci ratios: The pattern relies on specific Fibonacci retracements and extensions to validate its structure.
Reversal signal: The completion of the pattern suggests a potential reversal of the prevailing trend.
Two variations: The butterfly pattern comes in two forms: bullish (indicating a potential trend reversal upwards) and bearish (indicating a potential trend reversal downwards).
Identifying butterfly patterns
Take a look at the top charts and indicators that can help identify butterfly patterns.
Charts
Renko charts
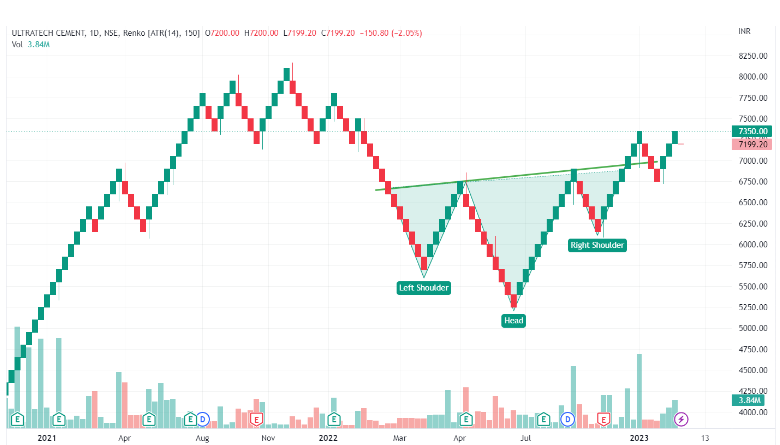
Renko charts are based on price movements reaching a predetermined ‘brick size’ rather than time intervals. This can be beneficial for identifying the specific price swings that form the butterfly pattern, especially in volatile markets. Here's how traders can identify the butterfly pattern:
- Count the bricks: Since Renko charts are based on price movements reaching a specific size, count the number of bricks in each leg (X-A, A-B, B-C, and C-D). The A-B retracement should ideally consist of bricks reaching the 78.6% Fibonacci level when measured against the X-A leg
- Identify pattern formation: Look for the distinct butterfly shape formed by the price swings (represented by the bricks) across the X, A, B, C, and D points
- Confirmation zone: Observe if the C-D leg extends towards the target Fibonacci extension zone (in terms of brick count) based on the B-C leg
Candlestick charts
Candlestick charts clearly represent price movements through open, high, low, and close prices within a specific timeframe. This detailed information is crucial for identifying the distinct highs and lows that form the butterfly pattern. Here's how traders can identify the butterfly pattern -
- Identify the X-A leg: Look for a strong directional move on the chart represented by a series of candlesticks with clear highs and lows. This establishes the initial trend
- Measure the A-B retracement: Once the X-A leg is complete, identify a retracement leg (A-B) that ideally retraces 78.6% of the X-A leg using the Fibonacci retracement tool. This retracement can be confirmed by aligning the Fibonacci tool with the X and A points on the chart
- Focus on reversal signals: Look for a reversal candlestick pattern (e.g., hammer, engulfing bar) at point B, potentially signaling a change in momentum
- Validate with C-D leg: From point B, identify a corrective leg (B-C) with a variable length. Finally, look for the C-D leg extending towards the Fibonacci extension zone (ideally between 1.618 and 2.618) of the B-C leg. This zone is the potential reversal area
Line charts
Line charts offer a simpler visual representation by connecting the closing prices over time. This can help focus solely on the price movements relevant to the butterfly pattern formation. Here's how traders can identify the butterfly pattern -
- Focus on price swings: Line charts simplify the analysis by connecting closing prices. Look for a clear directional move followed by a retracement that reaches the 78.6% Fibonacci level
- Identify potential reversals: Look for a change in the direction of the line at point B, potentially indicating a reversal
- Confirm the extension zone: From point B, observe if the line extends towards the target Fibonacci extension zone (1.618 - 2.618) of the B-C leg
Indicators
Average True Range (ATR)
The ATR is a volatility indicator that measures the average range (difference between the high and low) over a specified period. The ATR can help assess the validity of the Butterfly pattern's retracement and extension lengths. Ideally, the retracement (A-B leg) should not exceed the ATR value calculated using a timeframe similar to the chart the trader is analyzing. It suggests a normal retracement within the established volatility, potentially strengthening the pattern's credibility. Conversely, a retracement significantly exceeding the ATR might indicate excessive volatility, casting doubt on the pattern's validity.
Williams %R
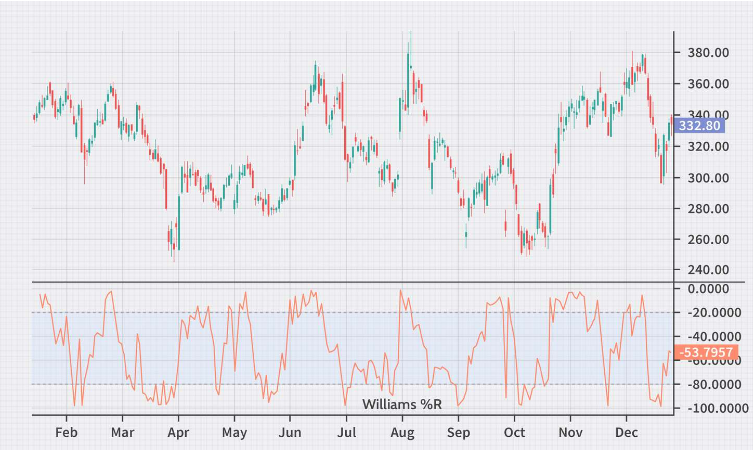
Williams' %R is a momentum oscillator that measures the closing price relative to the trading range of the past n periods (typically 14). It fluctuates between 0% (overbought) and -100% (oversold). The %R can help identify potential reversal points, particularly at point B of the butterfly pattern. A reading near -100% at point B suggests an oversold condition, potentially aligning with the reversal signal of the butterfly pattern. Conversely, a reading closer to 0% at point B might indicate the trend still has momentum, weakening the butterfly pattern's reversal suggestion.
Relative Strength Index (RSI)
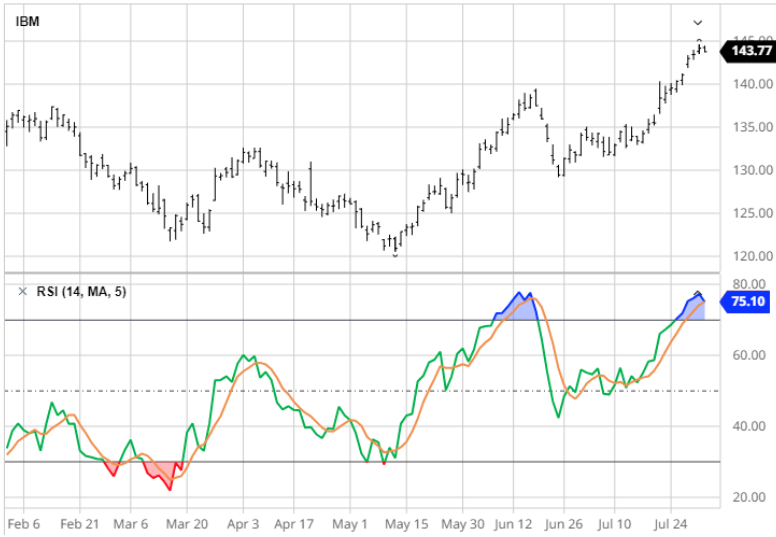
The RSI is a technical indicator used in financial analysis to evaluate the recent price momentum of a security (stock, forex pair, etc.). It measures the speed and magnitude of recent price swings to assess whether a security is overbought (potentially ready for a price decline, indicated by values above 70%) or oversold (potentially prepared for a price increase, indicated by values below 30%). The RSI also identifies potential reversal points at point B of the butterfly pattern.
A reading above 70% at point B suggests an overbought condition, potentially aligning with the reversal signal of the butterfly pattern. Conversely, a reading closer to 30% at point B might indicate the trend still has momentum, weakening the butterfly pattern's reversal suggestion.
Step-by-step guide: How to spot butterfly patterns
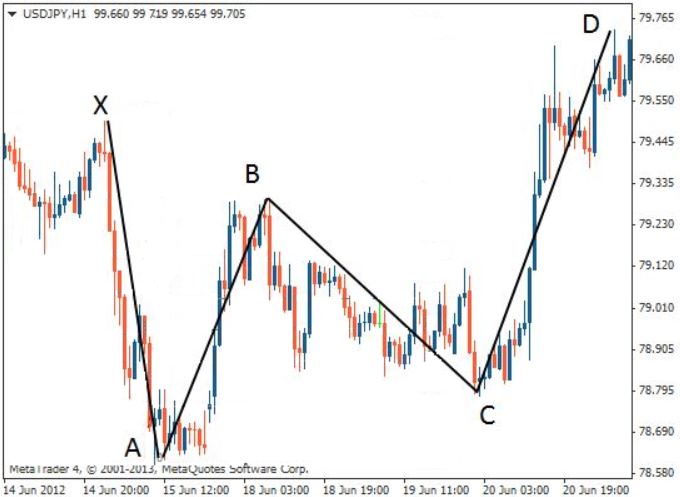
Identify the initial move (XA)
Start by identifying a significant price move labeled as XA, which forms the initial leg of the pattern. A retracement should follow this move.
Measure the retracement (AB)
Measure the retracement of XA to identify point B (AB leg). This retracement should be around 38.2% to 88.6% of the XA leg.
Identify the extension (BC)
Measure the extension of AB to identify point C (BC leg). Point C should ideally reach the 1.618 Fibonacci extension of AB. This extension level confirms the potential butterfly pattern.
Measure the final move (CD)
Measure the final move from point C to point D (CD leg). The length of the CD should be 78.6% of the XA leg.
Confirm the Fibonacci ratios
Ensure that the AB leg retraces between 38.2% and 88.6% of XA. Confirm that the BC leg extends to 1.618 Fibonacci extension of AB. Ensure that the CD leg completes around 78.6% of XA.
Check for symmetry and proportion
Verify that the pattern exhibits symmetry and proportionality between its legs. The butterfly pattern should resemble a symmetrical structure with precise Fibonacci ratios.
Look for confluence with other indicators
Finally, use additional technical indicators such as Fibonacci retracement levels, RSI, or Willaims’ %R, to validate the pattern and confirm potential reversal zones (PRZ).
Top trading strategies to identify the butterfly pattern
Price action strategy
The price action strategy analyses candlestick patterns, support/resistance levels, and overall price behavior to identify trading opportunities. To confirm the pattern at Point D, analyze price action for bullish or bearish reversal candlestick patterns, such as engulfing patterns or hammers. Combined with Fibonacci ratios, these signals validate the butterfly pattern's completion and provide entry points for trades.
Butterfly confirmation strategy
The butterfly confirmation strategy combines the butterfly pattern with additional confirmation signals like price action or technical indicators to strengthen the trade idea. Once Point D is identified, confirmation is sought through additional technical indicators such as RSI or MACD, which help validate the pattern's potential reversal zone (PRZ).
Price action signals, such as bullish or bearish reversal candlestick patterns, further affirm the pattern's completion. Risk management is crucial, with stop-loss orders placed strategically below (bullish) or above (bearish) Point X to protect against adverse market movements.
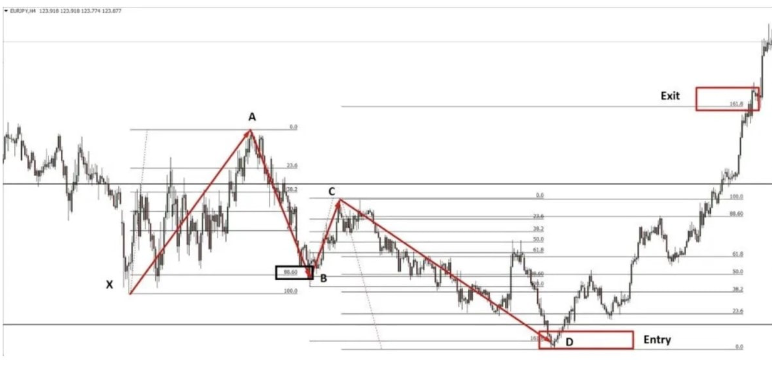
Breakout strategy
Using a breakout strategy to identify the harmonic butterfly pattern involves waiting for a breakout above (bullish) or below (bearish) Point D of the pattern. Once the breakout occurs, traders monitor for a retest of the breakout level, which now acts as support or resistance.
Entry into the trade is executed during the retest phase, confirming the breakout with increased volume and strong candlestick patterns. It's crucial to manage risk by placing stop-loss orders below (bullish) or above (bearish) the breakout level and setting gain targets at Fibonacci extension levels (e.g., 1.272, 1.618) to capitalize on potential price movements.
Harmonic pattern cluster strategy
A harmonic pattern cluster strategy identifies multiple harmonic patterns converging in a specific area, suggesting a stronger potential trend change. Traders look for convergence of different patterns, like butterflies and bats, competing near each other.
Entry points are determined at the confluence zone where multiple harmonic patterns align, providing a stronger signal for potential price reversals. Risk management involves setting stop-loss orders based on pattern structures and targeting multiple Fibonacci extension levels for gain-taking.
Common risks when using the butterfly pattern (and how to avoid them)
- Missed trends: Price action might not reverse as predicted, leading to false signals and missed trend continuations. Combine the Butterfly pattern with price action confirmation (e.g., bullish engulfing at D for a long entry) or breakouts to strengthen the trade idea.
- Subjectivity: Butterfly patterns rely on specific Fibonacci retracements. Minor variations in drawing the pattern can lead to misidentification. Develop a consistent approach to drawing Fibonacci retracements and identifying key points (X, A, B, C, D) on multiple timeframes.
- Low frequency: Butterfly patterns are less frequent than other technical indicators. Traders might miss potential trading opportunities waiting for the perfect trading setup. Use the Butterfly pattern alongside other technical indicators to identify potential trades.
- Large stop-loss requirements: The Butterfly pattern's target zones can be wide, leading to large stop-loss placements to avoid getting stopped out prematurely. Maintain a well-defined risk management strategy with a clear stop-loss placement based on support/resistance levels or volatility indicators.
Confirm forex trends with harmonic patterns
The Butterfly pattern is helpful if traders want to spot forex reversals to enter during a downtrend or exit during an uptrend. The pattern suggests looking for a sharp decline (XA), a corrective rally (AB), a partial retracement (BC), and a final leg (CD) reaching the target zone (around D). here are some tips that traders can follow while trading the Butterfly pattern –
- Don't trade in isolation: Integrate the Butterfly pattern with other technical indicators and strategies for more accurate entry/exit points
- Multiple timeframes: Analyze the butterfly pattern on different timeframes for stronger confirmation
- Expansion: Explore other harmonic patterns to broaden trading opportunities
While the butterfly pattern identifies potential reversal signals, combining them with other strategies is important to ensure confirmed signals in the forex market.
Disclaimer: All material published on our website is intended for informational purposes only and should not be considered personal advice or recommendation. As margin FX/CFDs are highly leveraged products, your gains and losses are magnified, and you could lose substantially more than your initial deposit. Investing in margin FX/CFDs does not give you any entitlements or rights to the underlying assets (e.g. the right to receive dividend payments). CFDs carry a high risk of investment loss.