Is the British Pound's recent strength about to hit a wall?
I will dig deep into the data—uncovering seasonal trends, dissecting retail sentiment, and analyzing currency strength and weakness to find out where GBP might be headed next.
So let's take a look at seasonal analysis first, and the GBP has been outperforming of late which is unusual for this time of year. We can see this via the chart here.
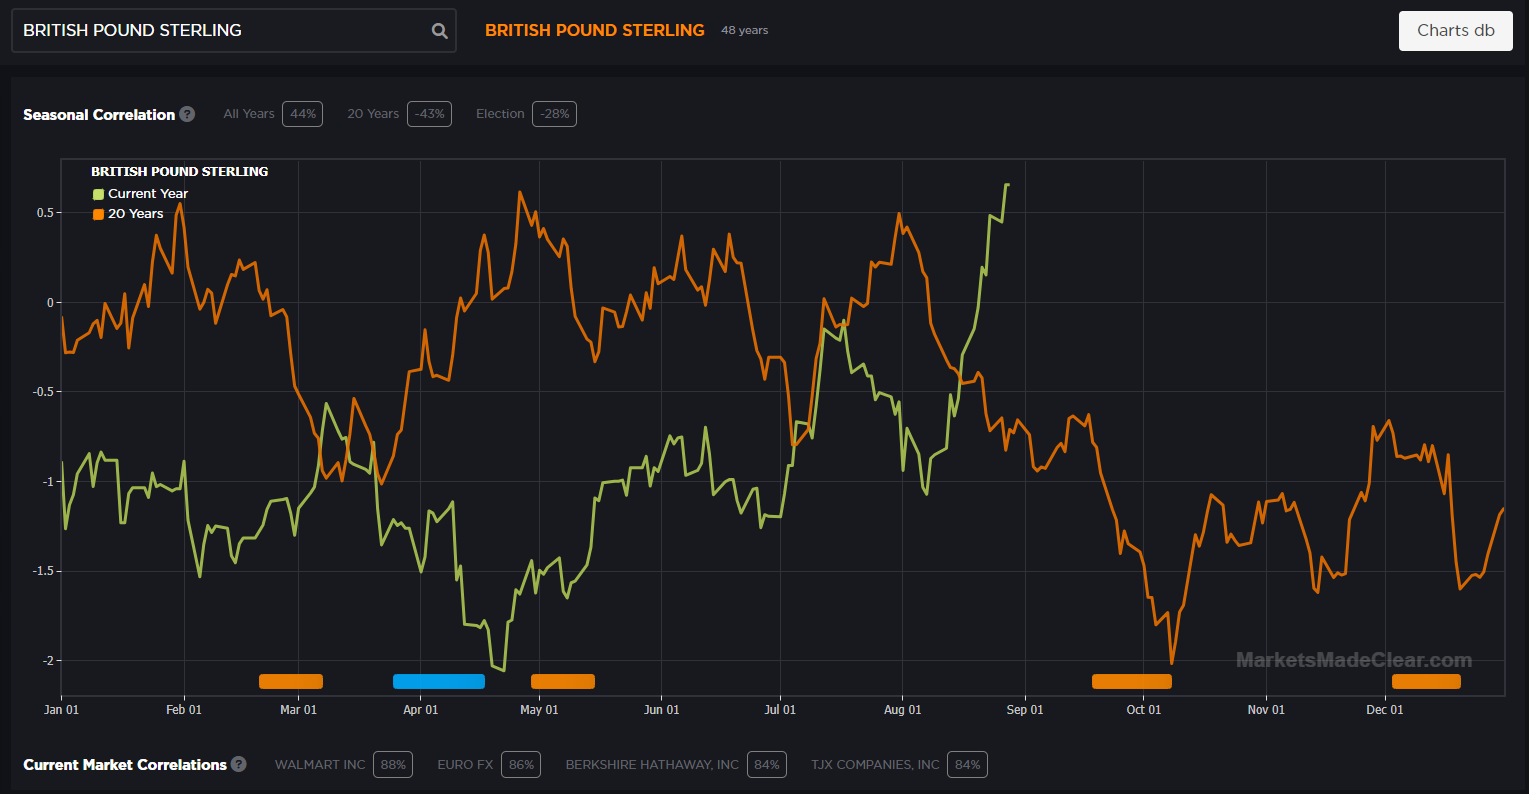
The green line is the current year, and the orange line is the 20 year average. We can see it's not following the 20 year average at all.
However if we adjust the data and find out what happens if August is bullish, we get a custom seasonal pattern that has a 76% correlation with current price.
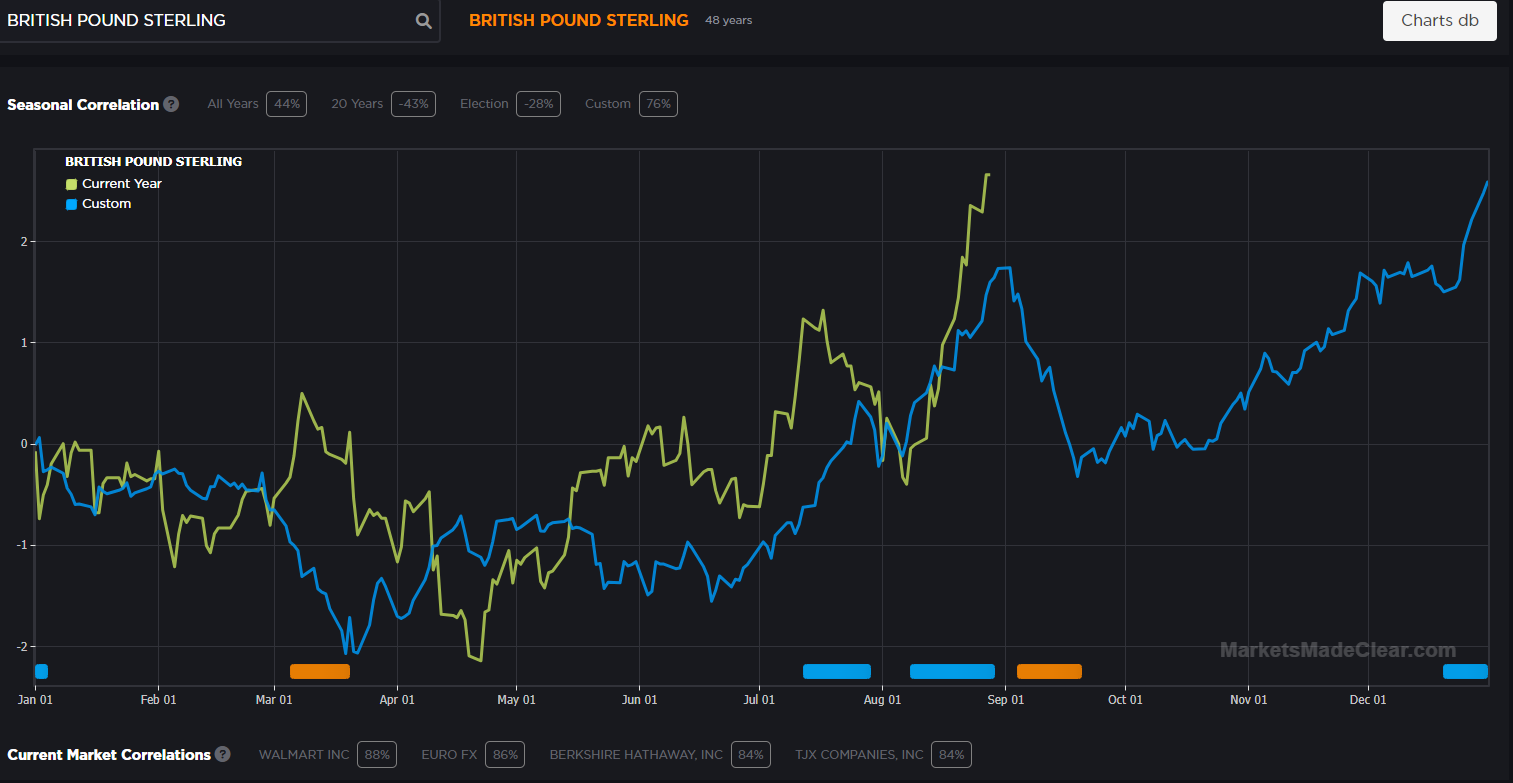
This also shows us that in September we can often see a top form in GBP futures.
This is interesting information, and could help us identify opportunities on the GBP if we were to see some changes in structure on the technical side.
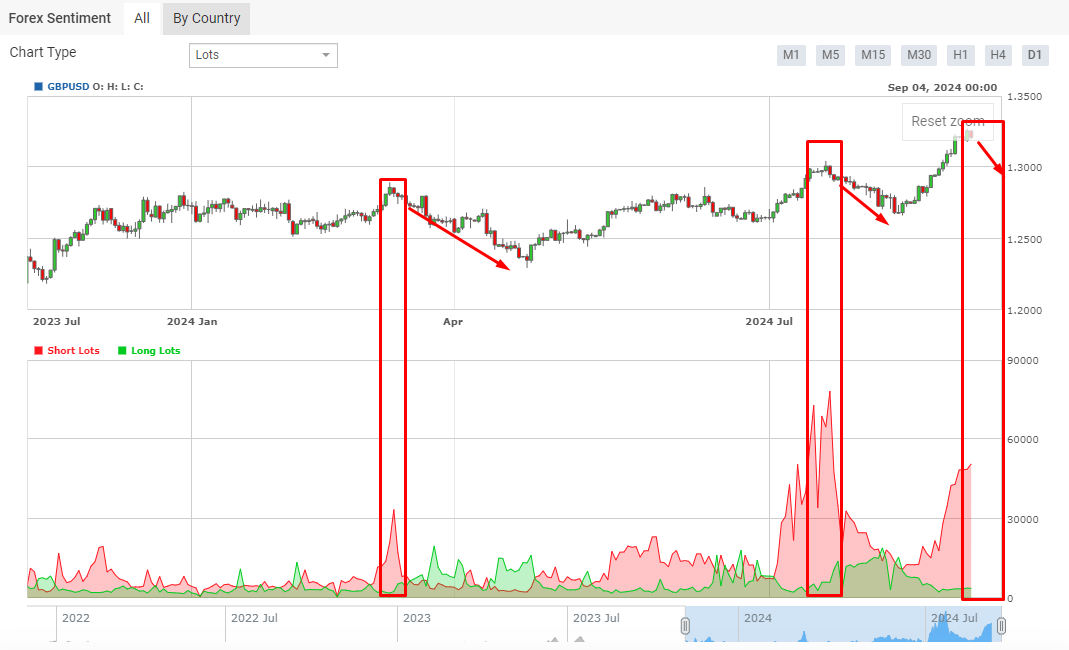
The next piece of information is retail sentiment. As we can see short lots outweigh long lots by a substantial amount. When this has happened previously we can see the price of cable has fallen.
The currency strength and weakness meter shows the GBP gaining strength after a poor run, but comparing against the USD we can see the USD is in a reversal zone.
Any positive data out of the US in the next week or two could bring a reversal around for the price of Cable.
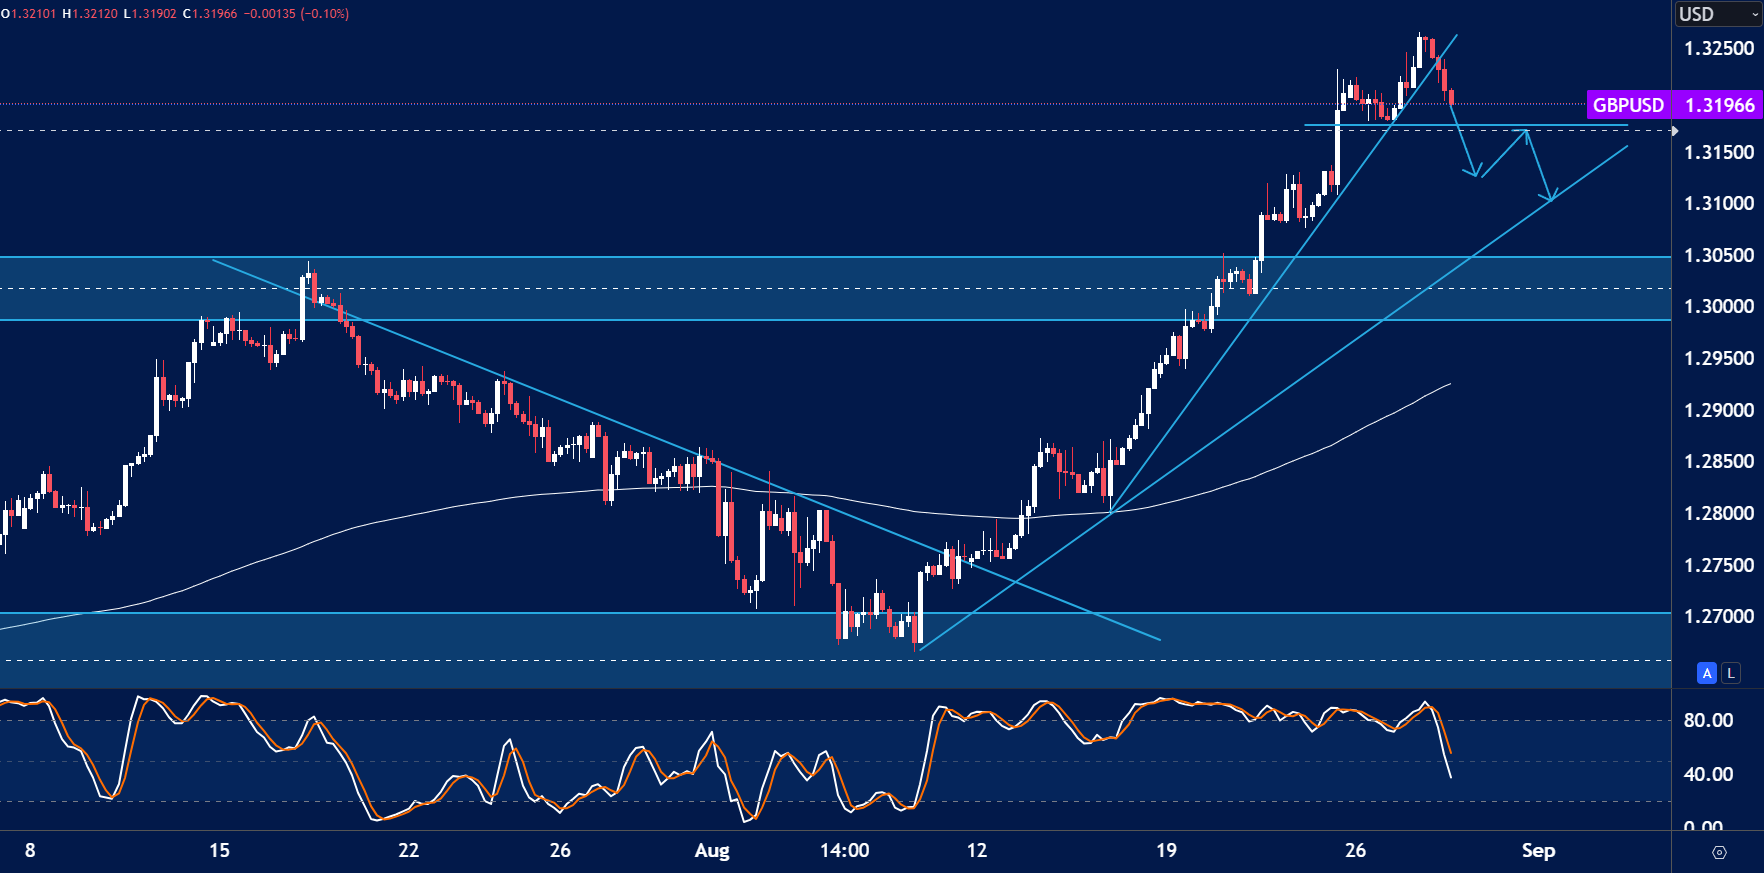
From a technical perspective we can see the price has broken through a trendline support. Is this the first sign of a potential breakdown? Personally I'd like to see a break below 1.3175 to confirm a short term pullback.
Enjoy low spreads and quick trade executions with a live account. Our highly committed customer support team will assist you with your quick account setup for any future concerns. Start trading with Blueberry.
Disclaimer: All material published on our website is intended for informational purposes only and should not be considered personal advice or recommendation. As margin FX/CFDs are highly leveraged products, your gains and losses are magnified, and you could lose substantially more than your initial deposit. Investing in margin FX/CFDs does not give you any entitlements or rights to the underlying assets (e.g. the right to receive dividend payments). CFDs carry a high risk of investment loss.


