


Multiple timeframe analysis follows a top-down approach to trading: allowing you to analyze longer-term trends to find ideal entry points on a smaller timeframe.
In a general sense, timeframes help traders analyze patterns and trends over a certain period. They can also identify market movements, both uptrends and downtrends. After choosing which timeframes to analyze, you can then use technical analysis to strategize your next move.
In this article, we will discuss everything you need to know about multiple timeframe analysis:
What is a timeframe in Forex trading?
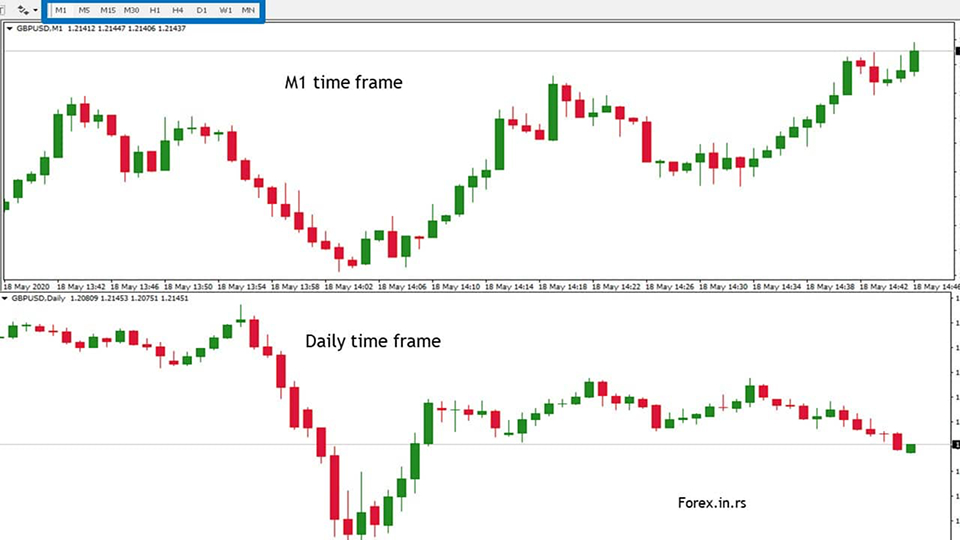
A timeframe is the unit of time that price charts are based on. For example, if we have a price chart in a daily timeframe, it represents the different price points of the currency pair in a day.
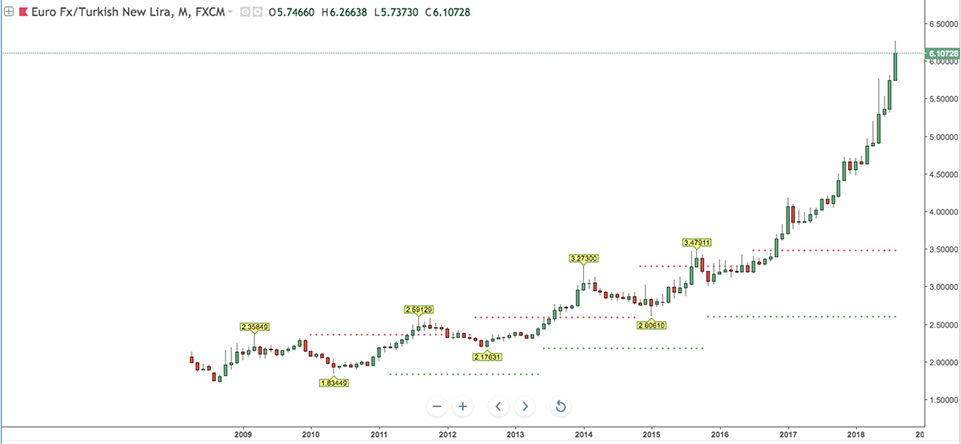
When traders expand the timeframe to a week or a month, it helps them look at the bigger picture and identify long-term trends in the foreign exchange market.
What is a multiple timeframe analysis?
In a multiple timeframe analysis, you can view the same currency pair under numerous timeframes. Hence, if you are trading EUR/USD, you can view the price movement of this pair in an hourly, daily, and weekly timeframe to understand how volatile its price movement is in different time periods.
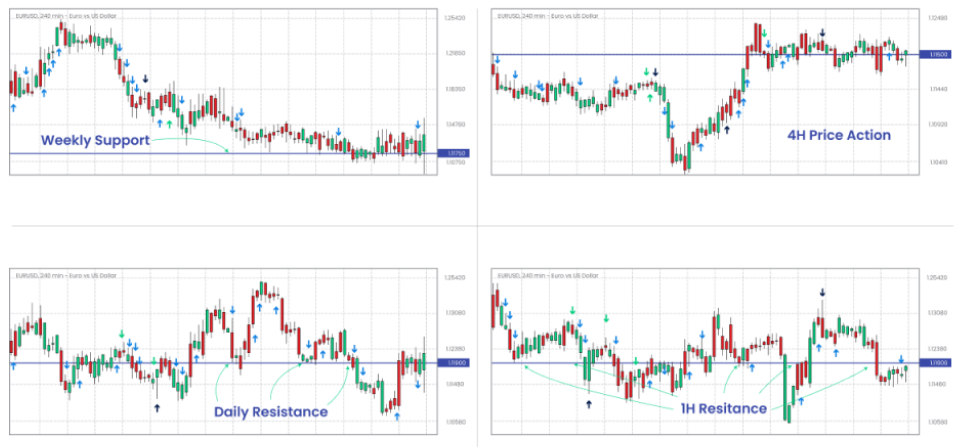
In a larger timeframe, like weekly or monthly, you can identify long-term trends to make informed decisions while weighing market sentiments. However, a shorter timeframe is used by traders to spot ideal entry or exit points in the market with immediate effect.
Types of Multiple Timeframe Analysis
Long-term timeframe
The long-term timeframe is used to establish the market's primary trend. Traders typically analyze charts such as weekly or monthly charts to identify overarching trends that could last from several months to years. This view helps traders determine whether a currency pair is generally in an uptrend, downtrend, or range-bound market over an extended period.
Understanding the long-term trend allows traders to align their strategies accordingly. For example, if the long-term trend indicates a strong bullish pattern, traders may look for long opportunities in shorter timeframes that align with this trend.
Medium-term timeframe
The medium-term timeframe bridges long-term and short-term views and is often used for analyzing the market’s intermediate movements. Traders might focus on the daily or 4-hour charts to identify significant patterns, support and resistance levels, and potential market consolidations that could last for days to weeks.
This timeframe is particularly useful for swing traders who hold positions for several days or weeks and need insight into the broader price movement within the primary trend.
Short-term timeframe
The short-term timeframe is used to fine-tune trade entries and exits. It involves charts such as the hourly, 15-minute, or even 5-minute charts. Short-term analysis is essential for day traders and scalpers who aim to capture rapid price movements and execute trades that last from a few minutes to hours.
By focusing on these shorter intervals, traders can pinpoint precise entry points, set tight stop-loss orders, and plan strategic exits to maximize gains in a limited time window.
Risks of multi-timeframe analysis
Analysis paralysis
Analyzing multiple timeframes can lead to information overload and confusion. Traders might get caught up in reconciling conflicting signals from different timeframes, leading to indecision and missed opportunities.
Overtrading
The excitement of spotting potential setups across multiple timeframes can tempt traders to take more trades than they should. This can increase risk and reduce overall gains.
Increased complexity
Multi-timeframe analysis requires a deeper understanding of market dynamics and technical analysis tools. It can be more complex to implement effectively than analyzing a single timeframe.
Time-consuming
Analyzing multiple timeframes takes more time and effort than focusing on a single timeframe. This can be especially challenging for traders with limited time.
Conflicting signals
Different timeframes can sometimes provide conflicting signals. This can be confusing and make it difficult to determine the market's overall direction.
What are the top technical indicators to use with multiple timeframes?
Moving averages
Moving averages provide a smoothed line that helps identify the direction of a trend. Moving averages help traders align short-term trade entries with long-term trends when applied across different timeframes.
For example, the 200-period moving average on a weekly chart helps identify the overall trend, while the 50-period moving average on a daily chart and a 20-period moving average on an hourly chart can be used for medium- and short-term analysis.
Relative Strength Index (RSI)
RSI is a momentum oscillator that measures the speed and change of price movements to identify overbought and oversold conditions.
On a longer timeframe (such as daily or weekly), RSI helps identify major turning points where the market may reverse. On a shorter timeframe (such as hourly or 4-hour), RSI helps find entry and exit points that align with the longer-term momentum.
MACD (Moving Average Convergence Divergence)
MACD is a trend-following momentum indicator that shows the relationship between two moving averages of a currency pair’s price. It helps identify potential changes in trend direction.
On a longer timeframe, MACD can indicate whether the market is in a bullish or bearish phase. Traders can then use a shorter time frame to spot MACD crossovers for trade entry points.
How to perform multiple timeframe analysis
1. Select timeframes
The first step is to choose the appropriate timeframes. A general rule of thumb is to use the three different timeframes discussed above together.
2. Identify the trend in the long-term timeframe
Start with the longest timeframe to identify the market's primary trend. Look for -
- Direction of the trend: Whether the market is trending up, down, or sideways
- Support and resistance levels: Major price levels where the market has reacted in the past
- Technical indicators: Use indicators like moving averages (such as 200-period moving average) or the ADX to confirm trend strength and direction
For example, if the weekly chart shows a strong uptrend with higher highs and higher lows, the trader should ideally look for long opportunities in shorter timeframes.
3. Analyze the medium-term timeframe
Then move to the medium-term timeframe to confirm the trend identified in the long-term analysis. This timeframe helps detect important price patterns, consolidations, and potential pullback levels within the larger trend. Look for –
- Trend confirmation: Ensure the medium-term trend aligns with the long-term trend
- Reversal patterns: Watch for signs of potential reversals, such as head and shoulders or double tops/bottoms
- Indicators: Apply tools like RSI, MACD, or Fibonacci retracement levels to detect momentum changes and critical support/resistance areas
For example, on a 4-hour chart, a trader might spot a pullback to a support level that aligns with the overall uptrend on the weekly chart.
4. Confirm entries and exits in the short-term timeframe
The short-term timeframe is used for precision in timing trade entries and exits. Look for –
- Entry and exit signals: Identify price action signals (such as candlestick patterns like bullish engulfing doji) and technical indicator crossovers (such as MACD or Stochastic).
- Volatility and momentum: Use Bollinger Bands or volume indicators to confirm potential breakouts or reversals.
- Stop-loss and take-profit levels: Place these levels based on support and resistance zones identified in this timeframe, ensuring they align with higher timeframe analysis.
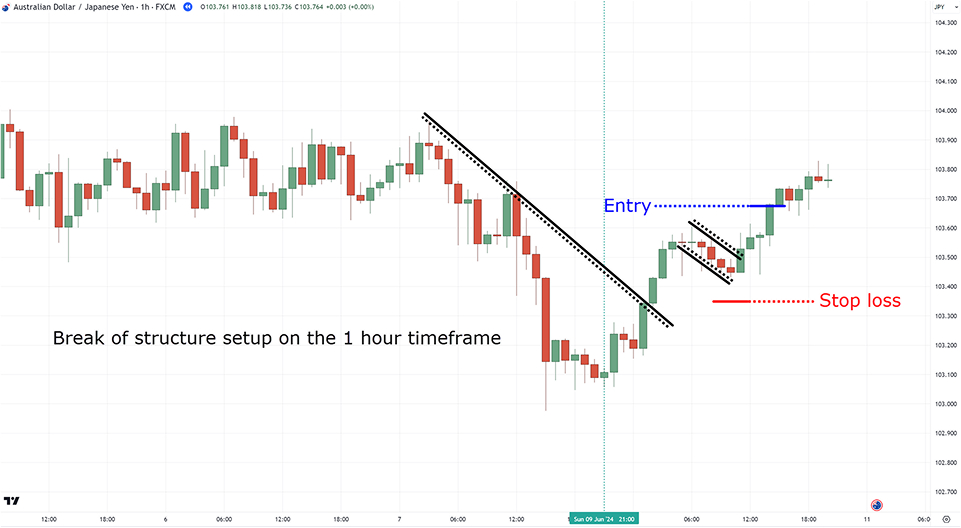
For example, if a trader identifies a pullback on the 4-hour chart within an uptrend on the weekly chart, they could use the 1-hour chart to spot an entry point with bullish candlestick confirmation and set appropriate stop-loss and take-profit levels.
5. Align the analysis
Ensure that the short-term chart's trading decision aligns with the long-term and medium-term analysis findings. This alignment enhances the probability of a trade.
6. Place and monitor the trade
Once alignment across timeframes is confirmed, enter the trade based on the short-term analysis. Keep an eye on the medium- and short-term charts for any changes in momentum or trend direction.
Top tips in analyzing multiple timeframes
Don’t just stick to a top-down approach
The top-down approach is not the only approach that you should stick to. It is recommended to stay on the timeframe you are most comfortable with, and just zoom out from there to get a closer look at the bigger picture. Zooming out multiple times a day gives you greater context and helps you make informed trading decisions.
Go long and go short
Dealing with both long and short trades with multiple timeframe analyses lets you become a more effective trader. It helps you avoid one-dimensional thinking because when you only have a short trade, you end up ruling out all long trade signals. On the other hand, if you only have long trades to focus on, you are more likely to miss trends signaling a reversal that could benefit you later.
Identify the right timeframes that fit your needs
Always start by identifying different timeframes that suit your trading style:
- If you are a scalper, a 15, 10, and 1-minute chart will fit your trades best.
- For day traders, a daily, 4-hour, or hourly chart would be the best for you.
- If you are a swing trader and wish to hold currencies for a few days, then an hourly, a 4-hour, or a daily chart are the best picks for multiple timeframe analysis.
- Last but not least, for position traders who hold their trades for several weeks or months, a monthly, weekly, or daily chart would be most suitable.
Start effective trading with multiple timeframe analysis
Analyzing and reading multiple timeframes to understand the price movement of currency pairs can help you make informed decisions about your trade. When the charts are clear and easy to understand, you are able to make effective buy and sell decisions more quickly.
Our trading platform provides you with various charts which you can view in up to 21 timeframes to ensure that every trade position you open is backed by careful analysis of the forex market. Create an account and start trading more effectively with multiple timeframe analyses by clicking here.
Disclaimer: All material published on our website is intended for informational purposes only and should not be considered personal advice or recommendation. As margin FX/CFDs are highly leveraged products, your gains and losses are magnified, and you could lose substantially more than your initial deposit. Investing in margin FX/CFDs does not give you any entitlements or rights to the underlying assets (e.g. the right to receive dividend payments). CFDs carry a high risk of investment loss.