


The On Balance Volume (OBV) indicator analyses the forex price momentum to measure the market’s buying and selling pressure. Based on these pressures, traders receive ideal entry and exit price levels to trade. In our article, we will understand the On Balance Volume indicator in-depth.
What is an On Balance Volume indicator?
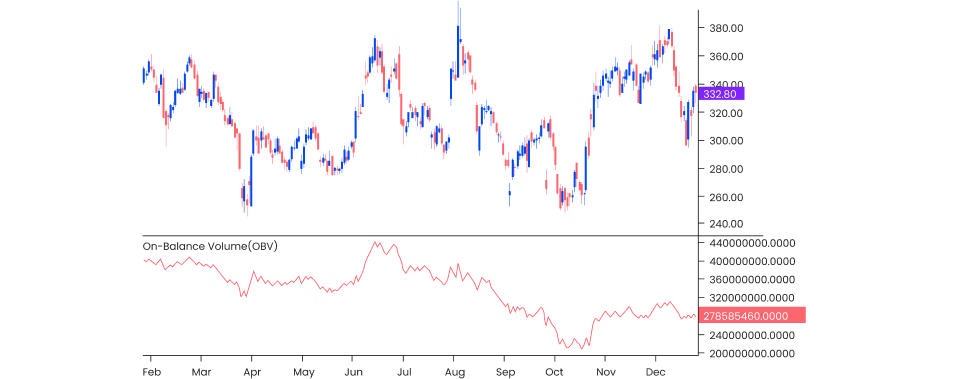
The On Balance Volume indicator is a momentum indicator that uses a currency pair’s volume to predict the change in its prices. It measures the buying or selling pressure in the market and provides you with the ideal entry or exit price level. On up days, when the currency pair prices close at more than the previous day’s closing price, the OBV indicator adds all volumes together. On down days, when the currency pair price closes lower than the previous day’s close, it subtracts the cumulative volume.
- Whenever the OBV indicator indicates that the currency pair volume is increasing sharply and so are the prices, it indicates a continued uptrend and signals traders to place long orders.
- Whenever the OBV indicator indicates that the currency pair volume is dropping and so are the prices, it indicates a continued downtrend and signals traders to place short orders.
There are two main signals that an On Balance Volume indicator provides –
Trend confirmation signal
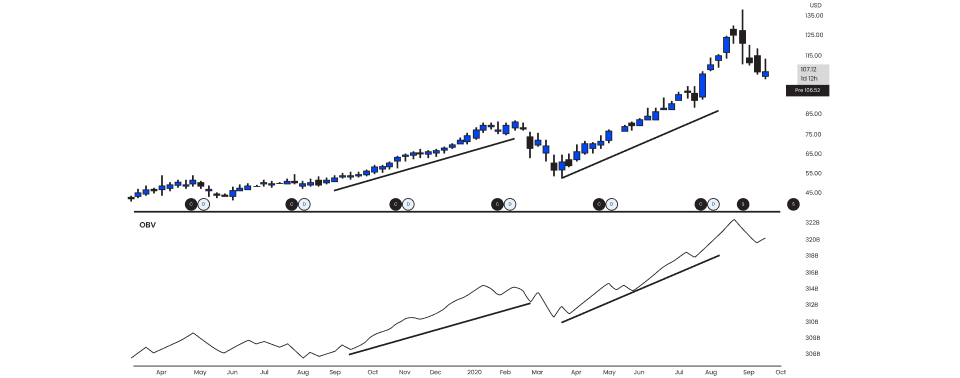
The indicator confirms price trends through breakouts. When the OBV indicator breaks its downtrend line, followed by a resistance breakout, it confirms an uptrend reversal and signals traders to place long orders. On the other hand, when the OBV indicator breaks its uptrend line, followed by a support breakout, it indicates a downtrend reversal and signals traders to place short orders.
Trend divergence signal
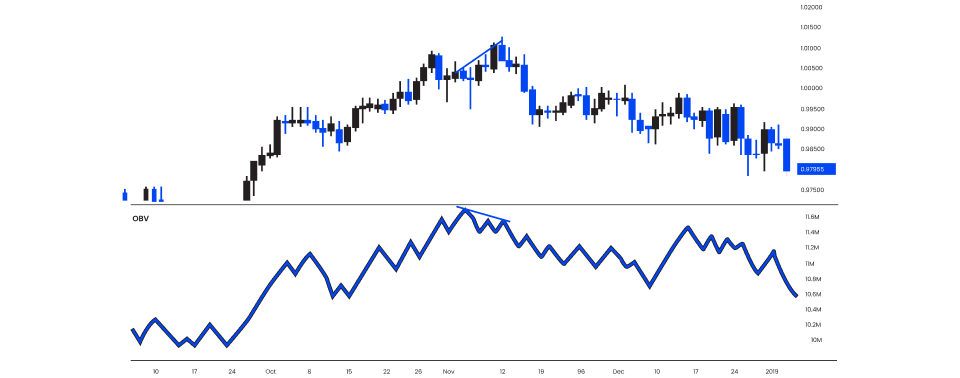
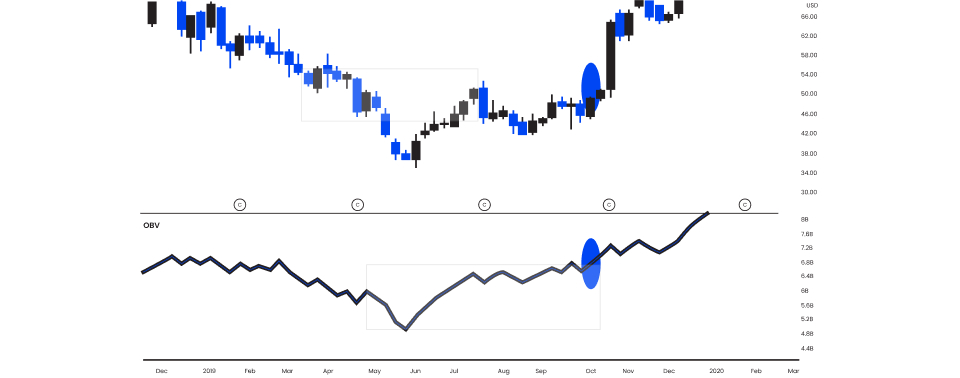
The On Balance Volume indicator provides traders with bullish and bearish divergence signals. A bullish divergence signal occurs when the OBV indicator forms a higher low value, and the currency pair prices make a lower low. On the other hand, a bearish divergence takes place when the OBV indicator forms a lower low when the currency pair prices form a higher high. This divergence between the On Balance Volume indicator and currency pair prices provide traders with price reversal signals. A bullish divergence signals that the buyers’ strength in the market is more, and hence, a long order should be placed and vice versa.
Formula for On-Balance Volume (OBV)
The oBV indicator is calculated by adding the current day's volume to the previous day's OBV if the closing price is higher than the previous day's closing price, or subtracting the current day's volume if the closing price is lower.
Here's the formula for calculating the OBV indicator: OBV(today) = OBV(yesterday) + Volume(today) * Sign(Close(today) - Close(yesterday))
Where,
- OBV(today): The On-Balance Volume for the current day
- OBV(yesterday): The On-Balance Volume for the previous day
- Volume(today): The trading volume for the current day
- Close(today): The closing price for the current day
- Close(yesterday): The closing price for the previous day
- Sign(x): A function that returns 1 if x is positive, -1 if x is negative, and 0 if x is zero
What does OBV indicate?
On-Balance Volume (OBV) is a cumulative volume indicator that measures the accumulation or distribution of a security's volume based on its price changes. It helps identify potential divergences between price and volume, which can signal changes in market sentiment or momentum. It primarily indicates –
- Divergence: When the OBV indicator moves in the opposite direction of the price, it can signal a potential divergence. This divergence may indicate that long or short pressure is not aligning with the price movement, suggesting a possible reversal.
- Momentum: The OBV can also be used to gauge the momentum of a currency pair. A rising OBV with a rising price indicates strong long pressure, while a falling OBV with a falling price suggests strong short pressure.
- Accumulation/Distribution: The OBV can help identify periods of accumulation (long pressure) or distribution (short pressure). A rising OBV, while the price is relatively flat, may indicate accumulation, while a falling OBV during a flat price period may suggest distribution.
Example of trading with the On Balance Volume indicator
Let us assume that you are trading USD/EUR at an exchange rate of 2, which has been bullish for some time now. Hence, you place a long order and wait for the prices to rise. Due to a sudden change in the US’s economic policy, the exchange rate does manage to increase further to 3.2, and the OBV indicator signals a swing high.
The uptrend continues, and the currency pair reaches an exchange rate of 3.5, crossing its previous high of 3.2, making your long order a success. Upon analysing the OBV indicator, you understand that the indicator does not reach its prior high and signals a bearish divergence. This tells you that there is going to be a downtrend reversal in the market soon, and the prices will correct themselves. This downtrend expectation makes you place a short order at 3.5, with an expectation to gain from the falling markets.
As the OBV indicator suggests, the market starts falling, and the currency pair price reaches an exchange rate of 2.5, near its initial price. This makes your trade successful with the help of the OBV indicator as your short order is successfully executed.
How to calculate the On Balance Volume indicator
The On Balance Volume indicator calculation is used to ascertain the total of a currency pair’s trading volume. It indicates if the volume is flowing into the market (buyers are more powerful) or out (sellers are more powerful) of the market. It is calculated by taking the cumulative total of the currency pair’s volume in the following manner:
- If the current closing price is more than the previous day’s closing price, current OBV = previous OBV + currency pair’s today volume, known as up volume.
- If the current closing price is less than the previous day’s closing price, current OBV = previous OBV – today’s volume, known as down volume.
- If the current closing price is equal to the previous day’s closing price, current OBV = previous day’s OBV.
*This is an example only to enhance a consumer's understanding of the strategy being described above and is not to
be taken as Blueberry providing personal advice.
How does the On Balance Volume indicator work?
The On Balance Volume indicator provides traders with the direction in which the currency pair is trading:
- When the currency pair price and On Balance Volume indicator both make higher highs in the market with higher lows, it indicates a continued upward trend.
- When the currency pair price and On Balance Volume indicator are making lower highs and lower lows, it indicates a continued downward trend.
- If the market is trending in a range and the OBV is rising, it signals an upward breakout.
- If the market is trending in a range, but the OBV is falling, it signals a downward breakout.
- When the currency pair prices make higher highs, but the On Balance Volume indicator is not able to make higher highs, it signals that the upward trend is going to fail and bearish divergence will take place.
- When the currency pair prices make lower lows, but the On Balance Volume indicator does not, it indicates that the downward trend is going to fail and bullish divergence will take place.
The top trading rules for On Balance Volume indicator
Uptrend confirmation
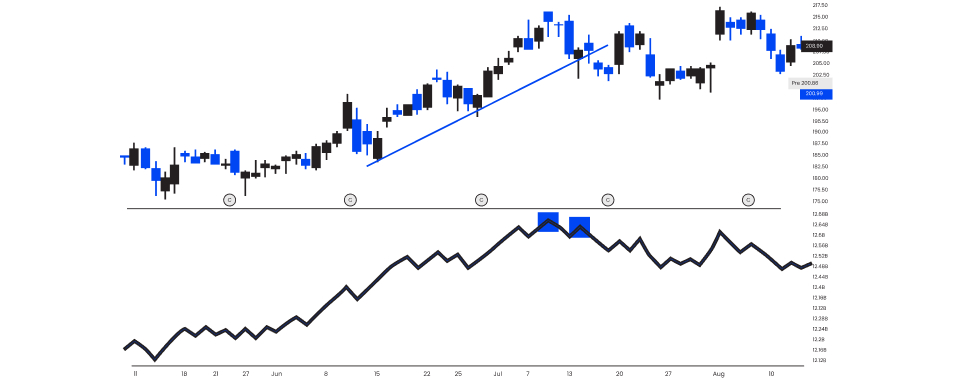
The On Balance Volume indicator must make newer and higher highs and higher lows along with the currency pair price touching peaks as well (in the same pattern) if it wants to confirm the uptrend continuation.
Downtrend confirmation
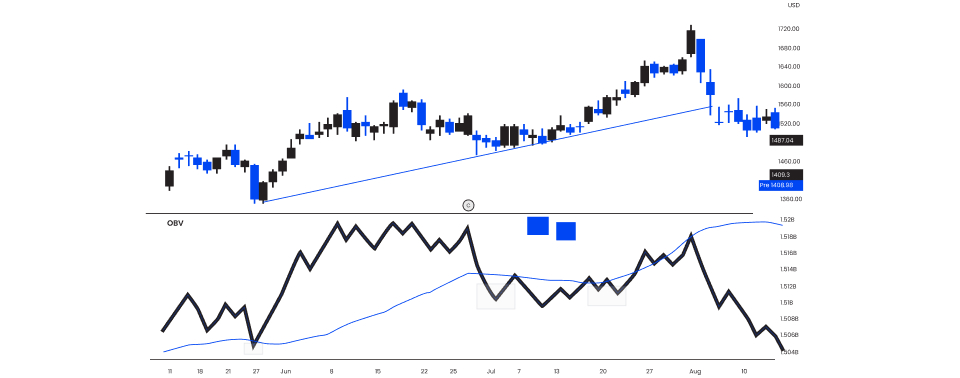
The On Balance Volume indicator must make lower lows and lower highs in the same pattern as the currency pair price to confirm the downtrend continuation.
Non-confirming uptrend
The rule to trade with an On Balance Volume indicator providing a non-confirmation about the uptrend takes place when the currency pair price makes a new higher high and higher low, but the OBV indicator fails to make a new higher high. This signals a break in the uptrend. Since the volume is not able to maintain the same pace as rising prices, there is a non-confirmation in a trend indicating an end to the uptrend and the start of a downtrend. Hence, this is a level where traders are signalled to place short orders and exit from their long orders.
Non-confirming downtrend
The rule to trade with an On Balance Volume indicator providing a non-confirmation about the downtrend takes place when the currency pair price makes a new lower low and lower high, but the OBV indicator fails to move in a similar pattern. This signals a break in the downtrend. Since the volume is not able to maintain the same pace as rising prices, there is a non-confirmation in a trend indicating an end to the downtrend and the start of an uptrend. Hence, this is a level where traders are signalled to place long orders and exit from their long orders.
Advanced breakdown
During a downtrend continuation, both price and OBV indicators move in the same pattern, making lower lows and lower highs. However, there are times when the currency pair price fails to break its previous low, but the On Balance Volume indicator breaks its previous bottom to make a lower low. This is where an advanced breakdown occurs. The rule to trade with an advanced breakdown is that the price must break the bottom sooner or later as well, and traders are signalled to exit their long orders and enter short orders due to the strong downtrend.
Advanced breakout
During an uptrend continuation, both price and OBV indicators move in the same pattern, making higher highs and higher lows. However, there are times when the currency pair price fails to break above its previous high, but the On Balance Volume indicator passes its previous high to make a new higher high. This is where an advanced breakout occurs. The rule to trade with an advanced breakout is that the price must break above its previous high level sooner or later. Traders are then signalled to place long orders and exit their short orders due to the strong uptrend.
Top On Balance Volume trading strategies
Breakout trading strategy
The OBV breakout trading strategy involves combining the currency pair’s price trend and the OBV indicator’s line. In this strategy, you first need to identify support and resistance lines. Once identified, if the currency pair price trades around the resistance level with a high volume the OBV helps in spotting the breakout even before the price manages to rise further. This is because the OBV indicator indicates the buying pressure and provides you with an ideal entry price level. The OBV indicator generally identifies a breakout before the price line does and helps in establishing a clear upward trend. If you want to trade with this strategy, you open a forex position at the breakout price level and place a stop loss above the recent high swing.
Major highs and lows strategy
When the major highs and lows are tested with the help of an On Balance Volume indicator, it gives the most reliable price moves with respect to the currency pair’s price line. This is because the price line is the first confirmation point of a trend’s strength. If it makes a higher high, followed by the OBV trending the same way, it is finally confirmed that there is a strong bullish trend. While comparing the indicator’s movement to the currency pair’s price action, if the two do not move in the same direction, the strategy suggests that there is a divergence. The divergence can be traded by placing an order opposite to the current market trend.
Exhaustion moves strategy
The exhaustion moves strategy provides traders with information about when the forex market will lose momentum, and an expected reversal is in line. It indicates bull exhaustion or bear exhaustion which occurs after a divergence. When a rising market is not accompanied by a rising OBV indicator value or volume, it indicates that there is a chance of bull exhaustion which means a downtrend reversal. On the other hand, when a falling market is not accompanied by a falling OBV indicator or volume, it indicates that there is bear exhaustion which means an uptrend reversal. When the OBV confirms that the price trend has moved too much in the upward direction, but the OBV has not, it signals traders to place short orders due to a bearish reversal expectation. When the price trend is too much in the downward direction, but the OBV moves in the opposite direction, it signals the trader to place long orders due to a bullish reversal expectation.
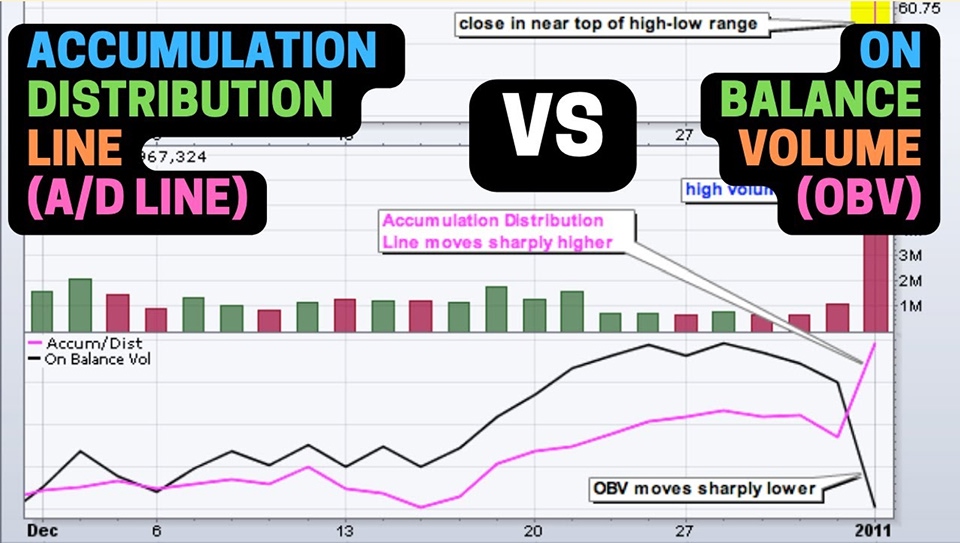
OBV vs. Accumulation/Distribution (A/D) Indicator
Calculation method
OBV calculates a cumulative volume indicator based on price changes. On the other hand, A/D calculates a cumulative volume indicator based on price changes and volume.
- OBV formula: OBV(today) = OBV(yesterday) + Volume(today) * Sign(Close(today) - Close(yesterday))
- A/D formula: A/D(today) = A/D(yesterday) + (Close(today) - Low(today) - (High(today) - Close(today))) / (High(today) - Low(today)) * Volume(today)
Focus
OBV primarily focuses on identifying divergences between price and volume. On the other hand, Accumulation/Distribution focuses on identifying periods of accumulation (long pressure) or distribution (short pressure) for the currency pair.
Calculation
OBV adds or subtracts volume based on price changes. Whereas, Accumulation/Distribution calculates a percentage-based indicator based on price changes and volume.
Interpretation
OBV divergences between price and OBV can signal potential reversals. On the other hand, A/D’s positive values indicate accumulation, while negative values indicate distribution.
Sensitivity
OBV can be sensitive to short-term fluctuations in volume, making it more reactive to price changes. Meanwhile, A/D is less sensitive to short-term fluctuations, providing a smoother indicator.
Visualization
OBV is visualized as a line chart. On the other hand, Accumulation/Distribution is visualized as a histogram.
Trading implications
OBV implies divergences between price and OBV, which signal potential entry or exit points. On the other hand, A/D implies positive values, which may indicate a bullish trend, while negative values suggest a bearish trend.
Smoothing
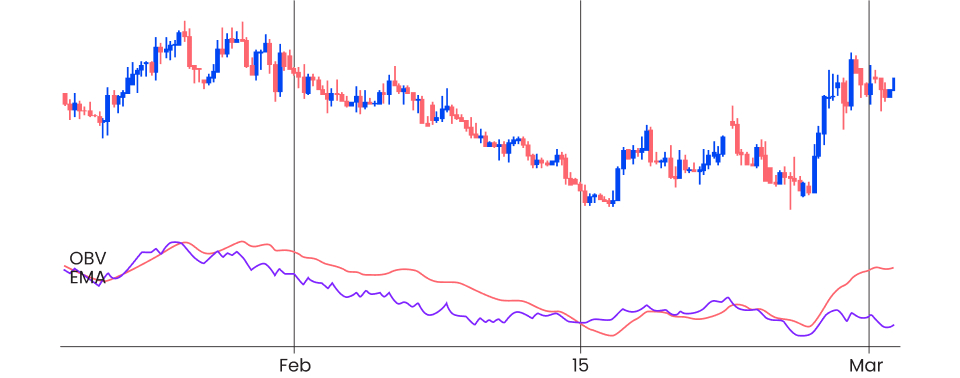
OBV can be smoothed using moving averages to reduce noise and make the indicator more readable. On the other hand, A/D may not require as much smoothing due to its inherent smoothing properties.
Trading strategies
OBV can be used to identify divergences between price and volume, which can signal potential reversals or trend changes.
A/D can be used to identify periods of accumulation or distribution, which can help determine the overall market sentiment and potential trend direction.
Benefits and risks of OBV
Benefits
- Identifies divergences: OBV can help identify divergences between price and volume, which can signal potential trend reversals or changes in market sentiment.
- Measures accumulation/distribution: OBV can measure the accumulation or distribution of a currency pair, providing insights into long and short pressure.
- Confirms trends: OBV can confirm existing trends. A rising OBV with a rising price suggests strong long pressure, while a falling OBV with a falling price indicates strong short pressure.
- Complements other indicators: OBV can be used in conjunction with other technical indicators, such as moving averages or RSI, to provide a more comprehensive analysis.
- Can identify hidden divergences: OBV can sometimes identify hidden divergences that are not apparent in the price action alone. This can provide valuable insights into market sentiment and potential trend changes.
- Useful in different timeframes: OBV can be calculated on various timeframes (like daily, weekly, and monthly), allowing traders to analyze accumulation and distribution at different levels.
Risks
- Lagging indicator: OBV can be a lagging indicator, meaning it may signal a trend change after the price has already moved significantly.
- Sensitivity to volume fluctuations: OBV can be sensitive to short-term fluctuations in volume, which can lead to false signals.
- Requires additional analysis: OBV should not be used in isolation. It's essential to consider other factors, such as market news, economic indicators, and overall market sentiment.
- May not signal all reversals: OBV may not always signal a reversal, even if a divergence occurs. It's important to use other technical indicators and analysis to confirm potential trend changes.
- Can be affected by market manipulation: OBV can be affected by market manipulation, such as wash trading or block trades, which can distort the volume data.
- Can be misleading in certain situations: Unusual volume patterns, such as large institutional orders or news-driven spikes, can distort the OBV indicator, leading to false signals.
Trade with the OBV indicator
The OBV indicator helps in confirming market trends and provides you with the ideal entry and exit price levels. You can combine this indicator with other momentum indicators, like moving averages, to receive more accurate results. Start with Blueberry Markets’ online trading platform and identify market divergences, breakouts and breakdowns even before a sharp price move occurs with the help of the On Balance Volume indicator. Sign up for a live trading account or try a demo account.