


Traders can trade forex with a quantitative trading strategy to minimize emotional biases and make data-driven decisions only. These quantitative strategies leverage statistical models and algorithms to identify patterns, optimize risk management, and execute trades automatically.
In this article, we will learn everything about quantitative trading.
What is quantitative trading?
Quantitative trading is a trading approach that relies on mathematical algorithms, models, and data analysis to make trading decisions. Any trading following the quantitative trading approach identifies trading opportunities by analyzing large datasets, such as –
- Market data such as price data, trading volume data, tick data, order book data, and more
- Economic indicators such as interest rates, inflation data, GDP, CCI, PMI, NFP, employment data and more
- Sentiment data such as news articles, analyst reports, surveys, polls, volatility indices, and more
- Technical indicators such as RSI, MACD, Bollinger bands, and more
- Alternative data, such as cross-currency correlations
Types of quantitative trading strategies
Statistical arbitrage
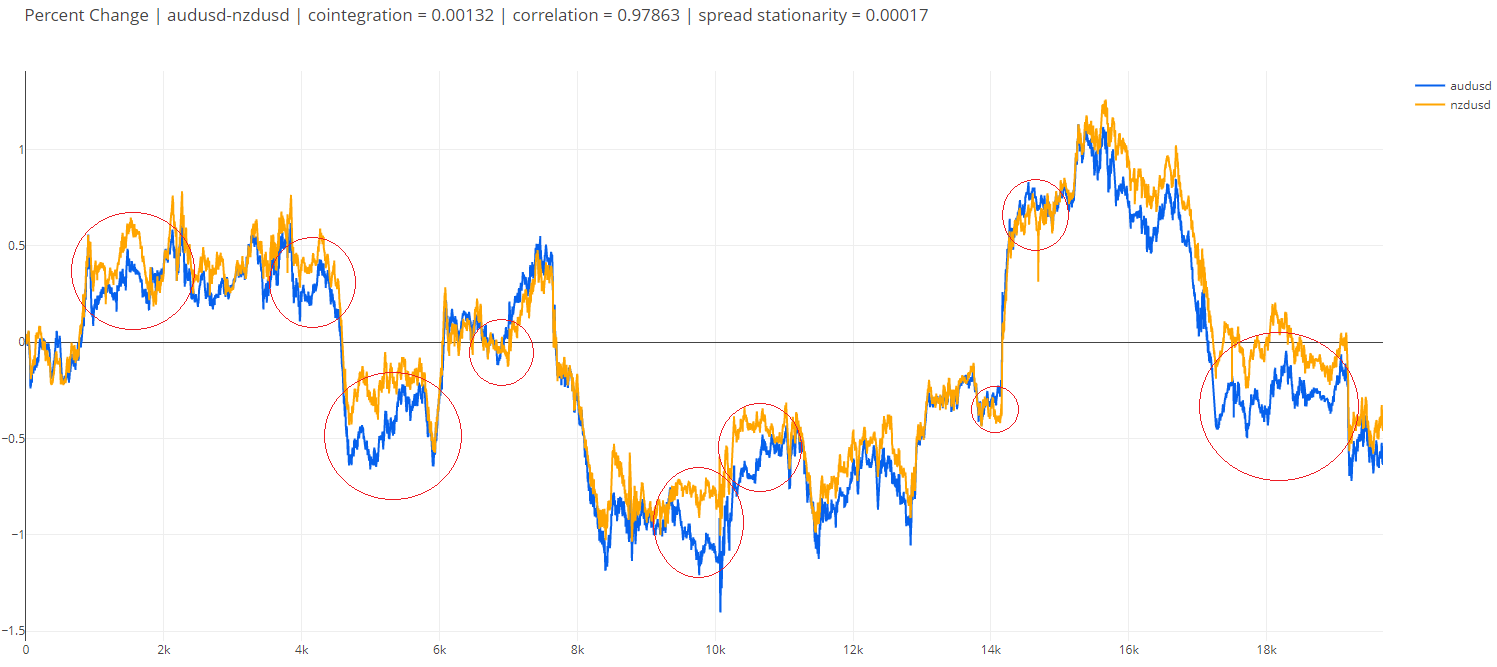
Statistical arbitrage strategy in forex exploits the price discrepancy between correlated and cross-currency pairs. It uses statistical analysis methods (like cointegration, correlation quantitative analysis, and regression models) to identify mean reversion opportunities, which allow quantitative traders to gain from temporary mispricing.
When the prices of two correlated currency pairs deviate from the historical mean, traders can enter opposite positions. This helps a quantitative trader gain in both rising and falling financial markets.
Algorithmic trading
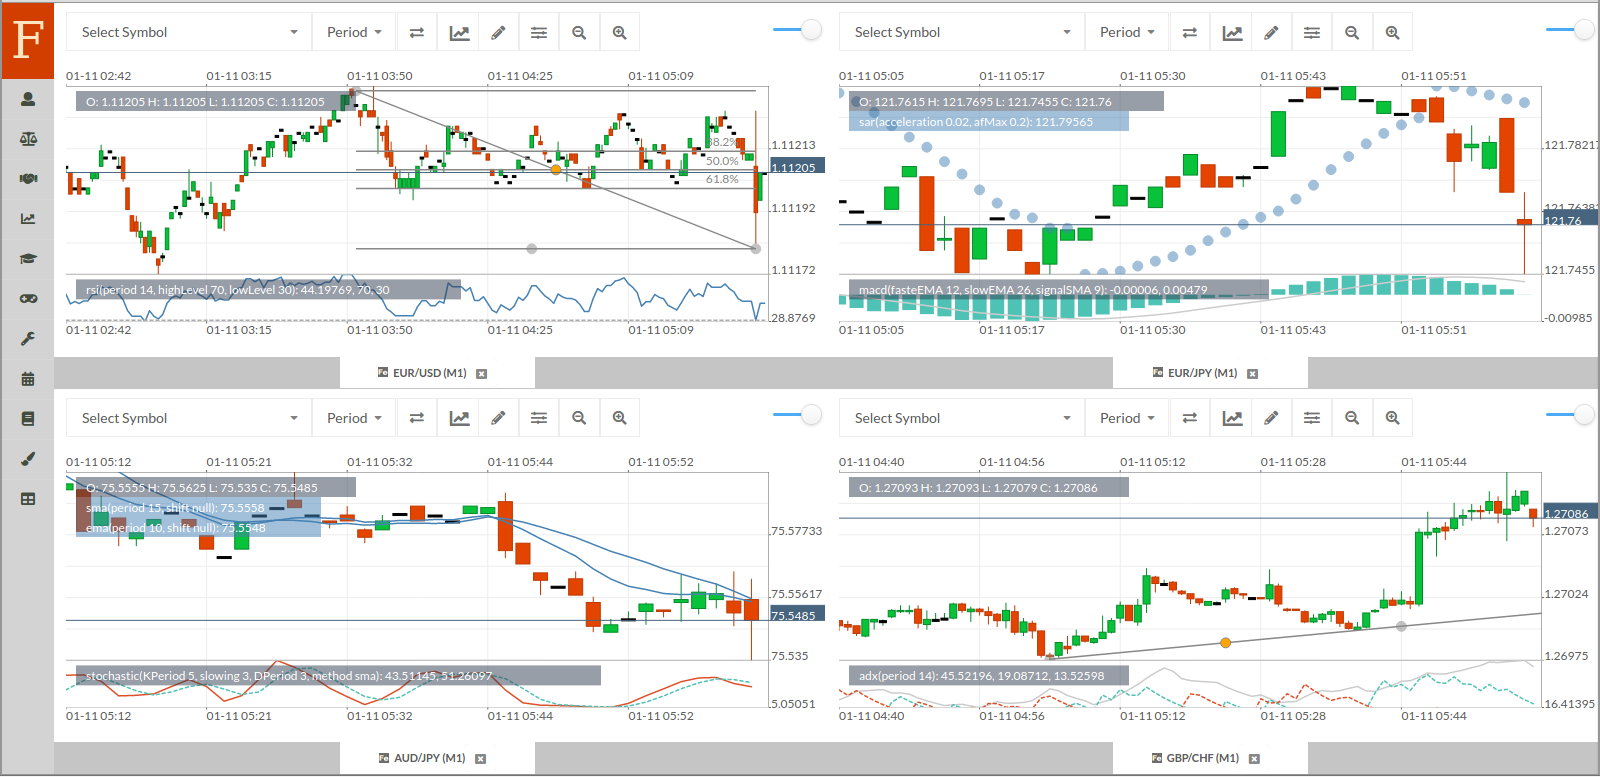
Algorithmic trading strategies involve automated trading systems to execute trades based on predefined criteria and mathematical calculations. The algorithms analyze the market data and execute orders accordingly at extremely high speeds, which is usually not humanly possible.
This also reduces manual errors and increases trade execution scalability. Traders can use technical indicators in algorithmic quantitative trading for the automated trading systems to place orders based on the signals sent by the technical indicator on different timeframes to realize an average price close to the trading price.
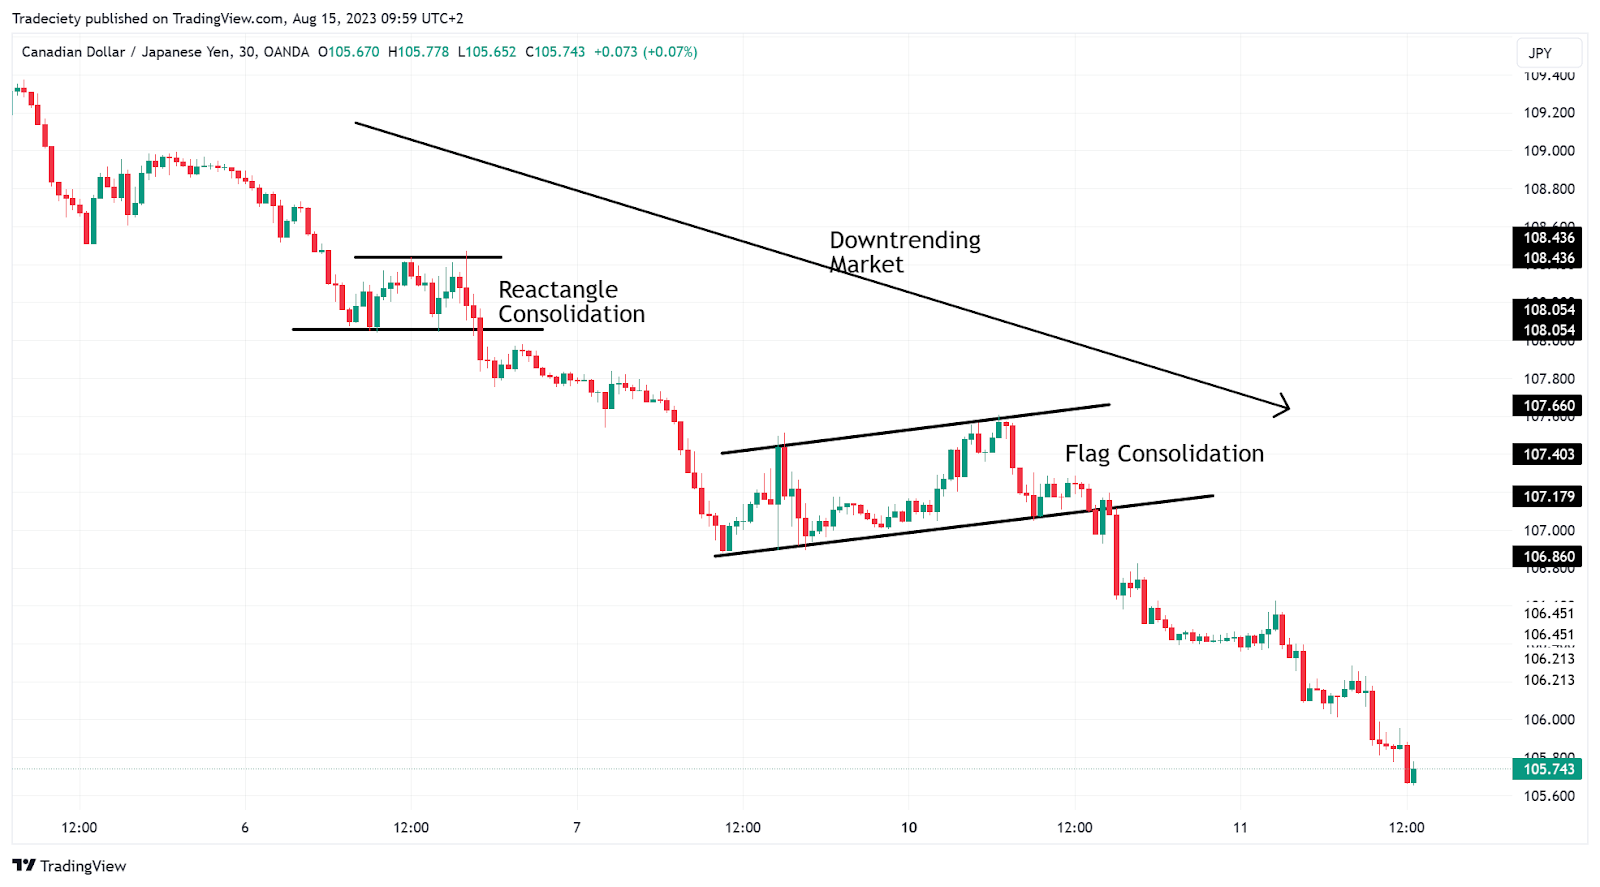
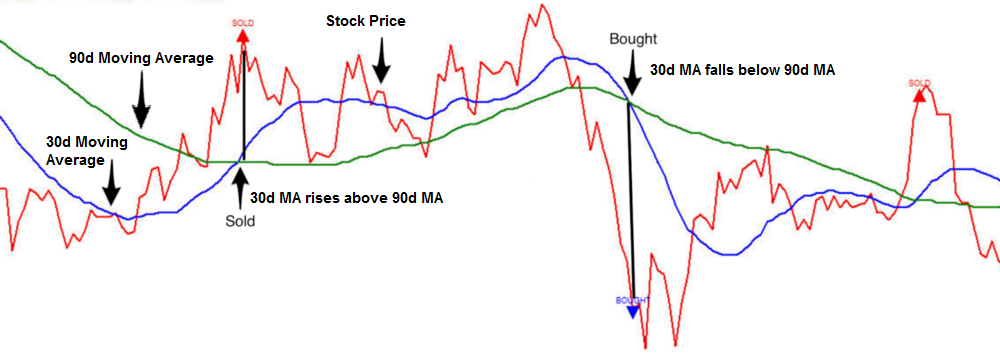
Trend following
A trend-following strategy capitalizes on existing market trends continuing in the same direction. Traders use several technical indicators to analyze market data and determine entry and exit price points that align with the trend's direction. The strategy can be applied in both rising and falling markets, where traders place long and short orders, respectively.
For example, traders can use moving average crossovers to identify if the trend changes or continues in the same direction. Traders can enter a long position during an uptrend when a short-term moving average crosses a long-term moving average from above.
Mean reversion
The mean reversion strategy assumes that currency pair prices revert to their historical averages over time. With this strategy, traders can identify trading opportunities at overbought and oversold price levels. This lets them take positions anticipating a price correction towards the mean. It follows a contrarian approach where traders take positions opposite to the prevailing market trends by analyzing historical market data to identify mean-reverting quantitative trading opportunities.
Traders can use the z-score analysis to conduct this strategy by measuring a price's total number of standard deviations from its mean. This identifies the point where the financial markets will reverse. A high z-score implies an overextended price, signaling traders to enter a short position and vice versa.
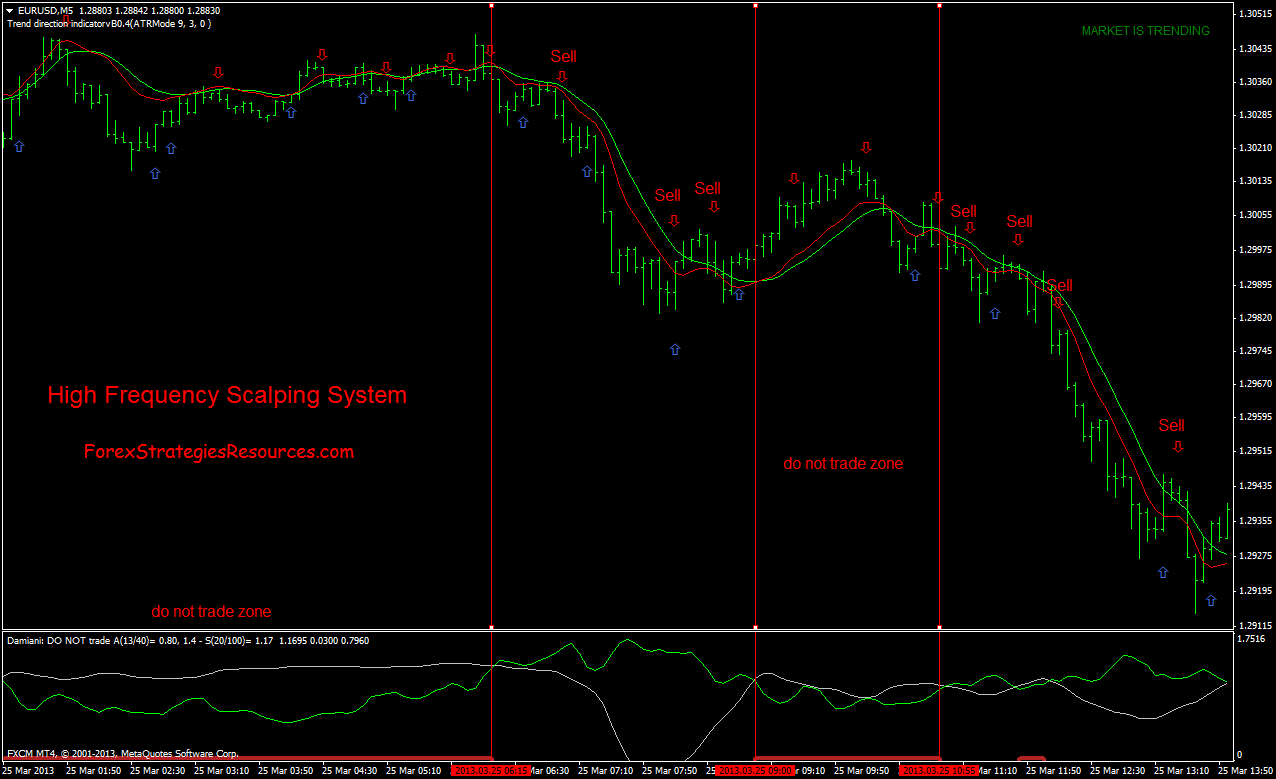
High-frequency trading
High-frequency trading (HFT) involves executing an extremely large number of trades at very high speeds to capture small price inefficiencies. It relies on strong infrastructure and technology that minimizes latency and maximizes execution efficiency so that the traders gain as much as possible from market movements.
Traders can use quantitative analysis, such as market microstructure arbitrage, that analyzes market order flows and price patterns to identify short-term inefficiencies. They can detect these patterns and execute trades accordingly. Latency arbitrage is another way to exploit the time delay between receiving market data and executing trades. It helps quantitative traders execute trades faster than competitors to gain from price changes within milliseconds.
Implementing a quantitative trading strategy
Define trading strategy
A quantitative trading strategy involves information regarding the market data to capture, technical indicators to use, computation techniques to make trading decisions, and other information that one adds to a trading strategy, such as goals, pairs to trade, risk management, and more.
Gather and prepare data
Since quantitative trading is completely based on data, gathering and preparing data is the next essential step. Traders should obtain historical, macroeconomic, and sentiment data from the internet. Follow the steps below to prepare the collected data –
- Clean the data by removing outliers, correcting errors, and filling in missing data points
- Standardize data to a common scale to ensure easy comparison across currency pairs
- Create data features that improve the predictive power of the power, such as adding technical indicators
- Lastly, split the data into training, validation, and testing sets to evaluate how the strategy performs
Develop and backtest the strategy
Backtest the quantitative trading strategy with the collected data before deploying it into live markets. After traders choose the appropriate statistical/machine learning model, such as decision trees, regression analysis, etc., to analyze the data, they can stimulate the strategy based on historical data. This helps traders test the strategy under different market conditions.
Implement the strategy
After the strategy is developed and tested, it needs to be implemented. Ensure that the quantitative parameters are set properly so that trade execution is seamless.
Monitor and manage the strategy
Continuously monitor the strategy's performance metrics, including gains, risk exposure, and trade execution efficiency. Adjust the strategy as necessary in response to changing market conditions or unexpected outcomes.
Placing forex trades with quantitative trading
Quantitative trading enables traders to make objective decisions. However, it also has disadvantages, such as potential overfitting to historical data and reliance on complex models, which can lead to unexpected risks and technical failures. Hence, traders must ensure that they combine quantitative and qualitative analysis for better results.
Disclaimer: All material published on our website is intended for informational purposes only and should not be considered personal advice or recommendation. As margin FX/CFDs are highly leveraged products, your gains and losses are magnified, and you could lose substantially more than your initial deposit. Investing in margin FX/CFDs does not give you any entitlements or rights to the underlying assets (e.g. the right to receive dividend payments). CFDs carry a high risk of investment loss.