


Technical analysis provides valuable insights into potential price movements of commodities like oil, metals, and agricultural products by recognizing recurring patterns and signals within the data.
By understanding market psychology and behavior through technical analysis, traders can take advantage of price inefficiencies and capitalize on the commodity market's opportunities.
Let’s discuss how to use technical analysis for commodities trading.
Top technical indicators for commodities trading
Moving Averages Envelopes
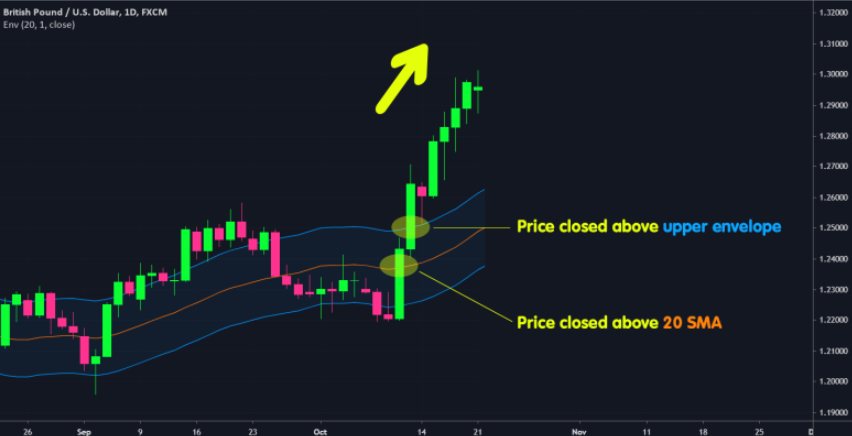
Moving Averages Envelopes consist of a moving average line and two parallel lines (envelopes) set above and below it at a fixed percentage distance. These envelopes help traders identify overbought and oversold conditions in a commodity's price.
It also helps traders identify price trends and potential reversal points. When the price moves outside the envelopes, it indicates a potential reversal or continuation of the trend.
Formula: Upper Envelope = Simple Moving Average (SMA) * (1 + Percentage/100)
Lower Envelope = Simple Moving Average (SMA) * (1 - Percentage/100)
Commodity Channel Index (CCI)
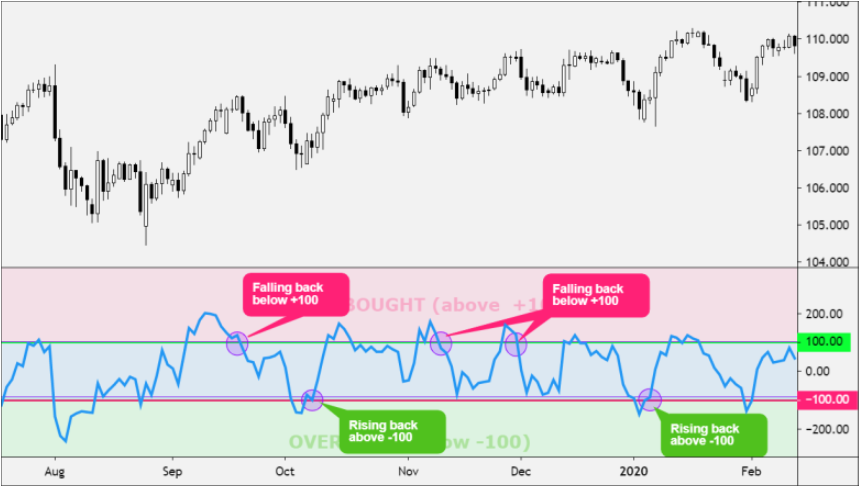
The Commodity Channel Index (CCI) is an indicator that can be used to identify a new trend or warn of extreme trading conditions. It measures the price deviation from its average price over a specific period.
It also helps in detecting overbought and oversold levels. A high CCI indicates that prices are unusually high compared to their average, while a low CCI indicates that prices are unusually low.
Formula: CCI = (Price - Moving Average) / 0.015*Mean Deviation
Demand Index
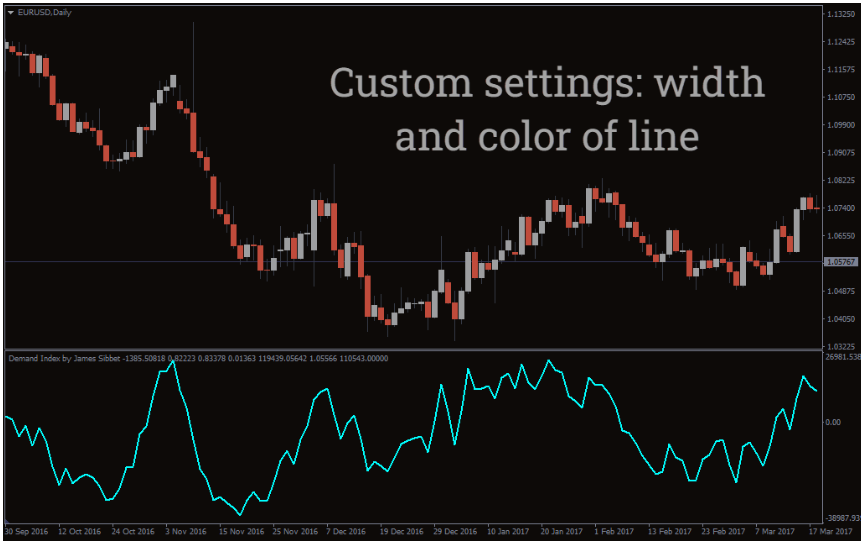
The Demand Index combines price and volume to measure the demand for a commodity. It helps traders understand the strength of a price move by considering price changes and trading volume.
A rising Demand Index suggests increasing demand and potential upward price movement, while a falling Demand Index indicates decreasing demand and potential downward price movement.
Formula: Demand Index = (Current Close - Previous Close) / Previous Close * Volume
Williams %R
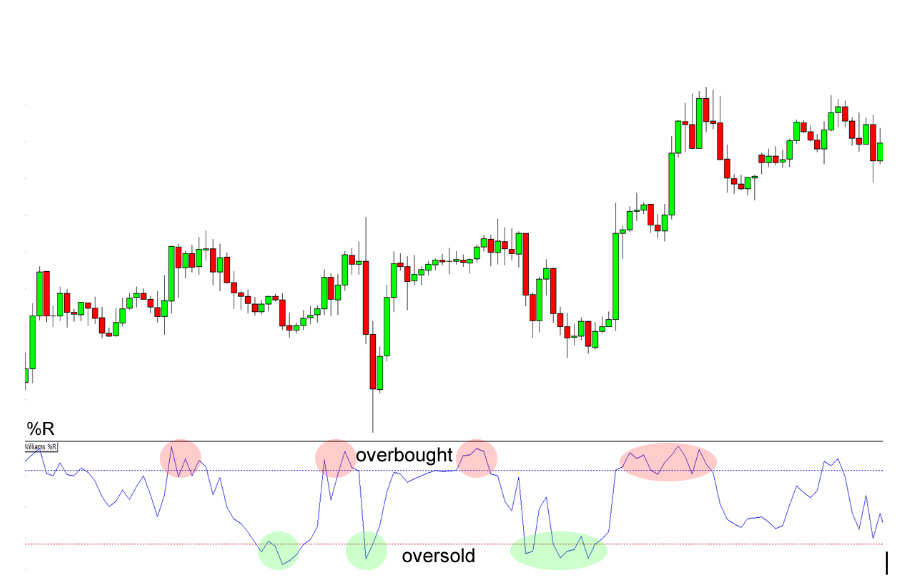
Williams %R is a momentum indicator that measures overbought and oversold levels to identify potential reversal points.
It compares the current closing price to the high-low range over a specified period. Readings between 0 and -20 indicate overbought conditions, while readings between -80 and -100 indicate oversold conditions.
Formula: %R = (Highest high - closing price)/(Highest high - lowest low)
Average True Range (ATR)
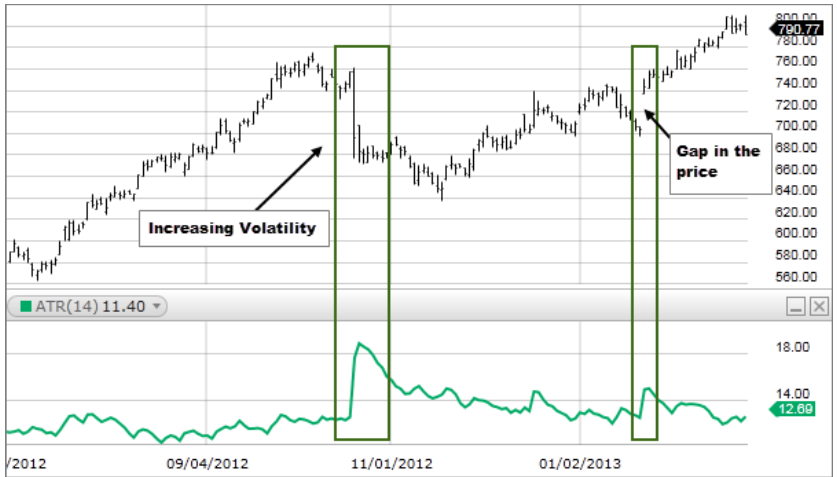
The Average True Range (ATR) measures commodity market volatility by averaging the true range over a specified period. It also helps traders in setting stop-loss levels.
The true range considers the greatest of the following: the current high minus the current low, the absolute value of the current high minus the previous close, and the absolute value of the current low minus the previous close. A higher ATR indicates higher volatility, while a lower ATR suggests lower volatility.
Formula: ATR = Average(TrueRange) over a given period.
Stepwise guide to use technical analysis to trade commodities
Select commodities to trade
The trader begins by selecting commodities (such as precious metals, energy, oil, agriculture, and more) based on market dynamics, liquidity, and volatility. They also consider supply and demand fundamentals, geopolitical events, and economic trends influencing commodity prices.
Understand market fundamentals
The trader then moves forward to gain an understanding of fundamental factors impacting commodity prices, including production levels, inventory data, and geopolitical tensions. They should stay updated with news and reports to make informed trading decisions.
Analyze historical price data
Utilizing historical price data, the trader identifies trends, patterns, and support/resistance levels in the commodity market. They conduct technical analysis using charts and indicators to assess price movements and anticipate future trends.
Incorporate technical indicators
Relevant technical indicators, such as moving averages, CCI, and more, are incorporated into the trader's analysis to gain insights into market trends and potential trading opportunities. The trader should select indicators that align with their trading strategy and objectives.
Monitor market sentiment
The trader monitors market sentiment and investor behavior, including the Commitments of Traders (COT) report (which provides insights into the positions of institutional traders to gauge market sentiment) and seasonal patterns. This helps gauge market sentiment and anticipate price movements.
Define entry and exit criteria
Establish clear entry and exit criteria based on the analysis and risk tolerance. Determine precise entry points based on technical indicators, support/resistance levels, and confirmation signals. Define exit points for taking gains and cutting losses to manage risk.
Monitor real-time market data
Continuously monitor real-time market data and price movements to stay informed about any developments or changes in market conditions. Use trading platforms, financial news sources, and charting tools to track commodity prices and market trends in real-time.
Execute trades
Execute trades based on the predefined entry and exit criteria when market conditions align with the trading strategy. Place orders to capitalize on identified trading opportunities while managing risk.
Manage Trades
Once trades are executed, actively manage them according to the trading plan. Monitor price movements, adjust stop-loss orders, and consider scaling in or out of positions as market conditions evolve.
Tips to use trade commodities
- Monitor commodity-specific factors such as weather patterns for agricultural commodities.
- Incorporate volatility indicators like Bollinger Bands to identify potential breakout opportunities in the commodity market.
- Evaluate demand trends in emerging markets to anticipate shifts in commodity consumption.
- Consider geopolitical factors affecting commodity-producing regions for insights into supply disruptions.
- Apply intermarket analysis by examining correlations between commodities and related markets like currencies or equities.
- Consider seasonality in commodity futures contracts, utilizing historical price patterns for entry and exit points.
Combine technical analysis with risk management
Technical analysis provides trading insights like support/resistance levels and potential entry/exit points. However, relying solely on technical analysis may pose risks, such as false signals, market volatility, and unexpected fundamental shifts. Hence, traders must complement technical analysis with thorough research and risk mitigation strategies.
Disclaimer: All material published on our website is intended for informational purposes only and should not be considered personal advice or recommendation. As margin FX/CFDs are highly leveraged products, your gains and losses are magnified, and you could lose substantially more than your initial deposit. Investing in margin FX/CFDs does not give you any entitlements or rights to the underlying assets (e.g. the right to receive dividend payments). CFDs carry a high risk of investment loss.