
 ภาษาไทย
 Tiếng Việt
The #GBPUSD monthly trend suggests we are entering an impulsive phase, but could the price head back towards the highs at 1.3900?
Watch the video to learn more…
The Monthly Chart
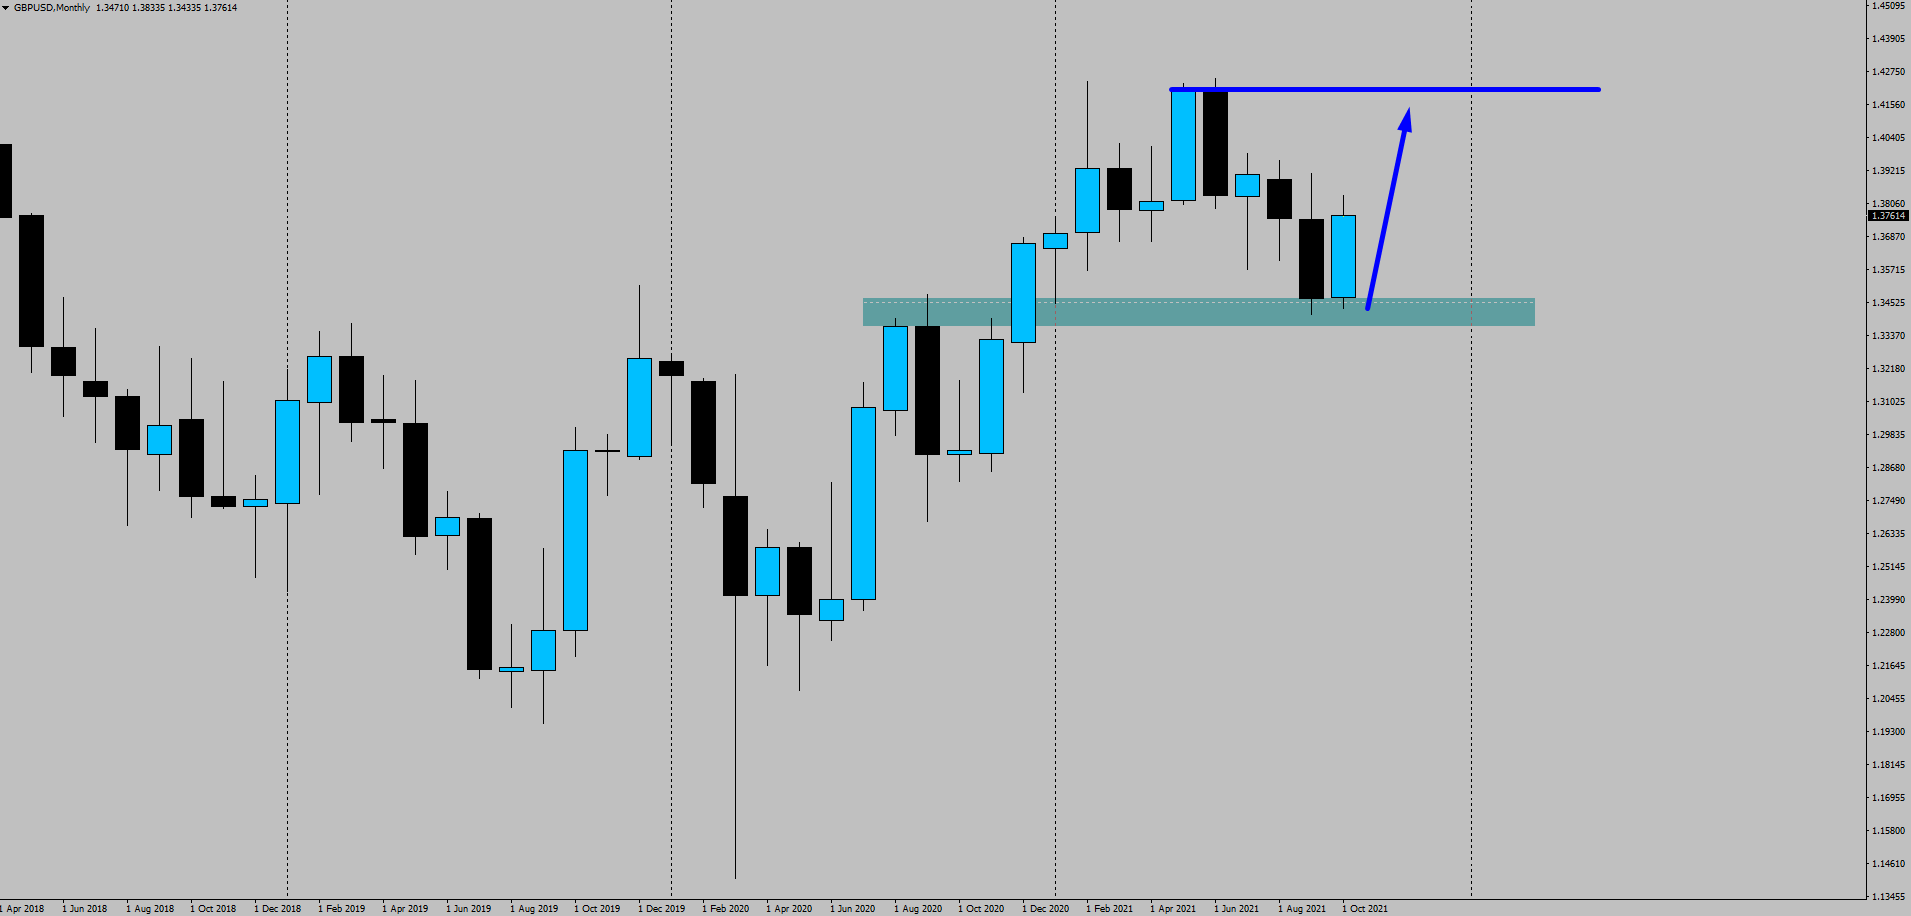
The monthly chart for GBPUSD shows the price currently rejecting the previous swing highs and potentially forming an impulsive phase. With the strength of the GBP currently and the Bank of England looking to hike interest rates we could see this market follow the monthly trend.
If this market is going into a monthly impulse phase we should see the price rally and head towards the major highs at 1.4200. The first target for this move however should be the current monthly highs which sit at 1.3900.
The 4hr Chart
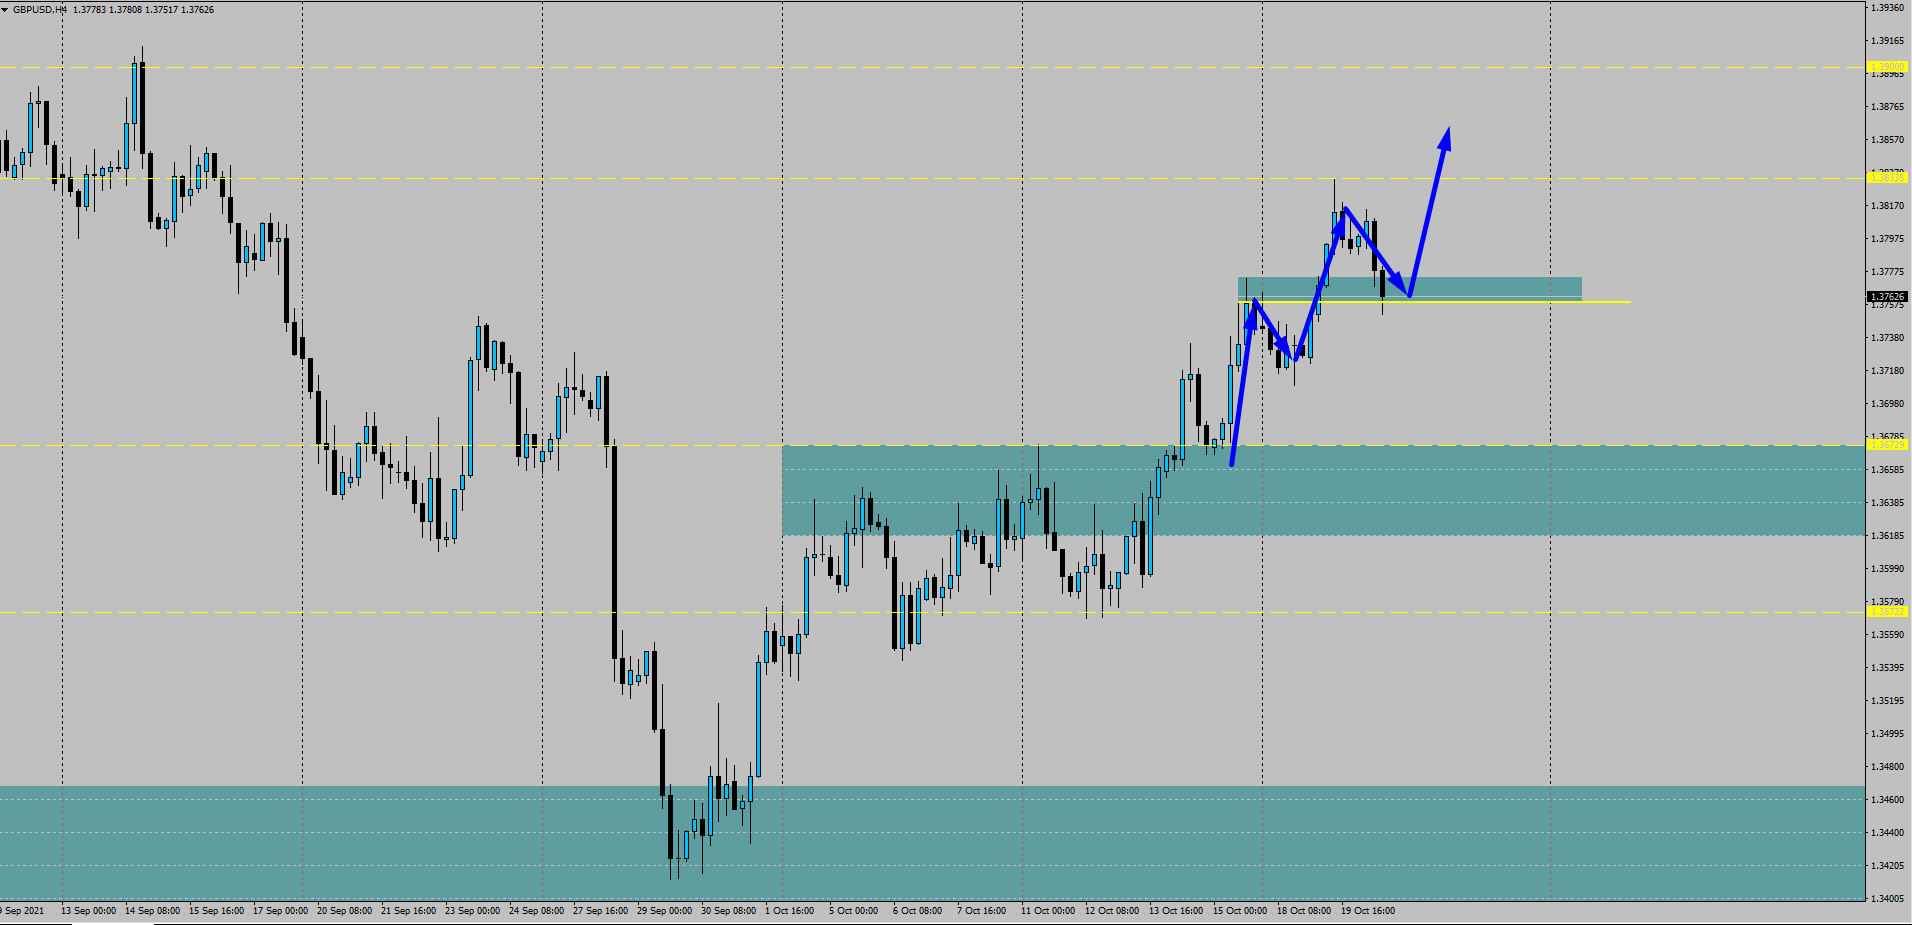
The 4hr chart currently shows the price in an uptrend making higher highs and higher lows. If this is going to continue we should see the market reject the support zone the price is currently at. If we see bullish price action here we could look for a long opportunity back into the swing highs and even towards the 1.3900 level.
The Trading Time Frame
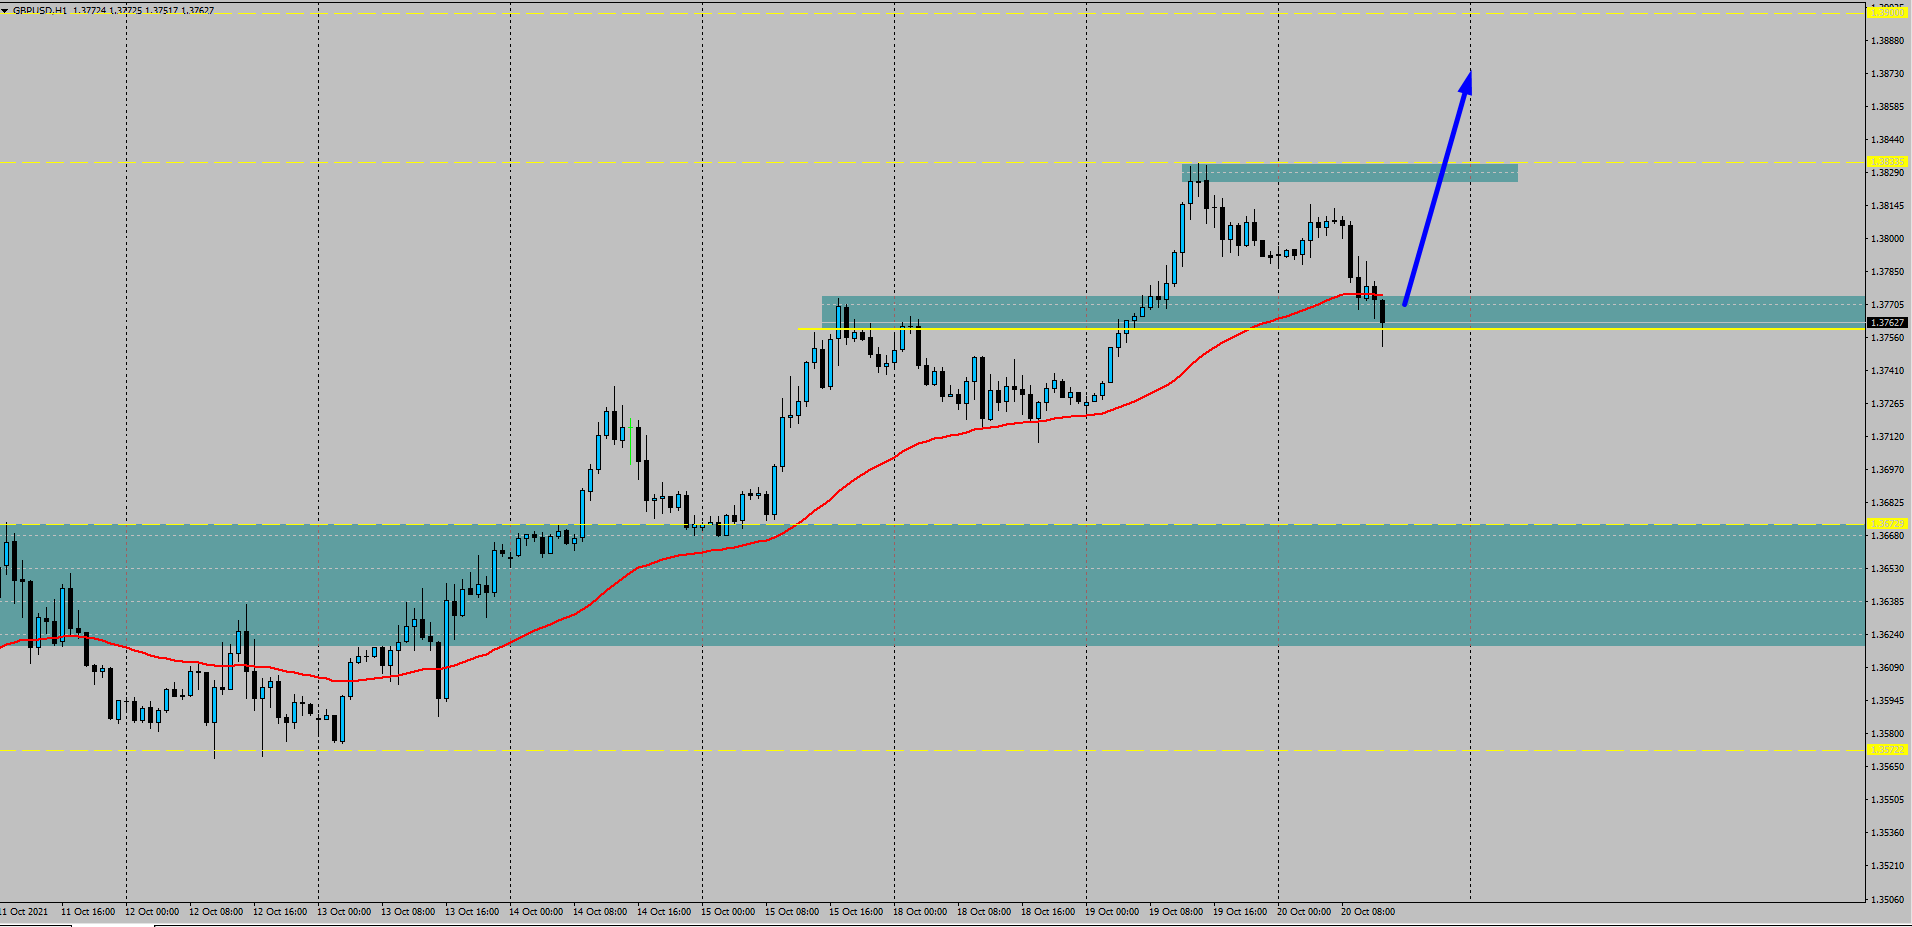
One way to look at this move would be to apply a swing trading strategy. The strategy we are going to use is the 1hr close above the 50 exponential moving average. If the price closes above this moving average we could see the 4hr impulsive phase begin.
Looking to trade EURUSD? Why don’t you watch our latest analysis here.
Enjoy low spreads and quick trade executions with a live account. Our highly committed customer support team will assist you from your quick account setup to any future concerns. Start trading with Blueberry Markets today.

